

Abstract
The binding of peptide-loaded major histocompatibility complex (pMHC) to the T cell receptor (TCR) represents the central step in T cell antigen recognition. It proceeds in the cell contact area between a T cell and an antigen-presenting cell termed the immunological synapse. An important and unresolved issue is how T cells discriminate between potentially harmful and harmless antigens. One limitation has been the difficulty to measure interaction parameters directly, that is, as they occur in the immunological synapse. Here we present a single-molecule approach to determine pMHC-TCR interaction kinetics in situ based on diffusion analysis of dye-labeled pMHC. We find synaptic off-rates >10-fold accelerated when compared to the dissociation of purified proteins measured in vitro.
Binding of TCRs to nominally stimulatory peptide-loaded major histocompatibility complex (pMHC) ligands is a key step in the recognition of antigen by T lymphocytes. Presentation of foreign peptides is a prerequisite for T cell activation and effector function and induces the formation of an immunological synapse (IS)—a highly organized cell contact between a T cell and an antigen-presenting cell (1). T cells are remarkably sensitive, as they can detect the presence of just one stimulatory ligand (2), i.e., agonist pMHCs, which are usually vastly outnumbered by MHCs presenting endogenous peptides. This task is met at the single cell level: each single T cell expresses a unique gene-recombined T cell receptor (TCR) with a given specificity for a particular pMHC, which it usually binds in the micromolar range (1–100 μM). It is an area of great interest to understand how the TCR-pMHC interaction is interpreted by the T cell. The two main models suggest the equilibrium dissociation constant KD (3) or the off-rate koff (4) as decisive parameters: KD describes the sensitive number of pMHC-TCR complexes at equilibrium, koff the duration of the interactions. Correlations between ligand potency and binding parameters, however, are impaired by the difficulty in obtaining precise measurements of pMHC-TCR interactions directly within the IS; by far most measurements in the available literature have been made on purified proteins in solution.
To our knowledge, there are only two studies in which binding kinetics of TCR-pMHC interactions were recorded in situ. Huang et al. (5) brought pMHC-coated beads in contact with CD8+ T cells and used adhesion frequency and thermal fluctuations to derive molecular interaction kinetics. In Huppa et al. (6), we used single-molecule Förster resonance energy transfer (FRET) between TCRs labeled with a fluorescent single-chain antibody fragment and dye-labeled pMHC to directly measure the pMHC-TCR interaction kinetics of CD4+ T cells synapsing with lipid bilayers. In both studies, substantially accelerated binding kinetics were found in situ compared to binding measured in solution. The two approaches, however, have drawbacks: biomembrane force probing is a rather indirect method that takes into consideration initial binding events taking place after induced surface contact. Our previous single-molecule FRET measurements were based on a recombinant antibody-derived FRET probe binding specifically to the TCR. Although we did not detect any influence of the probe on the sensitivity of T cells toward antigen, we could not exclude the possibility that its presence affects TCR-pMHC binding dynamics.
Here we analyzed the duration and frequency of the transient halts of single bilayer-embedded fluorescent pMHC class II molecules as they bind to the TCR, yielding both the kinetic off-rate and the equilibrium dissociation constant KD. In analogy to our previous work (6), we characterized the peptide-specific interaction between the peptide-complexed MHC molecule I-Ek and the 5c.c7 TCR in the interface of primary CD4+ T cells with a functionalized lipid bilayer within the first 20 min after seeding the cells onto the bilayer. As presented peptides, we chose the strongly agonistic MCC, the weakly agonistic MCC-variant T102S, and the endogenous self-peptide β2m. In our in situ FRET studies, MCC showed strong binding to the TCR, T102S weak binding, and β2m no detectable binding at 37°C (6).
MHC loaded with Cy5-labeled peptide, (Cy5-p)MHC, was anchored via two His6-tags to a glass-supported fluid lipid bilayer (see Fig. S1 in the Supporting Material). In addition, the membrane was also functionalized with the adhesion molecule ICAM-1 and the costimulatory molecule B7.1. Using single-molecule brightness analysis, we had previously shown that, under the applied conditions, (Cy5-p)MHC is monomeric (6). To be able to resolve and track individual molecules over multiple frames even at high surface densities of (Cy5-p)MHC, we reduced the density of visible spots by gentle photobleaching down to the desired levels. In general, (Cy5-p)MHC molecules were observed as rapidly moving diffraction-limited signals. Before the addition of T cells, it was freely mobile with a diffusion constant Dbilayer∼0.7 μm2/s; no mobility variation was observed for the three pMHC variants (Fig. 1 and Fig. 2 A). Upon addition of 5c.c7 T cells, the mobility of the strong agonist (Cy5-MCC)MHC was found to be reduced to ∼56% in the interface region of the T cell with the functionalized lipid bilayer; in contrast, the two other peptides did not show substantial reduction (Fig. 2 A, shaded bars), even under stimulatory conditions (see Fig. S2).
Figure 1.
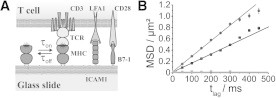
(A) Sketch of the method. (B) Diffusion was analyzed by plotting the mean-square displacement (MSD) as a function of the time-lag tlag. It shows exemplary data obtained for (Cy5-MCC)MHC measured within (squares) or outside (circles) the interface of the bilayer with the T cell. A linear fit yielded D = 0.38 μm2/s ± 0.01 μm2/s and Dfree = 0.68 μm2/s ± 0.01 μm2/s. Additionally the diffusion analysis of FRET events (shaded) yielded Dbound = 0.004 μm2/s ± 0.003 μm2/s. Data were recorded at 37°C with σ(Cy5−MCC)MHC = 30 molecules/μm2.
Figure 2.

Mobility changes of pMHCs upon binding to the TCR. (A) The diffusion constants of (Cy5-p)MHCs were determined in the lipid bilayer outside (solid) and within the interface between the lipid bilayer and the T cell (shaded) for the peptides MCC, T102S, and β2m. σMCC = σT102S = 30 molecules/μm2; σβ2m = 15 molecules/μm2. (B) The diffusion constant of (Cy5-MCC)MHC was obtained in the IS for various surface densities (error bars smaller than marker size). (Dashed line) Fit to Eq. S1 in the Supporting Material, assuming Dfree = 0.69 μm2/s, Dbound = 0 μm2/s, and σTCR-total = 40 molecules/μm2, yielding KD = 35 molecules/μm2.
We reasoned that the reduction in the average mobility was due to the transient binding of (Cy5-p)MHC to the TCR. Indeed, there was hardly any further mobility change upon reducing the surface density of (Cy5-MCC)MHC to values σ < 30 molecules/μm2. Interestingly, however, the average mobility increased with increasing σ, as is expected if the (Cy5-p)MHC molecules competed for the limited number of TCRs (Fig. 2 B, left axis). To quantitatively interpret the binding curve we applied a linear model for the average (Cy5-p)MHC mobility Dp = xpDbound + (1 − xp)Dfree, with xp describing the fraction of (Cy5-p)MHC bound to the TCR, Dfree and Dbound the respective mobility of pMHC in its free and bound state. Dfree can be well approximated by Dbilayer, the diffusion constant of the (Cy5-p)MHC outside the bilayer-T cell interface. To determine Dbound we reanalyzed our recently published FRET experiments (6) for the mobility of the observed pMHC-TCR complexes detected by their FRET signal. We found no significant mobility on a seconds timescale (Fig. 1 and see Fig. S3) and thus set Dbound = 0 μm2/s for the following analysis. On the right axis of Fig. 2 B we plotted xp. From the binding curve the dissociation constant KD,MCC = 35 molecules/μm2 was determined, which is in good agreement with our previous FRET experiments (6).
To address the kinetics of the interactions, we analyzed single-molecule trajectories of (Cy5-MCC)MHC in more detail. Naturally, binding of the TCR to pMHC will lead to short periods of immobilization interrupting free diffusion. Photobleaching, however, limited the length of single-molecule trajectories to ∼4.2 observations on average, rendering the direct identification of the time-points of transition impossible. We therefore reverted to a different approach, which is based on statistical analysis of each molecule's estimated diffusion constant (7). The idea can be best described by a data set that was obtained at 28°C. Fig. 3 A shows the probability density functions (pdfs) of an estimator for the single-molecule diffusion constant, = 〈sd/4tlag〉, where sd denotes all observed square displacement steps within a given trajectory, and tlag the according time lag.
Figure 3.

Binding probabilities and lifetimes for the interaction of (Cy5-MCC)MHC with the TCR. The distribution of the single-molecule diffusion constants is shown for experiments at 28°C (A) and 37°C (C). (Shaded and solid lines) Data recorded outside and within the IS, respectively. Experiments were performed at σ = 30 molecules/μm2. The data sets obtained at 28°C (B) and 37°C (D) were compared to comprehensive Monte Carlo simulations using the following fixed parameters for the simulations: Dbound = 0 μm2/s, Dfree = 0.52 μm2/s (28°C), and Dfree = 0.69 μm2/s (37°C). (Solid line) The 5% significance contour.
When we analyzed (Cy5-MCC)MHC molecules diffusing freely outside the T cell interface, we obtained a rather symmetric peak for with a maximum ∼ 0.6 μm2/s. The large width of the distribution is mainly a consequence of uncertainties in determining the precise value of the single-molecule mobility due to the low number of observations per molecule. Interestingly, the distribution of measured inside the IS yielded two pronounced and well-separated peaks, one representing the freely diffusing subfraction, and the second the bound subfraction. Apparently, the parameters of the experiment happened to be such that hardly any transitions occurred during the whole duration of the individual trajectories; essentially, trajectories either corresponded to bound or free pMHC.
To quantitatively analyze such probability distributions, we recently introduced a comprehensive testing approach (7). Briefly, Monte Carlo simulations were performed to model the observed diffusion process, taking into account exponentially distributed inverse on- and off-rates τon, τoff, as well as photobleaching; we also considered localization errors δ for the single-molecule positions. From the simulations, probability distributions of were obtained and compared with the experimental data via a statistical test. Simulations and tests were performed in a two-dimensional subspace defined by 30% ≤ xp ≤ 60%, 0.01 s ≤ τoff ≤ 2 s; xp = τoff/τon again denotes the bound fraction. The resulting p-values were plotted in Fig. 3 B. Only a small circular area at xp ∼ 48 ± 4% and τoff = 0.2 ± 0.1 s shows a p-value >0.05, indicating that this parameter regime is in agreement with the experiments; all other parameter regimes can be ruled out.
We further analyzed data obtained at 37°C (Fig. 3 C; a data set recorded at σ = 30 molecules/μm2 was chosen here). The pdf for freely diffusing (Cy5-MCC)MHC molecules outside the interface looks similar to the data obtained at 28°C. In contrast, the pdf in the T cell interface now shows a single peak with a pronounced shoulder toward low diffusion constants. Apparently, the transition kinetics is now much faster; multiple transitions within a single-molecule trajectory resulted in a reduced mobility that approximated the ensemble average. Consistently, the quantitative analysis shows now substantially accelerated binding kinetics at τoff ≤ 0.1 s and a somewhat reduced bound fraction xp = 41 ± 6%. Naturally, the bound fraction matches the results shown in Fig. 2 B. Moreover, the obtained interaction lifetime τoff is in very good agreement with the previously published FRET approach, where we reported for the same conditions τoff = 150 ms. We further analyzed the diffusion of (Cy5-T102S)MHC and (Cy5-β2m)MHC (see Fig. S4). Consistent with Fig. 2 A, we derived much lower bound fractions at ∼7%; due to the low affinity, however, the diffusion constant distributions did not contain sufficient information for quantification of the interaction kinetics.
In conclusion, we confirm here the accelerated in situ kinetics of pMHC-TCR interactions based on the analysis of transient pMHC immobilizations. This approach does not require labeling of the TCR, which has two advantages: First, no specific tag to the TCR has to be designed, making the method easier to implement; and second, the presence of a bulky tag may, in some cases, affect the binding kinetics. Thus, this new approach is more reliable (for a further discussion, see the Supporting Material).
Acknowledgments
This work was supported by the GEN-AU project of the Austrian Federal Ministry for Science and Research and the Austrian Science Fund (FWF project Y250-B10) to G.J.S.; M.A. was supported by the Max Planck Society and the Schrödinger Fellowship program (project. J3086). M.M.D. was supported by grants from the National Institutes of Health (RO1 AI52211) and the Howard Hughes Medical Institute; J.B.H. was partially supported by the Immunology Frontier Research Center consortium, the National Institutes of Health (RO1 AI52211), and the Howard Hughes Medical Institute.
Footnotes
Markus Axmann's present address is Max Planck Institute for Intelligent Systems, Department of New Materials and Biosystems, Stuttgart, Germany.
Johannes Huppa's present address is Medical University of Vienna, Center for Pathophysiology, Infectology and Immunology, Institute of Hygiene and Applied Immunology, Immune Recognition Unit, Vienna, Austria.
This is an Open Access article distributed under the terms of the Creative Commons-Attribution Noncommercial License (http://creativecommons.org/licenses/by-nc/2.0/), which permits unrestricted noncommercial use, distribution, and reproduction in any medium, provided the original work is properly cited.
Supporting Material
References and Footnotes
- 1.Grakoui A., Bromley S.K., Dustin M.L. The immunological synapse: a molecular machine controlling T cell activation. Science. 1999;285:221–227. doi: 10.1126/science.285.5425.221. [DOI] [PubMed] [Google Scholar]
- 2.Irvine D.J., Purbhoo M.A., Davis M.M. Direct observation of ligand recognition by T cells. Nature. 2002;419:845–849. doi: 10.1038/nature01076. [DOI] [PubMed] [Google Scholar]
- 3.Tian S., Maile R., Frelinger J.A. CD8+ T cell activation is governed by TCR-peptide/MHC affinity, not dissociation rate. J. Immunol. 2007;179:2952–2960. doi: 10.4049/jimmunol.179.5.2952. [DOI] [PubMed] [Google Scholar]
- 4.Rabinowitz J.D., Beeson C., McConnell H.M. Kinetic discrimination in T-cell activation. Proc. Natl. Acad. Sci. USA. 1996;93:1401–1405. doi: 10.1073/pnas.93.4.1401. [DOI] [PMC free article] [PubMed] [Google Scholar]
- 5.Huang J., Zarnitsyna V.I., Zhu C. The kinetics of two-dimensional TCR and pMHC interactions determine T-cell responsiveness. Nature. 2010;464:932–936. doi: 10.1038/nature08944. [DOI] [PMC free article] [PubMed] [Google Scholar]
- 6.Huppa J.B., Axmann M., Davis M.M. TCR-peptide-MHC interactions in situ show accelerated kinetics and increased affinity. Nature. 2010;463:963–967. doi: 10.1038/nature08746. [DOI] [PMC free article] [PubMed] [Google Scholar]
- 7.Wieser S., Axmann M., Schütz G.J. Versatile analysis of single-molecule tracking data by comprehensive testing against Monte Carlo simulations. Biophys. J. 2008;95:5988–6001. doi: 10.1529/biophysj.108.141655. [DOI] [PMC free article] [PubMed] [Google Scholar]
- 8.Wieser S., Moertelmaier M., Schütz G.J. (Un)confined diffusion of CD59 in the plasma membrane determined by high-resolution single molecule microscopy. Biophys. J. 2007;92:3719–3728. doi: 10.1529/biophysj.106.095398. [DOI] [PMC free article] [PubMed] [Google Scholar]
Associated Data
This section collects any data citations, data availability statements, or supplementary materials included in this article.