

Abstract
Adenylyl cyclases (ACs) are important regulators of airway smooth muscle function, because β-adrenergic receptor (βAR) agonists stimulate AC activity and cAMP production. We have previously shown in a number of cell types that AC6 selectively couples to βAR and these proteins are coexpressed in lipid rafts. We overexpressed AC2, AC3, and AC6 in mouse bronchial smooth muscle cells (mBSMCs) and human embryonic kidney (HEK)-293 cells by using recombinant adenoviruses and assessed their localization and regulation by various G protein-coupled receptors (GPCRs). AC3 and AC6 were expressed primarily in caveolin-rich fractions, whereas AC2 expression was excluded from these domains. AC6 expression enhanced cAMP production in response to isoproterenol but did not increase responses to butaprost, reflecting the colocalization of AC6 with β2AR but not E prostanoid type 2 receptor (EP2R) in lipid raft fractions. AC2 expression enhanced butaprost-stimulated cAMP production but had no effect on the β2AR-mediated response. AC3 did not couple to any GPCR tested. Forskolin-induced arborization of mBSMCs was assessed as a functional readout of cAMP signaling. Arborization was enhanced by overexpression of AC6 and AC3, but AC2 had no effect. GPCR-stimulated arborization mirrored the selective coupling observed for cAMP production. With the addition of the phosphodiesterase 4 (PDE4) inhibitor rolipram AC2 accelerated forskolin-stimulated arborization. Thus, AC2 selectively couples to EP2R, but signals from this complex are limited by PDE4 activity. AC3 does not seem to couple to GPCR in either mBSMCs or HEK-293 cells, so it probably exists in a distinct signaling domain in these cells.
Introduction
Smooth muscle tone is influenced by extracellular hormones and neurotransmitters, many of which activate G protein-coupled receptors (GPCRs) that modulate the activity of effector enzymes and the level of intracellular second messengers. Intracellular calcium and cAMP, which are key second messengers of GPCRs, exert opposite effects on smooth muscle contraction, with Ca2+ causing contraction and cAMP inducing relaxation (Torphy et al., 1982; Billington and Penn, 2003). β-Adrenergic receptor (βAR) agonists, which stimulate cAMP production via activation of Gs and adenylyl cyclase (AC) activity, induce relaxation of smooth muscle (Kume et al., 1994). However, several investigators have found that βAR agonists induce relaxation of airway smooth muscle via both cAMP-dependent and -independent mechanisms, possibly indicating other roles for cAMP signaling (Torphy, 1994; Ostrom and Ehlert, 1998; Spicuzza et al., 2001). In addition, other hormones can regulate cAMP production in smooth muscle. GPCR-mediated stimulation or inhibition of AC activity regulates the formation of cAMP, which, via its activation of PKA, initiates both rapid actions, such as regulation of ion channels and effects on carbohydrate, protein and lipid metabolism, and more delayed effects, such as changes in gene expression, cell growth, and proliferation (Billington et al., 1999; Scott et al., 1999).
Nine different transmembrane AC isoforms exist, each with different amino acid sequences, tissue and chromosomal distribution, and regulation (Hurley, 1999; Hanoune and Defer, 2001). Differences in regulation include stimulation or inhibition by Gβγ, Ca2+, and various protein kinases. AC5 and AC6 represent a subfamily of ACs related in structure and regulation. These isoforms are inhibited by PKA, Ca2+, nitric oxide, Gi, and Gβγ (McVey et al., 1999; Hill et al., 2000; Hanoune and Defer, 2001). In contrast, AC3 can either be stimulated by Ca2+/calmodulin or specifically inhibited by calmodulin kinase II, whereas AC2 is activated by Gβγ (Wei et al., 1996; Hanoune and Defer, 2001). Although these unique properties of AC isoforms have been appreciated for some time (based on reconstituted enzymatic assays), the effect these features have on cell physiology are poorly understood (Sadana and Dessauer, 2009). One likely reason is the fact that most cells express at least three or four different AC isoforms, implying a high degree of duplicity (Ostrom and Insel, 2004). In addition, because all ACs are activated by the same G protein and there are no good isoform-specific activators, the means by which one can selectively activate an AC isoform have been lacking.
It is becoming a commonly accepted notion that various proteins involved in GPCR signal transduction are enriched and spatially organized within plasma membrane microdomains (Neubig, 1994; Steinberg and Brunton, 2001; Ostrom, 2002). Numerous studies have focused on caveolae and lipid rafts as membrane microdomains where receptors, G proteins, effector molecules, and even second messengers are concentrated (Shaul and Anderson, 1998; Davare et al., 2001; Ostrom and Insel, 2004). Caveolae are cholesterol- and sphingolipid-enriched portions of the membrane that form distinct flask-like invaginations when the protein caveolin is expressed (Anderson, 1998). Lipid rafts are microdomains of the plasma membrane that are biochemically similar to caveolae but morphologically indistinguishable from the rest of the plasma membrane (Hooper, 1999; Simons and Toomre, 2000; Galbiati et al., 2001). Data from several cell types indicate that AC6 selectively couples to βAR and not prostanoid EP receptors because of colocalization of AC6 and βAR in lipid rafts (Ostrom et al., 2001; Liu et al., 2008; Bogard et al., 2011). Nonraft localized EP receptors activate cAMP production, but it is unknown which AC isoforms they couple to for regulating cell function.
The goal of this study was to determine the receptor coupling and functional consequences of two other AC isoforms, AC2 and AC3, and determine which ACs EP receptors signal through. In mBSMCs and HEK-293 cells, AC2 is excluded from lipid raft domains and is regulated primarily by nonraft localized EP2 receptors. AC3 is localized to lipid raft fractions, much like AC6, but did not couple efficiently to any receptor we examined. Regulation of a downstream response, arborization, was also different between AC isoforms, with AC3 and AC6 able to accelerate arborization of mBSMCs but AC2 unable to because of phosphodiesterase (PDE) activity. These data support the idea that GPCR-AC signaling can be highly compartmentalized and underscore the importance of defining the signaling proteins in these complexes and their functional endpoints.
Materials and Methods
Materials.
Primary antibodies for caveolin-1 (monoclonal), caveolin-2 (monoclonal), and caveolin-3 (monoclonal) were obtained from BD Biosciences (San Jose, CA). Primary antibodies for AC5/6 (polyclonal), AC2 (polyclonal), AC3 (polyclonal), β2-adrenergic receptor (polyclonal), and EP2 receptor (polyclonal) were obtained from Santa Cruz Biotechnology, Inc. (Santa Cruz, CA). PDE4 primary antibody (polyclonal) was obtained from FabGennix (Frisco, TX). Secondary antibodies were obtained from Santa Cruz Biotechnology, Inc. Beraprost and butaprost were obtained from Cayman Chemical (Ann Arbor, MI). All other chemicals and reagents were obtained from Sigma-Aldrich (St. Louis, MO).
Isolation of mBSMCs.
Male FVB/N mice (Charles River Laboratories, Wilmington, MA) were euthanized by intraperitoneal injection of ketamine/xylazine followed by exsanguination. Lungs with major airways were removed and put into Krebs buffer. Lower trachea and first bronchial branches were carefully dissected free of fatty and connective tissues and opened by cutting the cartilage rings opposite to the trachealis muscle. The airways were then incubated with collagenase type F (2 mg/ml) and type H (1 mg/ml), under gentle agitation, at 37°C for 10 min. Single cells were picked with a micropipette under a microscope then cultured in SmGM-2 medium (Lonza Biosciences, Walkersville, MD). Cells were used the next day or cultured 3 to 5 days when larger cell populations were required.
Reverse-Transcriptase-Polymerase Chain Reaction.
AC isoform expression was assessed by RT-PCR using the primer pairs described previously (Bogard et al., 2011). Total RNA was extracted from mBSMCs grown to 60 to 70% confluence by using a RNeasy RNA isolation kit (QIAGEN, Valencia, CA). A DNase reaction was performed to eliminate DNA contaminants, and the RNA was reverse-transcribed by using Superscript II (Invitrogen, Carlsbad, CA) and poly(dT) primer. PCRs with each primer pair were performed on cDNA, genomic DNA (positive control), and minus RT (negative control). The thermal profile for the reactions was 50°C for 2 min and 95°C for 10 min, followed by 35 cycles of 95°C for 10 s and 60 to 62°C for 1 min. PCR products were analyzed by agarose gel electrophoresis and visualized under UV light with ethidium bromide.
Measurement of cAMP accumulation.
mBSMCs were grown to 70% confluence then washed three times with serum- and NaHCO3-free Dulbecco's modified Eagle's medium supplemented with 20 mM HEPES, pH 7.4. After equilibration at 37°C for 30 min, cells were incubated with the indicated drugs plus 0.2 mM isobutylmethylxanthine, a broadly specific PDE inhibitor, for 10 min. In some assays, isobutylmethylxanthine was omitted, and incubation times were shortened to 5 min. Assay medium was aspirated, and 200 μl of 7.5% trichloroacetic acid was added to each well to terminate each reaction. cAMP content of the lysis buffer extract was quantified by using the cAMP EIA Kit (Cayman Chemical) according to the manufacturer's acetylation protocol. Data were normalized to the amount of protein in each sample, which was measured by using a dye-binding protein assay (Bio-Rad Laboratories, Hercules, CA). HEK-293 cells were grown to 80% confluence then incubated for 16 h with 1 μCi/well of [3H]adenine. Cells were washed three times with serum- and NaHCO3-free Dulbecco's modified Eagle's medium supplemented with 20 mM HEPES, pH 7.4. After equilibration at 37°C for 30 min, cells were incubated with the indicated drugs plus 0.2 mM isobutylmethylxanthine for 10 min. Assay medium was aspirated, and 250 μl of 7.5% trichloroacetic acid was added to each well to terminate each reaction. Approximately 1000 cpm of [32P]cAMP was added to each sample as an internal standard, then [3H]cAMP and [3H]ATP were separated by using the chromatography method described by Salomon et al. (1974). Loss of internal standard was used to correct each sample before expressing data as percentage of conversion of cAMP from ATP.
Nondetergent Isolation of Caveolar and Noncaveolar Membranes.
Cells grown to 70 to 80% confluence were washed twice in cold phosphate-buffered saline (PBS), 1.5 ml of 500 mM sodium carbonate, pH 11, was added, and cells were scraped off the plate. Cells were homogenized with 20 strokes in a tissue grinder followed by three 20-s bursts with an ultrasonic cell disruptor on medium power. A 1-min rest period was included in between each ultrasonic burst. An equal volume of 90% sucrose in MBS (25 mM 4-morpholineethanesulfonic acid and 150 mM NaCl, pH 6.5) was added to the homogenate to make 45% sucrose and loaded in an ultracentrifuge tube. Two discontinuous sucrose layers were formed on top of the sample by placing 2 ml of 35% sucrose in MBS with 250 mM sodium carbonate then adding 1 ml of 5% sucrose (also in MBS/Na2CO3). The gradient was centrifuged at 46,000 rpm on a SW55Ti rotor (Beckman Coulter, Fullerton, CA) for 16 h at 4°C. Fractions were collected from the top in 0.5-ml increments, yielding a total of 10 fractions. An equal volume of each individual fraction was then subjected to SDS-polyacrylamide gel electrophoresis (10% polyacrylamide) before being transferred to a polyvinylidene difluoride membrane (Millipore Corporation, Billerica, MA) via electroblotting. After blocking membranes in 20 mM PBS with 3% nonfat dry milk, primary antibody was added for 12 h at 4°C with constant rocking. Bound primary antibodies were visualized by using appropriate secondary antibody with conjugated horseradish peroxidase (Santa Cruz Biotechnology, Inc.) and ECL reagent (Thermo Fisher Scientific, Waltham, MA). Some primary antibodies recognized multiple nonspecific protein species. In these cases, appropriately sized immunoreactive bands were identified based on the expected molecular weight of the protein of interest, and only those bands are shown here.
Immunofluorescent Confocal Microscopy.
mBSMCs were fixed in 3% paraformaldehyde/PBS at room temperature for 15 min and permeabilized with 0.1% Brij 98/PBS for 2 min. Cells were incubated with primary monoclonal antibody for 2 to 4 h followed by a fluorochrome-conjugated secondary antibody at room temperature for 1 h. Cells were imaged by using a Bio-Rad 1024 confocal microscope (Bio-Rad Laboratories). For confocal microscopic analysis, cell samples were visualized by using single-line excitation at 488 nm or 555 nm for green fluorescent protein or Alexa 594, respectively, with appropriate emission filters. In each experiment, approximately 70 to 100 cells were analyzed for each treatment, and each experiment was performed at least three times.
Arborization.
mBSMCs were cultured in chamber slides and incubated for 24 h with the indicated recombinant adenovirus. Titer of each virus was optimized to obtain similar increases in forskolin-stimulated cAMP production. Cells were placed on a heated stage and visualized with a digital inverted microscope with a differential interference contrast objective. Images were captured before and each minute after addition of either forskolin (0.1 μM), isoproterenol (0.1 μM), beraprost (0.3 μM), or butaprost (0.3 μM) for a total of 40 min. Pixel intensity of individual cells was calculated for each frame, and the change in intensity was expressed as a percentage of basal (before drug addition). Three to four cells per experiment were analyzed then averaged to obtain a single rate of arborization for each condition in that experiment. The arborization rate was then expressed relative to the rate measured in control (lacZ) cells from the same experiment.
Data Analysis and Statistics.
Data are presented as the mean ± S.E.M., and in some cases as representative images, of at least three separate experiments. Statistical comparisons (t tests and one-way analysis of variance) and graphics were performed by using Prism 5.0 (GraphPad Software Inc., San Diego, CA).
Results
To study the signaling by overexpressed AC isoforms one must first define the native expression of AC isoforms. We performed RT-PCR analysis with isoform-specific primers to detect mRNA for each of the nine mammalian, G protein-regulated AC isoforms in mBSMCs. Although RNA template (sample not treated with reverse transcriptase) yielded no PCR product for any of the primers, we did detect appropriately sized PCR products for β-actin (positive control), AC1, AC3, and AC5 (Fig. 1A). In some experiments we detected faint bands for AC4, but we were unable to sequence this small amount of PCR product. Sequencing each of these PCR products confirmed the appropriate sequence. Thus, mBSMCs express AC1, AC3, and AC5 mRNA and possibly low levels of AC4.
Fig. 1.

A, AC isoform mRNA expression in mBSMCs was measured by RT-PCR. AC isoform-specific primer pairs were used with 35 cycles of RT-PCR (see Materials and Methods). Representative images of three experiments are shown. Arrows indicate expected sizes of PCR product. Molecular weight markers (MW) are shown in the first lane. β-Actin primers were used with no reverse transcriptase (noRT) or cDNA (β-actin) templates. B, cAMP accumulation in whole cells pretreated with IBMX was measured (see Materials and Methods) in response to various agonists known to stimulate AC activity in other cells. Data are presented as mean ± S.E.M. (n = 3–4). *, p < 0.05; **, p > 0.01 by paired t test compared with basal (no drug). Fsk, forskolin; Iso, isoproterenol; Buta, butaprost; Bera, beraprost;NECA, adenosine-5′N-ethylcarboxamide; CGRP, calcitonin gene-related peptide.
To determine the expression of receptors capable of stimulating AC activity in mBSMCs, we measured cAMP accumulation in response to maximal or near-maximal concentrations of agonists selective for GPCR known to couple to Gs in other cells. Ten minutes after drug addition and in the presence of a phosphodiesterase inhibitor, IBMX, we detected increased cAMP levels in response to the AC activator forskolin (10 μM), isoproterenol (1 μM), prostaglandin E2 (PGE2; 1 μM), butaprost (1 μM), beraprost (1 μM), and adenosine-5′N-ethylcarboxamide (1 μM). We did not detect increased cAMP levels after incubating mBSMCs with calcitonin gene-related peptide (Fig. 1B), pituitary adenylate cyclase-activating peptide, 5-hydroxytryptamine, or dopamine (data not shown). These data are consistent with the expression of βAR, prostaglandin EP2/4R, prostacyclin IPR, and adenosine A2a/2b receptors in mBSMCs.
We next sought to understand the localization of AC isoforms and GPCR expressed in mBSMCs by fractionating cells and isolating lipid raft fractions. Using a nondetergent method to fractionate cells, we detected expression of all three isoforms of caveolin in buoyant fractions from mBSMCs (Fig. 2). Immunoblot analysis from native mBSMCs using isoform-specific antibodies detected only faint bands for AC3 and AC5/6 (the latter antibody is unable to differentiate between AC5 and AC6 isoforms) and no bands of appropriate size for other AC isoforms (Supplemental Fig. 1). We did not attempt to detect AC1 expression, because no suitable antibody is commercially available. We did detect native β2AR and EP2R expression by immunoblot analysis, with β2AR expressed exclusively in buoyant, lipid raft fractions enriched in caveolins and EP2R detected only in nonraft fractions (Fig. 2). PDE4 exists in four different genes (PDE4A-D), each with splice variants that yield 15 different isoforms (Houslay and Adams, 2003). Some PDE4 isoforms localize to lipid rafts (Abrahamsen et al., 2004). We detected multiple PDE4 isoforms (using a pan-PDE4 antibody), primarily in nonraft fractions, but immunoreactivity for one isoform was faintly detectible in lipid raft fractions.
Fig. 2.
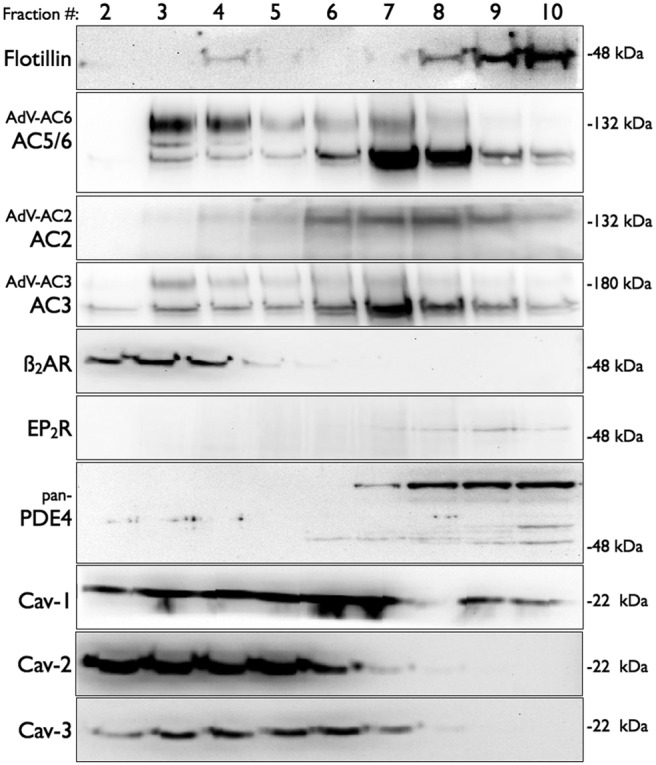
Immunoblot analysis of fractions from lipid raft isolation from mBSMCs. Cells were fractionated by using a nondetergent method and separated by sucrose density centrifugation (see Materials and Methods). Gradients were collected in 10 0.5-ml fractions and analyzed for appropriate separation of marker proteins (data not shown). Fractions were separated by SDS-polyacrylamide gel electrophoresis and analyzed by immunoblotting by using the indicated primary antibody. In some studies, cells were incubated with recombinant adenoviruses expressing AC2, AC3, or AC6 for 24 h. Shown are regions of the gels at the approximate molecular mass of the expected immunoreactive band. Images shown are representative of three to five experiments. Cav, caveolin.
mBSMCs were then incubated with recombinant adenoviruses expressing either AC2, AC3, or AC6 and fractionated to ascertain the expression and localization of these AC isoforms. Incubating cells with an adenovirus expressing AC6 (AdV-AC6) increased AC5/6 immunoreactivity primarily in buoyant lipid raft fractions (Fig. 2). Incubating cells with AC2 or AC3 adenoviruses also led to detectible AC expression, with AC2 in nonraft fractions and AC3 in lipid raft fractions. Commercially available AC isoform antibodies yield multiple bands from mBSMCs and many other cell types (Liu et al., 2008; Bogard et al., 2011). Genuine immunoreactive bands were confirmed by comparing blots from control and AC-overexpressing cells (Supplemental Fig. 1). Consistent with findings from other cell types, AC3 and AC5/6 localize to lipid rafts, whereas AC2 localized to nonraft membranes (Ostrom et al., 2000, 2002; Ostrom and Insel, 2004; Bogard et al., 2011).
Because cell fractionation studies can suffer from artifactual problems, we also assessed AC isoform localization by using immunofluorescent confocal microscopy. mBSMCs were cultured on coverslips, permeabilized, and fixed, then incubated with antibodies for AC isoforms and caveolin-1. In native mBSMCs we detected staining for both AC3 and AC5/6, and each of these proteins displayed approximately 20% overlap with caveolin-1 staining (Fig. 3; Table 1). We detected very low levels of staining for AC2. Based on immunoblot analyses, a significant amount of nonspecific staining for natively expressed AC isoforms is expected with the antibodies available. This limits the usefulness of staining for native ACs, particularly those expressed at lower levels. To partially overcome this limitation of these antibodies we assessed immunofluorescent microscopy in cells overexpressing each AC. In mBSMCs incubated with AdV-AC2, we detected immunofluorescent staining that had less than 10% overlap with caveolin-1. In contrast, cells incubated with either AdV-AC3 or AdV-AC6 displayed specific staining for AC3 and AC5/6, respectively, that overlapped with caveolin-1 staining by approximately 30%. Thus, staining of intact cells supports the conclusion that mBSMCs express AC3 and AC5/6 and these isoforms localize to lipid rafts. AC2 is not natively expressed in mBSMCs, but when it is exogenously expressed it localizes in nonraft membranes.
Fig. 3.

Colocalization of AC isoforms and caveolin-1 in mBSMCs. Cells were blocked with 1% bovine serum albumin and then incubated with rabbit anti-AC2, -AC3, or -AC6, or mouse anticaveolin-1 antibodies at 37°C for 1 h. After washing, the cells were incubated with Alexa 594-conjugated goat anti-mouse IgG and Alexa 488-conjugated goat-anti-rabbit IgG for 1 h. In some studies, cells were incubated with recombinant adenoviruses expressing AC2, AC3, or AC6 for 24 h. Images shown are representative of four to five experiments. Degree of overlap calculated from the merged images is shown in Table 1.
TABLE 1.
Colocalization of native and overexpressed AC isoforms with caveolin-1 in mBSMCs
| AC2 | AC3 | AC6 | |
|---|---|---|---|
| % | |||
| Control cells | 1.4 ± 0.8 | 21.3 ± 5.1 | 20.2 ± 2.3 |
| Overexpressed | 9.6 ± 1.2 | 31.4 ± 6.8 | 29.7 ± 1.8 |
One key question is whether overexpression of different AC isoforms alters the responses to various Gs-coupled receptors. To directly compare the effects of expressing different AC isoforms, we varied the viral titer for each condition to attain equivalent levels of maximal (10 μM) forskolin-stimulated cAMP production. This is a sensitive measure that corresponds directly with the level of AC expression and circumvents the problem of using antibodies that are varied in their specificity and sensitivity (Gao et al., 1998). Using the viral titers that produced equivalent forskolin-stimulated cAMP levels, we observed that basal cAMP accumulation did not differ between control cells and cells overexpressing AC2 or AC6, but did increase slightly when AC3 was overexpressed (Fig. 4A).
Fig. 4.

cAMP accumulation in mBSMC or HEK-293 cells expressing AC2, AC3, or AC6. mBSMCs (A, B, and D) or HEK-293 cells (C) were incubated with recombinant adenoviruses expressing either lacZ (control), AC2, AC3, or AC6, then cAMP production was measured (see Materials and Methods) A, mBSMCs were stimulated with a maximal concentration of forskolin (Fsk) in the presence of IBMX. *, p < 0.05; **, p > 0.01 by paired t test compared with basal. #, p < 0.05 by paired t test compared with lacZ condition. B, mBSMCs were treated with 0.1 μM Fsk, 0.1 μM isoproterenol, 0.3 μM butaprost, or 0.3 μM beraprost in the presence of IBMX. Data are presented as the percentage increase in cAMP levels when an AC was expressed over the lacZ condition, with the dashed line indicating no increase over lacZ. *, p < 0.05; **, p > 0.01 by paired t test compared with lacZ. C, HEK-293 cells were treated with vehicle, 10 μM Fsk, 1 μM Iso, or 1 μM PGE2. Data are presented as the fold increase in basal cAMP levels (vehicle-treated lacZ cells), with the dashed line indicating no increase over basal. *, p < 0.05; **, p > 0.01 by paired t test compared with lacZ. D, mBSMCs treated with a maximal concentration of Fsk or vehicle without the inclusion of a PDE inhibitor. *, p < 0.05; **, p > 0.01 by paired t test compared with lacZ. #, p < 0.05 by paired t test compared with basal. ns, not significant. All data are presented as mean ± S.E.M. (n = 3–5).
We then analyzed how receptor-specific agonist responses differed in cells overexpressing different AC isoforms. We used cAMP production as a measure of coupling efficiency between a receptor and an overexpressed AC isoform. cAMP accumulation responses were normalized to lacZ (control) cells to determine whether adenoviral expression of a given AC isoform led to increased cAMP signaling by a given agonist. The agonist concentrations used stimulated approximately half-maximal cAMP production in concentration-response curves (performed in HEK-293 cells; data not shown). AC2 expression increased cAMP responses by 0.1 μM forskolin and 0.3 μM butaprost, the EP2 receptor-selective agonist, but did not increase responses to 0.1 μM isoproterenol or 0.3 μM beraprost (Fig. 4B). AC3 overexpression increased responses to forskolin but did not enhance response to any of the receptor agonists we used. AC6 expression led to increased responses to forskolin, isoproterenol, and beraprost but did not alter butaprost responses. Thus, AC2 seems to only couple to EP2R, whereas AC6 couples to only β2AR and IPR in mBSMCs. AC3 does not seem to couple to any of the GPCRs we activated. These data are consistent with the idea that GPCRs couple only to colocalized AC isoforms. However, the fact that AC3 does not couple to lipid raft resident β2AR implies that intramolecular interactions, not just raft or nonraft membrane localization, may be critical.
Similar studies were conducted in HEK-293 cells to determine the generalizability of the observed specific GPCR-AC coupling. HEK-293 cells natively express AC2, AC4, AC5/6, and AC9 isoforms with their predicted lipid raft (AC5/6) and nonraft (AC2, AC4, and AC9) localization (Ostrom and Insel, 2004). Maximal forskolin-stimulated cAMP production was equivalent in cells treated with each of the recombinant adenoviruses, indicating the expression and activity of each AC isoform (Fig. 4C). AC2 overexpression enhanced PGE2-stimulated cAMP production but had no effect on responses to isoproterenol. AC3 expression did not enhance cAMP production to either isoproterenol or PGE2. AC6 overexpression selectively enhanced isoproterenol responses. Thus, the selective coupling of EP2/4 receptors to AC2 seems to be a generalized phenomenon.
Our measures of bulk cellular cAMP levels do not necessarily reflect local, compartmentalized cAMP generation because of the standard practice of including a broad-spectrum PDE inhibitor. We re-examined cAMP production stimulated by forskolin but excluded the PDE inhibitor to determine whether PDE activity might constrain cAMP diffusion in specific compartments. Without IBMX, the time to peak cAMP levels in forskolin-stimulated mBSMCs was 5 min (data not shown). Therefore, we measured cAMP levels 5 min after drug addition and compared this response with mBSMCs expressing each of the AC isoforms. Forskolin (10 μM) stimulated increases in cAMP production 2.3-fold over basal levels in control cells (Fig. 4D). AC3 and AC6 expression increased this forskolin-stimulated response to 3- to 4-fold over basal, but AC2 expression had no effect on the forskolin response. Thus with the cell's full complement of PDE activity we could not observe increased bulk cytosolic cAMP levels emanating from AC2.
We hypothesized that cAMP signaling compartments exist that couple the GPCR-AC signalosomes defined above to distinct cellular functions. One response that can be assayed in single cells is arborization. Arborization is a cell shape change that is stimulated by cAMP signaling in smooth muscle cells (Gros et al., 2006). We measured the rate of arborization in individual cells by analyzing the pixel density change over time (40 min) under a digital microscope. The rate of arborization after drug addition in cells overexpressing either AC2, AC3, or AC6 was then compared with the rate measured in lacZ (control) mBSMCs. Forskolin-stimulated arborization rate was increased by AC3 or AC6 expression but was unaltered in mBSMCs expressing AC2 (Fig. 5A). The inability of AC2 to increase arborization rate parallels its inability to increase bulk cytosolic cAMP levels in the absence of PDE inhibition (Fig. 4). We also examined how receptor-specific agonists regulate arborization of mBSMCs. Isoproterenol-stimulated arborization was accelerated by overexpression of AC6, but not AC2 or AC3. Butaprost, an EP2R agonist, stimulated a slow arborization response in mBSMCs, and none of the AC isoforms that we expressed accelerated this response. Beraprost, an IPR agonist, stimulated arborization, the rate of which was accelerated by AC6 expression but was unaltered by expression of AC2 or AC3. Therefore, arborization in mBSMCs can be mediated by signaling through AC3 and AC6, but not AC2.
Fig. 5.

Arborization of mBSMC after overexpression of either AC2, AC3, or AC6. Cells were incubated with the indicated drugs, and time-lapse photography was used to monitor cell shape changes for 40 min after addition of the indicated drug in the absence (A) or presence of the PDE4-specific inhibitor rolipram (1 μM; B). The pixel density of three to four cells in each image was calculated, and the rate of increase in pixel density over time was used to calculate arborization rate. The percentage of change in arborization rate versus lacZ cells was calculated, and data are presented as the mean ± S.E.M. of three experiments (9–12 observations). *, p < 0.05 by paired t test compared with lacZ. Representative images of the cell shape change are shown at the top.
It has been demonstrated that PDEs are critical enzymes in establishing and maintaining cAMP signaling compartments (Jin et al., 1998; Zaccolo and Pozzan, 2002). We hypothesized that PDE activity might restrict AC2-derived cAMP from diffusing from the site of generation, not allowing it to stimulate arborization. Concentrations of IBMX as low as 2 μM accelerated arborization, making any further drug-induced response difficult to measure. Therefore, we treated cells with a PDE4-specific inhibitor, rolipram (1 μM), and measured arborization responses. In these conditions, forskolin-stimulated arborization rate was accelerated by AC2, AC3, and AC6 expression (Fig. 5B). Isoproterenol-stimulated arborization remained unaffected by AC2 and AC3 in these conditions, indicating that PDE4 activity does not affect the selective GPCR-AC coupling we observed. We could not observe butaprost-mediated arborization responses in the presence of rolipram, perhaps because of the small size of this response being overwhelmed by the PDE inhibitor (data not shown). Nonetheless, these data are consistent with the idea that a PDE, probably PDE4, spatially constrains signaling by cAMP emanating from AC2.
Discussion
One goal of these studies was to determine the AC isoform expression profile of mouse airway smooth muscle to understand how this model might relate to humans. Our data show that mBSMCs express mRNA for AC1, AC3, and AC5 along with low levels of AC4. We could detect expression only of AC3 and AC5/6 protein, although immunological approaches to define ACs can be problematic (Bogard et al., 2011). This AC expression profile differs significantly from human airway smooth muscle cells, which express AC2, AC4, and AC6 (Bogard et al., 2011). AC2 and AC4 expression predominates in human airway smooth muscle, meaning these cells express significant nonraft localized ACs. This contrasts with mouse, which expresses mostly lipid raft isoforms AC3 and AC5. Thus mice may not be a particularly good model of GPCR-AC regulation of airway tone because of these key differences in AC isoform expression.
mBSMCs, as with all other cells we have examined, express AC3 and AC6 in caveolin-rich lipid raft fractions. A significant proportion of β2AR seems to also reside in these domains in the basal state. AC2 expression seemed exclusively in nonraft fractions where we observed expression of EP2R. We have previously used the increased Emax of an agonist at stimulating cAMP production as an index of GPCR-AC coupling (Ostrom et al., 2001; Liu et al., 2008; Bogard et al., 2011). These prior studies indicate that increased AC expression principally alters Emax without any effect on EC50. We found that GPCR-stimulated responses in mBSMCs were affected differently by the expression of each AC isoform. βAR-mediated cAMP production was enhanced only by expression of AC6, not AC2 or AC3. This was somewhat surprising given the lipid raft colocalization between AC3 and β2AR and may reflect the fact that specific signaling complexes are formed within lipid rafts. Prostacyclin (IP) receptors displayed a similar coupling profile, raising the possibility that AC3 does not couple effectively to GPCRs. EP2R, localized in nonraft fractions, coupled only to fellow nonraft resident AC2. Similar studies in HEK-293 cells show that these effects can be generalized to other cell types. Therefore, lipid rafts define microdomains that may compartmentalize cAMP signaling by GPCR, but other factors may help define how a receptor preferentially couples to a particular AC isoform.
Commercially available antibodies for AC isoforms, which we used in the present studies, have significant limitations. In general, these antibodies cross-react with several other proteins, yielding multiple immunoreactive bands (see Supplemental Data). One must be able to separate these other proteins and validate genuine AC bands by expressing the AC of interest and comparing it with immunoreactivity in control cells. As shown in Fig. 3, immunofluorescent microscopy is difficult in cells not overexpressing AC because of high nonspecific binding. Another issue is that certain AC isoform antibodies are more reliable than others. Therefore, one should not rely on these tools for characterizing AC isoform expression in cells or tissues without significant corroborating evidence using other approaches (Erdorf and Seifert, 2011).
Previous studies of vascular smooth muscle cells showed that PGE2 signals primarily through AC3, a result that conflicts with our present findings (Wong et al., 2001). Those investigators found PGE2-mediated cAMP production and growth inhibition were reduced in AC3 knockout mice. A few key experimental differences could explain these different outcomes. First, Wong et al. used only PGE2 in their studies, not the selective EP2R agonist butaprost we used, making it likely that they activated multiple prostanoid receptors in their study. Second, we examined airway smooth muscle and HEK-293 cells, whereas Wong et al. investigated vascular smooth muscle, raising the possibility that these cell types differ in their formation of GPCR-AC complexes. Of course, we also used overexpression of AC3 instead of knockout to probe for receptor coupling. Native AC3 couples to GPCR in certain cells, particularly in the olfactory bulb (Choi et al., 1992).
Pieroni et al. (1995) described increased basal activity of AC2 compared with AC6 when expressed in Sf9 insect cells. We did not observe increased levels of cAMP in mBSMC (mammalian) cells when either AC2 or AC6 was overexpressed (Fig. 4). This difference in AC2 basal activity may be caused by the cellular environment in which it is expressed, with distinct regulatory proteins and molecules in these cell types. For example, AC2 is stimulated by Gβγ signaling, which may be more tightly regulated in mBSMCs than Sf9 cells. Furthermore, the study by Pieroni et al. was performed in isolated membranes with defined Mg2+ concentrations, whereas our study used intact cells and the native cellular milieu. More studies are needed to fully understand the differences in AC isoform activity when expressed in different contexts.
Arborization of smooth muscle cells is a useful response to monitor, because it is mediated by cAMP and can be readily detected in single cells (Gros et al., 2006). We found that arborization rate stimulated by forskolin (which activates all AC isoforms, although not necessarily to the same degree; Erdorf et al., 2011) is enhanced by overexpression of AC3 or AC6 but not AC2. These data imply that cAMP regulation of cytoskeletal reorganization is compartmentalized such that nonraft-generated second messengers can not access the arborization machinery. Overexpression of AC6 enhances arborization in response to βAR or prostacyclin receptor activation, but does not affect responses to EP2R. Overexpression of AC3 did not alter responses to any of the GPCR agonists tested, despite enhancing forskolin-mediated arborization, reflecting its inability to couple to receptors. AC2 expression had no effect on arborization rate in any of our conditions.
With the hypothesis that PDE activity limits diffusion of cAMP from the site of generation, we repeated arborization studies in cells treated with a specific PDE4 inhibitor. In these conditions, AC2 accelerated forskolin-mediated arborization but had no effect on βAR-mediated arborization. These findings are consistent with the idea that PDE4 limits access of AC2-derived cAMP to the arborization machinery, but has no role in determining the specific coupling between GPCRs and a given AC isoform. This hypothesis is supported by the fact that we could not detect increased cAMP levels in the bulk cytosol of cells when AC2 was overexpressed and no PDE inhibitor was used. Further support comes from immunoblot analysis of all PDE4 isoforms showing the bulk of PDE4 in mBSMCs resides in nonraft fractions (Fig. 2). Thus, AC2 seems to exist in a compartment in which PDE expression and activity severely limits the diffusion and action of cAMP. A schematic diagram of our hypothesized arrangement of signaling in mBSMCs is shown in Fig. 6.
Fig. 6.
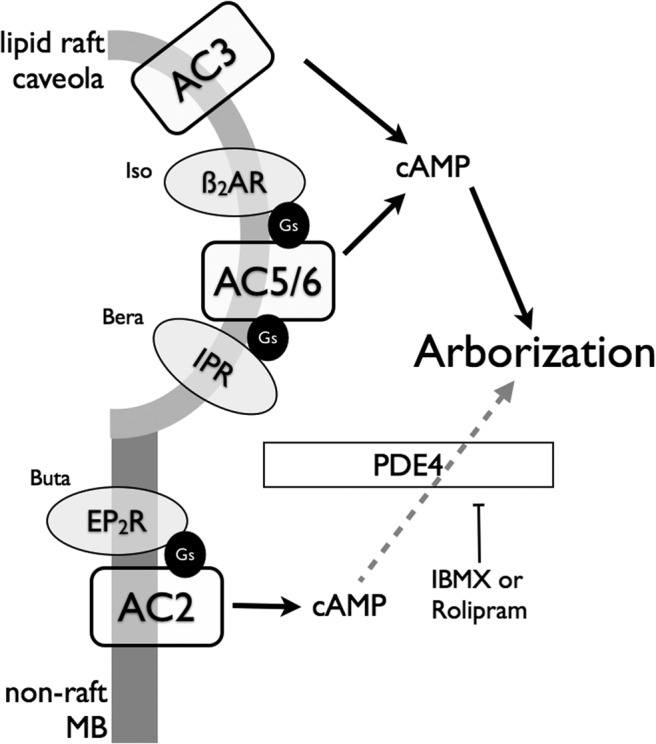
Schematic diagram of GPCR/AC localization and signaling in mBSMCs. β2AR and prostacyclin receptors (IPR) primarily signal via AC6 localized in lipid raft microdomains. AC3, when overexpressed, localizes in these same domains but does not seem to couple to any GPCR. Signals emanating from this domain mediate arborization of the cells. In nonraft membranes, prostanoid EP2 receptors localize with AC2, but cAMP signals from these locales do not seem to regulate the arborization response. PDE4 is expressed in this location and its activity seems responsible for limiting cAMP in this compartment, because treatment of cells with rolipram uncovers an EP2R-AC2 stimulation of arborization. Buta, butaprost; Bera, beraprost; MB, membrane.
Previous work in vascular smooth muscle supports the notion that different AC isoforms can be coupled to specific cellular responses. Gros et al. (2006) showed that AC1, but not AC6, could regulate extracellular signal-regulated kinase 1/2 activity and cell proliferation, whereas only AC6 could regulate vasodilator-stimulated phosphoprotein phosphorylation. Thus AC isoforms seem to be central players in organized signaling complexes, which include AKAPs, PDEs, and other proteins, that can specifically regulate a subset of cellular responses (Efendiev and Dessauer, 2011; Ostrom et al., 2012). Specific AKAPs can bring PDEs to the sites of cAMP synthesis via distinct interactions with isoforms of AC, and this localized PKA activity can regulate PDE and AC activity and/or GPCR function in near membrane compartments (Rich et al., 2007; Dessauer, 2009). Yotiao is one such AKAP that is known to bind both PDE4 and AC2 (Piggott et al., 2008; Terrenoire et al., 2009). More studies are needed to assess the role of ACs, and specific AKAPs and PDEs, in the compartmentalized responses we observed. Because of long AC protein half-lives, we have not successfully knocked down AC isoform expression in mBSMCs. This type of approach is needed to determine which ACs mediate arborization, or other cellular responses, in native smooth muscle cells.
Given that the AC isoform expression profile largely determines the compartments in which cAMP is generated, and mouse airway smooth muscle AC expression profile differs significantly from human, we suggest that mouse models of airway function regulated by GPCR-AC pathways may not accurately reflect responses in humans. Nonetheless, it is clear that airway smooth muscle signaling is highly compartmentalized at proximal steps (GPCR and AC) with lipid rafts/caveolae acting as sites for βAR-AC5/6 signalosomes and nonraft membranes serving as sites for EP2R-AC2 signalosomes. cAMP regulation of cytoskeletal reorganization, a more distal event, is also compartmentalized, with PDE, particularly PDE4, activity required for maintaining the observed compartmentation. Therapies that take advantage of these distinct signaling complexes to more specifically alter bronchodilation would represent exciting new treatment modalities.
Supplementary Material
Acknowledgments
We thank Dr. Ross Feldman (Western University, Ontario, Canada) for critical review of the manuscript and generous gifts of AC2 and AC3 adenoviruses; Dr. Jonathan Jaggar (Department of Physiology, University of Tennessee Health Science Center) for assistance in isolating mouse bronchial smooth muscle cells; and Dr. Muthusamy Thangavel, Dr. Congfeng Xu, Joseph Kaminsky, Hill Stoecklein, and Patti Mahautmr for technical assistance.
This work was supported by the National Institutes of Health National Heart, Lung, and Blood Institute [Grant HL079166].
Article, publication date, and citation information can be found at http://jpet.aspetjournals.org.
 The online version of this article (available at http://jpet.aspetjournals.org) contains supplemental material.
- GPCR
- G protein-coupled receptor
- AC
- adenylyl cyclase
- βAR
- β-adrenergic receptor
- mBSMC
- mouse bronchial smooth muscle cell
- HEK
- human embryonic kidney
- PGE2
- prostaglandin E2
- EP
- E prostanoid
- EP2R
- prostacyclin EP2 receptor
- RT
- reverse transcriptase
- PCR
- polymerase chain reaction
- PKA
- protein kinase A
- PDE
- phosphodiesterase
- AKAP
- A kinase anchoring protein
- IBMX
- 3-isobutyl-1-methylxanthine
- PBS
- phosphate-buffered saline
- MBS
- 25 mM 4-morpholineethanesulfonic acid and 150 mM NaCl, pH 6.5
- AdV
- adenovirus
- Fsk
- forskolin
- Iso
- isoproterenol
- Cav
- caveolin
- IPR
- I prostanoid receptor.
Authorship Contributions
Participated in research design: Bogard, Adris, and Ostrom.
Conducted experiments: Bogard, Adris, and Ostrom.
Performed data analysis: Bogard and Ostrom.
Wrote or contributed to the writing of the manuscript: Bogard and Ostrom.
References
- Abrahamsen H, Baillie G, Ngai J, Vang T, Nika K, Ruppelt A, Mustelin T, Zaccolo M, Houslay M, Taskén K. (2004) TCR- and CD28-mediated recruitment of phosphodiesterase 4 to lipid rafts potentiates TCR signaling. J Immunol 173:4847–4858 [DOI] [PubMed] [Google Scholar]
- Anderson RG. (1998) The caveolae membrane system.Annu Rev Biochem 67:199–225 [DOI] [PubMed] [Google Scholar]
- Billington CK, Hall IP, Mundell SJ, Parent JL, Panettieri RA, Jr, Benovic JL, Penn RB. (1999) Inflammatory and contractile agents sensitize specific adenylyl cyclase isoforms in human airway smooth muscle. Am J Respir Cell Mol Biol 21:597–606 [DOI] [PubMed] [Google Scholar]
- Billington CK, Penn RB. (2003) Signaling and regulation of G protein-coupled receptors in airway smooth muscle. Respir Res 4:2. [PMC free article] [PubMed] [Google Scholar]
- Bogard AS, Xu C, Ostrom RS. (2011) Human bronchial smooth muscle cells express adenylyl cyclase isoforms 2, 4, and 6 in distinct membrane microdomains. J Pharmacol Exp Ther 337:209–217 [DOI] [PMC free article] [PubMed] [Google Scholar]
- Choi EJ, Xia Z, Storm DR. (1992) Stimulation of the type III olfactory adenylyl cyclase by calcium and calmodulin. Biochemistry 31:6492–6498 [DOI] [PubMed] [Google Scholar]
- Davare MA, Avdonin V, Hall DD, Peden EM, Burette A, Weinberg RJ, Horne MC, Hoshi T, Hell JW. (2001) A β2 adrenergic receptor signaling complex assembled with the Ca2+ channel Cav1.2. Science 293:98–101 [DOI] [PubMed] [Google Scholar]
- Dessauer CW. (2009) Adenylyl cyclase–a-kinase anchoring protein complexes: the next dimension in cAMP signaling. Mol Pharmacol 76:935–941 [DOI] [PMC free article] [PubMed] [Google Scholar]
- Efendiev R, Dessauer CW. (2011) A kinase-anchoring proteins and adenylyl cyclase in cardiovascular physiology and pathology. J Cardiovasc Pharmacol 58:339–344 [DOI] [PMC free article] [PubMed] [Google Scholar]
- Erdorf M, Mou TC, Seifert R. (2011) Impact of divalent metal ions on regulation of adenylyl cyclase isoforms by forskolin analogs. Biochem Pharmacol 82:1673–1681 [DOI] [PMC free article] [PubMed] [Google Scholar]
- Erdorf M, Seifert R. (2011) Pharmacological characterization of adenylyl cyclase isoforms in rabbit kidney membranes. Naunyn-Schmiedebergs Arch Pharmacol 383:357–372 [DOI] [PubMed] [Google Scholar]
- Galbiati F, Razani B, Lisanti MP. (2001) Emerging themes in lipid rafts and caveolae. Cell 106:403–411 [DOI] [PubMed] [Google Scholar]
- Gao M, Ping P, Post S, Insel PA, Tang R, Hammond HK. (1998) Increased expression of adenylylcyclase type VI proportionately increases β-adrenergic receptor-stimulated production of cAMP in neonatal rat cardiac myocytes. Proc Natl Acad Sci U S A 95:1038–1043 [DOI] [PMC free article] [PubMed] [Google Scholar]
- Gros R, Ding Q, Chorazyczewski J, Pickering JG, Limbird LE, Feldman RD. (2006) Adenylyl cyclase isoform-selective regulation of vascular smooth muscle proliferation and cytoskeletal reorganization. Circ Res 99:845–852 [DOI] [PubMed] [Google Scholar]
- Hanoune J, Defer N. (2001) Regulation and role of adenylyl cyclase isoforms. Annu Rev Pharmacol Toxicol 41:145–174 [DOI] [PubMed] [Google Scholar]
- Hill J, Howlett A, Klein C. (2000) Nitric oxide selectively inhibits adenylyl cyclase isoforms 5 and 6. Cell Signal 12:233–237 [DOI] [PubMed] [Google Scholar]
- Hooper NM. (1999) Detergent-insoluble glycosphingolipid/cholesterol-rich membrane domains, lipid rafts and caveolae (review). Mol Membr Biol 16:145–156 [DOI] [PubMed] [Google Scholar]
- Houslay MD, Adams DR. (2003) PDE4 cAMP phosphodiesterases: modular enzymes that orchestrate signalling cross-talk, desensitization and compartmentalization. Biochem J 370:1–18 [DOI] [PMC free article] [PubMed] [Google Scholar]
- Hurley JH. (1999) Structure, mechanism, and regulation of mammalian adenylyl cyclase. J Biol Chem 274:7599–7602 [DOI] [PubMed] [Google Scholar]
- Jin SL, Bushnik T, Lan L, Conti M. (1998) Subcellular localization of rolipram-sensitive, cAMP-specific phosphodiesterases. Differential targeting and activation of the splicing variants derived from the PDE4D gene. J Biol Chem 273:19672–19678 [DOI] [PubMed] [Google Scholar]
- Kume H, Hall IP, Washabau RJ, Takagi K, Kotlikoff MI. (1994) β-Adrenergic agonists regulate KCa channels in airway smooth muscle by cAMP-dependent and -independent mechanisms. J Clin Invest 93:371–379 [DOI] [PMC free article] [PubMed] [Google Scholar]
- Liu X, Thangavel M, Sun SQ, Kaminsky J, Mahautmr P, Stitham J, Hwa J, Ostrom RS. (2008) Adenylyl cyclase type 6 overexpression selectively enhances β-adrenergic and prostacyclin receptor-mediated inhibition of cardiac fibroblast function because of colocalization in lipid rafts. Naunyn Schmiedebergs Arch Pharmacol 377:359–369 [DOI] [PMC free article] [PubMed] [Google Scholar]
- McVey M, Hill J, Howlett A, Klein C. (1999) Adenylyl cyclase, a coincidence detector for nitric oxide. J Biol Chem 274:18887–18892 [DOI] [PubMed] [Google Scholar]
- Neubig RR. (1994) Membrane organization in G-protein mechanisms. FASEB J 8:939–946 [DOI] [PubMed] [Google Scholar]
- Ostrom RS. (2002) New determinants of receptor-effector coupling: trafficking and compartmentation in membrane microdomains. Mol Pharmacol 61:473–476 [DOI] [PubMed] [Google Scholar]
- Ostrom RS, Bogard AS, Gros R, Feldman RD. (2012) Choreographing the adenylyl cyclase signalosome: sorting out the partners and the steps. Naunyn-Schmiedebergs Arch Pharmacol 385:5–12 [DOI] [PubMed] [Google Scholar]
- Ostrom RS, Ehlert FJ. (1998) M2 muscarinic receptors inhibit forskolin- but not isoproterenol-mediated relaxation in bovine tracheal smooth muscle. J Pharmacol Exp Ther 286:234–242 [PubMed] [Google Scholar]
- Ostrom RS, Gregorian C, Drenan RM, Xiang Y, Regan JW, Insel PA. (2001) Receptor number and caveolar co-localization determine receptor coupling efficiency to adenylyl cyclase. J Biol Chem 276:42063–42069 [DOI] [PubMed] [Google Scholar]
- Ostrom RS, Insel PA. (2004) The evolving role of lipid rafts and caveolae in G protein-coupled receptor signaling: implications for molecular pharmacology. Br J Pharmacol 143:235–245 [DOI] [PMC free article] [PubMed] [Google Scholar]
- Ostrom RS, Liu X, Head BP, Gregorian C, Seasholtz TM, Insel PA. (2002) Localization of adenylyl cyclase isoforms and G protein-coupled receptors in vascular smooth muscle cells: expression in caveolin-rich and noncaveolin domains. Mol Pharmacol 62:983–992 [DOI] [PubMed] [Google Scholar]
- Ostrom RS, Violin JD, Coleman S, Insel PA. (2000) Selective enhancement of β-adrenergic receptor signaling by overexpression of adenylyl cyclase type 6: colocalization of receptor and adenylyl cyclase in caveolae of cardiac myocytes. Mol Pharmacol 57:1075–1079 [PubMed] [Google Scholar]
- Pieroni JP, Harry A, Chen J, Jacobowitz O, Magnusson RP, Iyengar R. (1995) Distinct characteristics of the basal activities of adenylyl cyclases 2 and 6. J Biol Chem 270:21368–21373 [DOI] [PubMed] [Google Scholar]
- Piggott LA, Bauman AL, Scott JD, Dessauer CW. (2008) The A-kinase anchoring protein Yotiao binds and regulates adenylyl cyclase in brain. Proc Natl Acad Sci U S A 105:13835–13840 [DOI] [PMC free article] [PubMed] [Google Scholar]
- Rich TC, Xin W, Mehats C, Hassell KA, Piggott LA, Le X, Karpen JW, Conti M. (2007) Cellular mechanisms underlying prostaglandin-induced transient cAMP signals near the plasma membrane of HEK-293 cells. Am J Physiol Cell Physiol 292:C319–C331 [DOI] [PMC free article] [PubMed] [Google Scholar]
- Sadana R, Dessauer CW. (2009) Physiological roles for G protein-regulated adenylyl cyclase isoforms: insights from knockout and overexpression studies. Neurosignals 17:5–22 [DOI] [PMC free article] [PubMed] [Google Scholar]
- Salomon Y, Londos C, Rodbell M. (1974) A highly sensitive adenylate cyclase assay. Anal Biochem 58:541–548 [DOI] [PubMed] [Google Scholar]
- Scott MG, Swan C, Jobson TM, Rees S, Hall IP. (1999) Effects of a range of β2 adrenoceptor agonists on changes in intracellular cyclic AMP and on cyclic AMP driven gene expression in cultured human airway smooth muscle cells. Br J Pharmacol 128:721–729 [DOI] [PMC free article] [PubMed] [Google Scholar]
- Shaul PW, Anderson RG. (1998) Role of plasmalemmal caveolae in signal transduction. Am J Physiol Lung Cell Mol Physiol 275:L843–L851 [DOI] [PubMed] [Google Scholar]
- Simons K, Toomre D. (2000) Lipid rafts and signal transduction. Nat Rev Mol Cell Biol 1:31–39 [DOI] [PubMed] [Google Scholar]
- Spicuzza L, Belvisi MG, Birrell MA, Barnes PJ, Hele DJ, Giembycz MA. (2001) Evidence that the anti-spasmogenic effect of the β-adrenoceptor agonist, isoprenaline, on guinea-pig trachealis is not mediated by cyclic AMP-dependent protein kinase. Br J Pharmacol 133:1201–1212 [DOI] [PMC free article] [PubMed] [Google Scholar]
- Steinberg SF, Brunton LL. (2001) Compartmentation of G protein-coupled signaling pathways in cardiac myocytes. Annu Rev Pharmacol Toxicol 41:751–773 [DOI] [PubMed] [Google Scholar]
- Terrenoire C, Houslay MD, Baillie GS, Kass RS. (2009) The cardiac IKs potassium channel macromolecular complex includes the phosphodiesterase PDE4D3. J Biol Chem 284:9140–9146 [DOI] [PMC free article] [PubMed] [Google Scholar]
- Torphy TJ. (1994) β-Adrenoceptors, cAMP and airway smooth muscle relaxation: challenges to the dogma. Trends Pharmacol Sci 15:370–374 [DOI] [PubMed] [Google Scholar]
- Torphy TJ, Freese WB, Rinard GA, Brunton LL, Mayer SE. (1982) Cyclic nucleotide-dependent protein kinases in airway smooth muscle. J Biol Chem 257:11609–11616 [PubMed] [Google Scholar]
- Wei J, Wayman G, Storm DR. (1996) Phosphorylation and inhibition of type III adenylyl cyclase by calmodulin-dependent protein kinase II in vivo. J Biol Chem 271:24231–24235 [DOI] [PubMed] [Google Scholar]
- Wong ST, Baker LP, Trinh K, Hetman M, Suzuki LA, Storm DR, Bornfeldt KE. (2001) Adenylyl cyclase 3 mediates prostaglandin E2-induced growth inhibition in arterial smooth muscle cells. J Biol Chem 276:34206–34212 [DOI] [PubMed] [Google Scholar]
- Zaccolo M, Pozzan T. (2002) Discrete microdomains with high concentration of cAMP in stimulated rat neonatal cardiac myocytes. Science 295:1711–1715 [DOI] [PubMed] [Google Scholar]
Associated Data
This section collects any data citations, data availability statements, or supplementary materials included in this article.