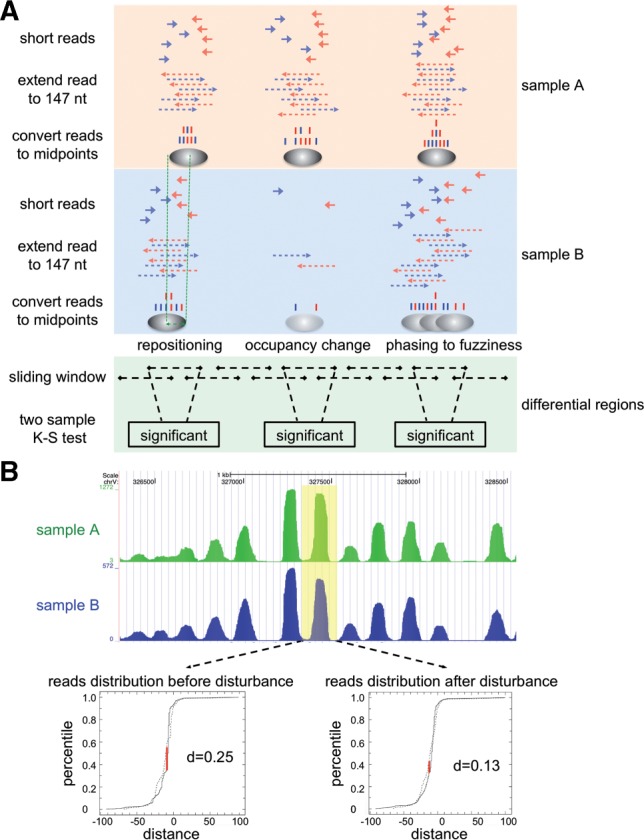
Fig. 1.

Approach for identifying RDNPs. (A) Schematic of DiNuP. (B) An example of reducing experimental bias by giving coordinate disturbances. The read distribution is obtained from reads within the sliding window (yellow). D is the largest distance between the cumulative distributions
