

Abstract
Objective
To decipher the immunological mechanisms of plaque maturation and rupture, it is necessary to analyze the phenotypes and distribution of individual lymphocytes which migrate to the plaques as well as their activation at different stages of plaque formation.
Methods and Results
We developed a protocol to isolate plaque-residing immune cells and analyze their status using polychromatic flow cytometry. We found that the composition and phenotype of T lymphocytes in the plaques differs from that in blood. CD4 and, in particular, CD8+ T cells in plaques are highly activated; the fraction of CD8 T cells co-expressing CD25 and HLA-DR in plaques was 10 times larger than in blood.
Conclusions
The first flow-cytoanalysis of individual T cells in atherosclerotic plaques indicates that plaques represent a separate immunological compartment from blood with lymphocytes characterized by a high level of T cells activation, which is compatible with the presence of antigen(s) that trigger infiltration activation of these cells. The ability to isolate and characterize these cells may lead to the identification of such antigens.
In spite of a large volume of clinical and experimental data on the formation, maturation, and rupture of atherosclerotic plaques, the mechanisms of these phenomena are not yet fully understood. Systemic inflammation seems to play an important role in the development of plaques 1, 2. Inflammation is a complex phenomenon that includes migration of reactive cells, in particular lymphocytes and monocytes, and their complex activation followed by the release of various cytokines. Histochemical analysis 3 and PCR “immunoscopy”4 of the DNA extracted from atherosclerotic plaques have revealed recruitment to and activation of T-cell in unstable plaques, thus significantly advancing our knowledge of the factors associated with plaque instability. However, PCR can report only on the bulk characteristics of lymphocytes, whereas immunohistochemistry can only monitor a few cellular characteristics.
To decipher the immunological mechanisms of plaque maturation and rupture, it is necessary to analyze the phenotypes and distributions of the lymphocytes in individual plaques. The only current technology that can accomplish these tasks is polychromatic flow cytometry, which earlier modernized other fields of biology and medicine. However, such an analysis was never performed on cells residing within human atherosclerotic plaques.
Here, we performed such an analysis. We developed an original, cell isolation, protocol that preserves cell surface markers and uses polychromatic flow cytometry to analyze plaque lymphocytes.
METHODS
1. Patients
A total of 27 patients, 20 males and 7 females ranging in age from 26 to 80 years (median 66 IQR [57 –71], mean ± sem: 64.14 ± 2.4), were enrolled in this study. Seventeen human carotid artery and five aorta plaques were collected from patients undergoing endarterectomy and aorto-femoral bypass grafting in 5 surgical centers in Moscow. Twenty one patients had previous ischemic history, including ischemic heart disease, cerebrovascular disease and peripheral artery disease, while six had asymptomatic atherosclerosis. The degree of carotid artery stenosis varied from 70% to 90% (median 80.0% IQR [72.5–90], mean ± sem: 80.7±1.74, n=22). Blood from 7 healthy controls from the same geographical location was used to compare to that of patients. Baseline clinical characteristics are listed in Table 1.
Table 1.
Overall patient characteristics
| All patients (n=27) | Controls (n=7) | Significance | |
|---|---|---|---|
| Plaque source, n carotid/aorta | 22/5 | - | N/S* |
| Age, mean ±SD, years | 64±12 | 41±11 | < 0.0001 |
| Male gender, n (%) | 20 (74) | 3 (43) | N/S (0.1276) MW** |
| Degree of carotid artery stenosis, mean ±SD, % | 80.2±8.3 | - | - |
|
| |||
| Risk factors, n (%)
| |||
| Hypercholesterolemia | 3 (11) | 1 (14) | N/S (0.8487) MW |
| Diabetes mellitus | 16 (59) | 1 (14) | 0.039 MW |
| Hypertension | 23 (85) | 1 (14) | 0.0003 MW |
| Smoking | 10 (37) | 1 (14) | 0.2699 MW |
| Previous ischemic history, n (%) | 21 (78) | 0 (0) | 0.0002 MW |
| Coronary artery disease | 13 (48) | 0 (0) | 0.0228 MW |
| Cerebrovascular disease | 8 (30) | 0 (0) | N/S (0.1111 MW) |
| Peripheral artery disease | 14 (52) | 0 (0) | 0.0154 MW |
|
| |||
| Medications, n (%)
| |||
| Aspirin | 14 (52) | 0 (0) | 0.0154 MW |
| Clopidogrel | 3 (11) | 0 (0) | N/S (0.3862) MW |
| Statins | 13 (48) | 1 (14) | 0.1157 MW |
N/S = non-significant
MW=Mann-Whitney test used
This study was approved by the local Ethics Committee, and all participants gave their written consent. From each patient except one patient, peripheral blood was drawn at the time of surgery and processed in parallel with atherosclerotic plaques as described below.
2. Plaque analysis
After surgery, the atherosclerotic plaques were collected in RPMI 1640 and kept at room temperature until processing, usually within 2 hours of surgery. The atherosclerotic plaques were dissected into several pieces, one of which was fixed in 2% formalin. The remainder of tissue was dissected into multiple blocks depending on the size of the sample and was digested by an enzymatic mixture optimized as described in the Results..
3. Preparation of PBMCs
Patients’ peripheral blood, drawn with 3.8% Na-citrate, was centrifuged 10 minutes at 800 g, the plasma was decanted, and the red blood cells were lysed with a lysis solution (Biolegend, San Diego, CA), centrifuged at 400 g for 5 minutes, and the cells were resuspended in PBS.
4. Flow cytometry
We determined the phenotypes of the mononuclear cells by flow-cytometric analysis on a FACS Canto II (BD Biosciences, San Jose, CA) equipped with 588-nm, 633-nm, and 405-nm LASER lines. For live/dead discrimination, cells were stained by adding 2 μl of a 1-mg/ml solution of the amine reactive dye Pacific Orange™ (succinimidyl-ester-triethylammonium salt; Invitrogen, Carlsbad, CA) in DMSO to 1 ml of cell suspension diluted in PBS. The stainings were performed on 100 μl of cell suspension and the totality of the staining tube was acquired and analyzed. This allows the estimation of the number of cells contained within these 100 microliters. In addition, for 6 plaques we estimated the number of cells per mg of tissue. Blocks of tissues from which the cells were to be isolated were weighted and then the numbers of extracted cells were evaluated on the flow cytometer using the whole stained tube.
The live/dead staining was allowed to proceed for 15 minutes at room temperature; then, the cells were diluted in a larger volume of PBS supplemented with 2% normal mouse serum and after centrifugation, re-suspended in 1 mL of staining buffer.
Fifty μL of cell suspension were stained with the following mixtures of monoclonal antibodies diluted at their optimal titer: (i) CD45 Cy7-PE, CD3 Cy5.5-PerCp, CD4 eFluor780-APC, CD28 PE, CD27 FITC, CD197 APC, and CD45RA eFluor 450 for the classification of memory and naïve T-cell subsets; (ii) CD45 Cy7-PE, CD3 Cy5.5-PerCp, CD4 eFluor780-APC, CD25 PE, CD146 FITC, CD38 APC, and HLA-DR Pacific blue for the determination of T-cell activation, and finally (iii) CD45 Cy7-PE, CD3 Cy5.5-PerCp, CD4 eFluor780-APC, CD19 PE, CD16 FITC, CD56 APC, and CD8 eFluor450 for the analysis of T cells, B cells and NK cells. Not every sample was stained with all the above-listed markers.
In addition, cells were stained for, INF-γ, Il-2, IL-12, IL-22, Il-17A, T-Bet and Foxp3. In the following antibody combinations: (i) CD45 Cy7-PE, CD3 Cy5.5-PerCp, CD4 eFluor780-APC, CD25 PE, CD27 FITC, Foxp3 APC, and CD8 eFluor450 for detecting Tregs, (ii) IFN-γ Cy7-PE, IL-22 Alexa710-PE Cy5.5-PerCp, CD45 eFluor780-APC, CD161 PE, CD3 FITC, IL-17A APC, and CD8 eFluor450 for detecting Th17 Cells and (iii) IFN-γ Cy7-PE, CD3 Cy5.5- PerCp, CD45 eFluor780-APC, T-Bet PE, IL-2 FITC, IL-12 APC, and CD8 eFluor450 for detecting Th1 cells.. Cells were treated for 4 hours with Brefeldin A at 10 μg/ml (Sigma-Aldrich, St Louis, MO) in the presence or absence of the cellular activators PMA (50ng/ml) and Ionomycin (1μM) (Sigma). Stainings were performed using the fixation and permeabilization buffer provided with the FOX-p3 antibody (e-Bioscience, San Diego, CA) according to the manufacturer’s instructions. Briefly, after cell surface staining, the cells were washed twice in staining buffer, resuspended in 1ml of Foxp3 Fixation/Permeablization buffer for 30 minutes at RT, washed twice with flow cytometry staining buffer, and the pellet re-suspended in 100μl of permeabilization buffer. 50 μl of intracellular antibody mix, diluted in staining buffer supplemented with 15% normal mouse serum and 5% normal rat serum, were added to each tube for 30 minutes at room temperature. The tubes were washed twice and fixed as described for cell surface staining.
We set up single-color compensation tubes for each staining in each experiment using Invitrogen’s AbC beads or Becton Dickinson’s Comp beads. After staining, cells and beads were washed and fixed in 1% formaldehyde in PBS. The antibodies to CD14, CD146, CD16, CD19, CD197, CD3, CD38, CD45, CD56, and HLA-DR were purchased from Biolegend. CD16, CD25, CD27, CD28, CD3 cy5.5-PerCp, CD4, CD8, CD25, CD4, CD45RA, and CD8 were purchased from eBiosciences (San Diego, CA); CD56 APC was purchased from Becton Dickinson. To position the analysis gates properly and to verify the specificity of the staining, for each staining, we performed the corresponding fluorescence minus one control (FMOCs) set 5, 6. These controls, in which one labeled antibody at a time is omitted systematically from the stain mix, allows the proper positioning of gates that takes into account the complex spectral overlap observed in polychromatic cytometry. Also, for the intracellular staining for cytokines and nuclear transcriptional factor we performed isotype control staining in addition to FMOC.
Data acquisition was performed within 24 hours of staining and acquired by means of Diva 6.1.3. We analyzed data using FlowJo version 9.3.3 (Tree Star software, Ashland, OR).
5. Optimization of enzymatic digestion mixture
To determine the optimal enzyme cocktail and concentration that will least affect the expression of cell surface markers, we digested fresh human PBMCs isolated from normal volunteers’ PBMCs for 1 hour at 37°C with collagenase XIs (Sigma), collagenase IV (Invitrogen), or Liberase DL (Roche diagnostics, Indianapolis, IN) in the presence of DNAse I at 0.2mg/ml (Roche diagnostics). The cells were then harvested, washed, and stained with monoclonal antibodies according to the protocol outlined above. The levels of expression of the cell surface markers CD3, CD4, CD16, CD45, CD45RA, CCR7 CD28, CD27, HLA-DR, and CD38 in mock-digested PBMCs and control untreated PBMCs were compared.
All the blocks obtained from each plaque, at the exception of a few blocks frozen for future molecular analysis or for verifying the efficiency of digestion, were randomly distributed among 1.5 ml microcentrifuge digestion tubes (10 blocks per tube). Typically, for each plaque samples between 2 to 10 tubes were collected. Plaque fragments were digested for 1 hour at 37°C in a final volume of 0.5 ml of RPMI/10 blocks supplemented with the proper enzyme dilution (see Results) and 0.2-mg/ml DNAse I. The released cells and tissue ghosts was strained through a 100-μm Celltrics filter (Partec, Münster, Germany), centrifuged at 400 g for 8 minutes, re-suspended in 2 ml of PBS, and processed for flow-cytometric analysis as described above. At the end of the digestion all cells from the tubes were pooled and processed for staining. To evaluate the efficiency of cell liberation from the plaques using the protocol described above we cryosectioned several plaque tissues before and after lymphocytes liberation. We found virtually no lymphocytes in the digested samples (less than 4% of what was present before the digestion). Thus, our protocol liberates the vast majority of lymphocytes and their subsets.
6. Statistical analysis
All the data obtained in the present work were normally distributed as assessed by the D’Agostino and Pearson omnibus normality test. The variance was evaluated for homoscedasticity using the Levene, Bartlett and F tests.
We tested the null hypothesis that there is no difference between the mean values for plaque and blood of each dependant variable, the % of cells with a given antigen expression. t-tests were used to compare variables between plaque and blood and between male and female patients. If the data distribution was not homoscedastic as measured by F-test, the Welch’s correction for the t-test was used. When comparing data across multiple groups, i.e. Patient Blood, Patient plaque and normal blood, an ANOVA was performed using the Tukey-Kramer’s Honestly Significant Difference correction for multiple comparisons. When the data were not normally distributed, we used the Wilcoxon rank score test (Mann-Whitney) for two groups comparisons and the Kuskall-Wallis Rank Sum test for comparison across several groups. Statistical analysis was performed using Prism 5.0d and (GraphPad Software, La Jolla, CA, USA) and JMP 9.0 (SAS Institute Inc., Cary, NC, USA). Statistical significance was defined at an alpha level of 0.05.
RESULTS
1. Development of a digestion protocol for atherosclerotic plaques
To separate individual cells from the plaques, we first used various collagenases that were first tested on PBMCs for preserving the cell surface markers CD3, CD4, CD16, CD45, CD45RA, CD197, CD28, CD27, HLA-DR, and CD38. We treated PBMCs with collagenase XIs diluted at 5, 10, and 2.5 mg/ml. The lowest enzyme concentration resulted in the reduction of CD8 expression by 90% compared to non-treated cells. Also, the expression of CD4, CD3, CD27, and CD28 was reduced by 40%, 12%, 50% and 42%, respectively. Because of these strong effects the ability of this enzyme to liberate cells was not studied further.
Second, we treated PBMCs with collagenase IV at 10, 5, and 2.5 mg/ml and noticed that, at the highest concentrations the expression of CD4 and CD8, were respectively reduced by 29% and 23%. At 1.25 mg/ml collagenase IV the surface markers expression was decreased by 4.9±3.4% compared to that on untreated PBMC.
Third, we treated cells with Liberase DL. At the concentrations of 62.5 and 31.5 μg/ml, CD4 was reduced by ~70%, while at 15 μg/ml, the expression of this marker was only reduced by 20±7 %. The expression levels of CD3, CD8, CD16, CD45, and HLA-DR were affected marginally.
To liberate cells from atherosclerotic plaques we applied enzymes at concentrations that did not grossly decrease expression of cell surface molecules in PBMCs. Freshly excised plaques were digested with collagenase IV (2.5 and 1.25 mg/ml) and Liberase DL (25 and 12.5 μg/ml) in the presence of 0.2-mg/ml DNAse I for 1 hour at 37°C. The cells were then stained with monoclonal antibodies for CD45, CD3, CD4, and CD8. Collagenase IV at 1.25 mg/ml liberated more lymphocytes than did digestion with 2.5 mg/ml as evaluated by the relative amount of lymphocytes in the gate defined on side scatter vs. CD45 expression.
On the basis of the relative lymphocyte (CD45+) yield, we chose treatment with collagenase IV for 1 hour at 37°C as an efficient method to liberate lymphocytes from atherosclerotic plaques while largely preserving cell surface markers. We used this protocol in all our subsequent experiments described below. However, the concentration of the enzyme has to be adjusted for each enzyme batch and in our varied experiments between 1 and 1.25 mg/ml.
2. Comparison of the main lymphocyte subsets isolated from plaques and blood
We stained cells for a set of markers whose combination permits the classification of lymphocytes into CD4 T cells, CD8 T cells, B cells, and NK cells using the gating strategy depicted in Fig. 1. Lymphocytes were defined as the lowest SSC population with high CD45 expression, monocytes as the cells having an intermediate SSC with high CD45 expression, and granulocytes as cells with a very high SSC and a lower expression of CD45. T cells were identified from their expression of CD3, CD4, and CD8 and divided into naïve and memory phenotypes as defined above.
Figure 1. Gating strategy for lymphocyte analysis.
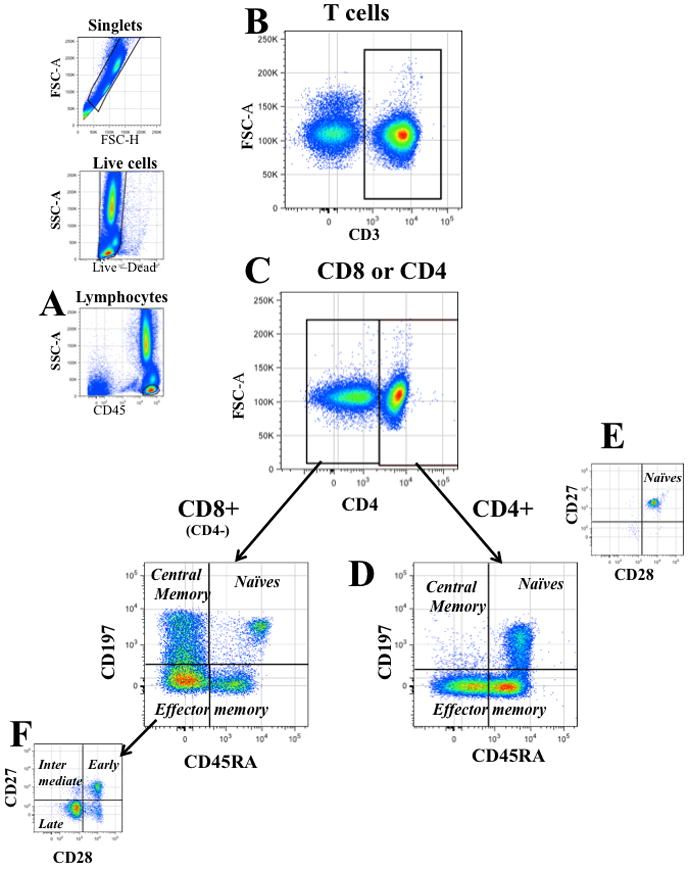
Single cells were identified on a forward scatter-area (FSC-A) vs. their FSC height (FSC-H) bivariate plot, dead cells were excluded by their positive staining with an amino-reactive “live- dead” die. Lymphocytes were defined as low SSC cells brightly stained with CD45 (a). Among lymphocytes, T cells were identified by their expression of CD3 (b) and were divided into CD4+ and CD8+ (CD4−) in a bivariate plot of CD3 vs CD4 (c). Based on their expression of CD197 and CD45RA (d), each T-cell fraction (CD4+ and CD4−) was further classified into naïve cells (CD45RA+CD197+), central memory cells (Tcm: CD197+CD45RA−), and effector memory cells (Tem: CD45RA± CD197−). Each subpopulation was then finally analyzed for the expression of CD28 and CD27 to refine the phenotype of naïve cells (CD45RA+CD197+CD27+CD28+) (e), and to divide effector memory cells into early (CD27+CD28+), intermediary (CD27+CD28− or CD27−CD28+) and late differentiated (CD27−CD28−) (f).
An average plaque contained 127,000±26,000 T cells of which 60, 200±12,000 were of CD8 T cell subset and 66,500±13,000 were of CD4 T cell subset (n= 28). Also, we evaluated the number of various T cells per mg of plaque’s wet weight. On average there were 190700 ±84300 lymphocytes per mg of plaque tissue (n= 7), the average plaque weighs 702± 0.13 mg (n=6). Figure 2 summarizes the data obtained from plaque cells. Flow cytometric analysis showed that, compared to blood, plaques were enriched in T cells, which constitute in this tissue 76.17±2.7% (n=22) of lymphocytes vs. 64.26±2.42 (n=21; p=0.005) in blood. In samples in which B, NK, NKT, and T cells were analyzed, B cells (CD19+ CD45+) were unequally represented in plaques and blood, making up 3.42±0.91% (n=22) and 5.92±0.56 % (n=21) of lymphocytes in these two compartments, respectively (p=0.013). NK cells were also unequally abundant in plaques and in blood and made up respectively 15.17±1.77% (n=22) and 22.78±2.7% (n=21) of lymphocytes in these two compartments (p= 0.023).
Figure 2. Comparison of lymphocyte distribution in blood and atherosclerotic plaques.
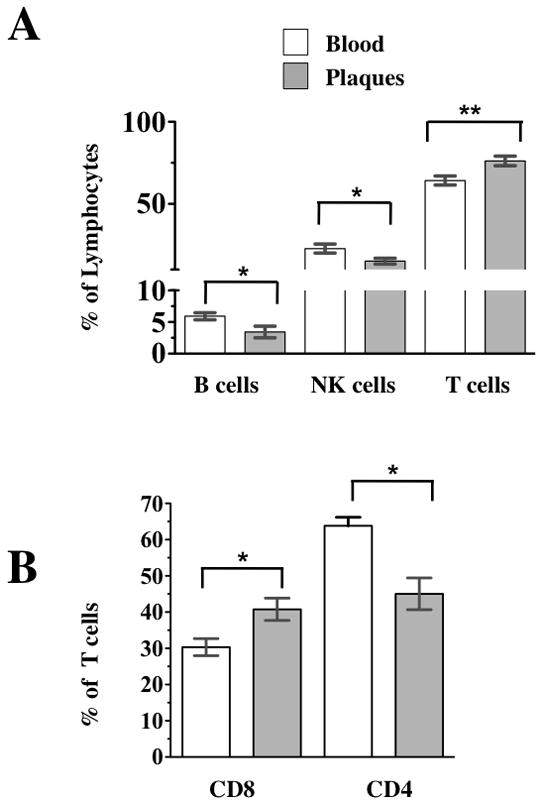
Blood cells, and cells liberated from atherosclerotic plaques were stained with a combination of CD45, CD3, CD4, CD19, CD16, CD56, and CD8. (a) Composition of lymphocytes: T cells, B cells and NK cells were identified by their expression of CD3, CD19, and CD56 CD16 and their relative abundance is expressed as % lymphocytes defined as described in Figure 1a-c. The Y axis is discontinuous to better visualize the low abundance of B and NKT cells. b) Comparison of the relative abundance of CD4 and CD8 T cells excluding NKT cells. The p values represent the results of paired t tests, * 0.01<p<0.05, ** p<0.01.
To evaluate the number of CD8+ T cells, defined as CD8+ CD3+ T cells, we first excluded NKT cells, which also express CD3 but can be distinguished by their expression of CD16 and CD56. In plaques CD8 T cells constituted 40.77±3.08% (n=22) of T cells, while in blood this fraction was 30.33±2.34% (n=21; p=0.01) (Fig 2b). Since CD8 and CD4 T cells together constitute almost the entire amount of T lymphocytes, CD4 T cells were, accordingly, less abundant in plaques than in blood and constituted in these two compartments respectively 45.04±4.39% (n=22) and 63.83±2.33%(n=22) of T cells (p<0.001). Thus, plaques are significantly enriched in CD8 T cells compared with blood.
3. T-cell subpopulations are different in plaques and blood
We stained cells for markers that allow the classification of T cells into naïve (CD45+CD3+ CD45RA+CD197+CD27+ CD28+) and memory cells, followed by the division into central memory cells (Tcm) (CD45+CD3+ CD45RA−CD197+CD27+ CD28+) and effector memory cells (Tem) (CD45+CD3+ CD45RA±CD197−)7. Analysis of these narrowly defined subpopulations of T cells revealed significant differences between blood and atherosclerotic plaques as well as between blood from patients harboring non-ruptured and ruptured plaques.
3.1 Subpopulations of CD8 T cells differ between plaque and blood
Among CD8 T cells, the fraction of Tcm differed between plaque and blood (18.25±1.84%, and 13.16±1.53% of CD8 T cells, respectively; n=28 and n=25, p=0.042). Similarly, Tem constituted a lower fraction of CD8 T cells in plaques than in blood (Fig. 3a), representing respectively 64.96±2.50% (n=28) and 76.23±2.82 (n=25; p=0.0042)
Figure 3. Comparison of T-cell phenotype in blood and atherosclerotic plaques.
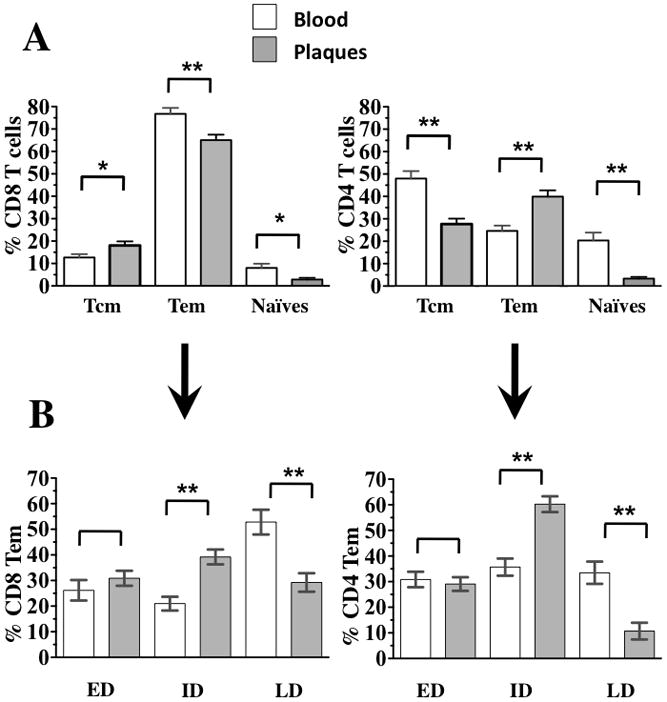
Blood cells, and cells liberated from atherosclerotic plaques were stained with a combination of CD45, CD3, CD4, CD28, CD27, CD197, and CD45RA. T cells were identified as described in Figure 1. Based on the expression of CD4, T cells were divided into CD4+ and CD4− T cells (CD8+ T cells. (a) The differential expression of CD197, CD45RA and CD28, CD27 allowed the classification of CD4 and CD8 T cells into naïve cells (CD45RA+CD197+CD27+CD28+), central memory cells (CD197+CD45RA−), and effector memory cells (CD45RA± CD197−). (b) Effector memory cells, based on the expression of CD27 and CD28, were divided into early-differentiated (ED) (CD27+CD28+), intermediary-differentiated (ID) (CD27+CD28− orCD27−CD28+) and late-differentiated (LD) (CD27−CD28−). The p values represent the results of paired t tests, * 0.01<p<0.05, ** p<0.01.
On the basis of the expression of CD28 and CD27, Tem cells can be subdivided into early-differentiated (CD45+CD3+ CD45RA−CD197−CD27+ CD28+) (Tem ED), intermediate (CD45+CD3+ CD45RA−CD197− CD27±CD28+) (Tem ID), and late-differentiated cells (CD45+CD3+ CD45RA± CD197− CD27− CD28−) (Tem LD)8. CD8 Tem distribution among these three maturation subsets was different in plaques and blood from the plaque donors (Fig. 3b). The fraction CD8 Tem ID cells respectively represented 39.20±2.87 % and 22.25±2.74% of CD8 Tem cells (p<0.001). The fraction CD8 Tem LD respectively represented 29.25±3.61% and 53.45±4.98% of CD8 Tem in plaque (n=28) and in patient blood (n=25; p<0.001). In contrast, the fractions of CD8 Tem ED cells in plaque and blood were not different and represented 31.5±2.96 % in plaque (n=28) and 24.28±3.71% in patient’s blood (n=25; p=0.13).
Also, naïve CD8 T cells were unequally distributed between plaques and blood, and respectively represented 2.86±0.73% and 8.13±2.0% (n=28 and n=25, p= 0.019) of CD8 T cells in these tissues.
3.2. CD4 T cell subpopulations in plaques and blood
Unlike CD8 T cells, CD4 Tcm cells are less represented in plaques than in blood, making up 27.68±2.43% and 50.44±2.99% of CD4 T cells in these respective compartments (n=28 and n=25, p<0.001) (Fig. 3a). On average, CD4 T cells in plaques were more differentiated than those in blood, with Tem making up 39.95±2.73% and 23.79±2.27% of CD4 T cells in these respective tissues (n=28 and n=25, p<0.001) (Fig. 3b). CD4 Tem ED were equally represented in plaques and in blood, and made up respectively 29.06±2.68% and 32.0±3.11% of CD4 Tem (n=28 and n=25, p= 0.476). CD4 Tem ID cells represented 60.24±3.1% and 37.38±3.34% of CD4 Tem in plaques and blood, respectively (n=28 and n=25, p<0.001), and finally CD4 Tem TD cells represented 10.68±3.25% and 30.61±4.18% of CD4 Tem (n=28 and n=25, p<0.001) in plaques and blood, respectively. Naïve CD4 T cells were unequally distributed between plaque and blood and represented respectively 3.34±0.73% and 19.27±3.21% (n=28 and n=25, p<0.001) of CD4 T cells in these tissues. Thus, the T-cell spectra are different in peripheral blood and atherosclerotic plaques.
Also, we performed intracellular staining for Treg cells and compared their fractions in plaque and blood. We defined Treg as CD4 T cells that expressed the transcription factor Foxp3 and the Il-2 receptor CD25. Cells isolated from the plaques and blood of 5 patients were stained for T cell surface markers and CD25, fixed and permeabalized with a Foxp3 compatible buffer system. We did not find any difference between plaque and blood regarding the presence of Treg cells. In plaques, Foxp3+CD25+ cells represented 2.29±0.89% of CD4 T cells, while in blood they represented 0.95±0.53% of CD4 T cells (p=0.313).
Finally, since the availability of specimens obtained from males and females was different, we investigated whether the predominance of male patients in our cohort could affect the results. We compared T cell subsets in plaques and blood from 7 females with those from 20 males. We found no statistically significant differences in the frequencies of B cells (p=0.48), NK cells (p=0.345), T cells (p=0.667), CD4 T cells (p=0.370) and CD8 T cells (p=0.312) from patients of different genders. Neither there were differences in CD8 T cell subsets in any subpopulations analyzed at the exception of CD8 Tcm and CD8 Tem. The fraction of CD8 Tcm was slightly lower in females than in males (10.11±1.6% vs 17.53±1.45%, p=0.012)
Fraction of CD8 Tem was higher in females than in males (78.69±2.79% vs 67.81±2.32%, p=0.022). Similarly, the fine analysis of CD4 T cell phenotypes showed that the only difference between males and females was in the proportion of CD28−CD4+ T cells which were higher in females (11.95±2.84 vs 6.53±1.01%, p=0.033).
4. Analysis of the activation status of T cells in plaque and blood
We compared the expression of the late activation markers CD25, CD38, and HLA-DR as well as of INF-γ, and IL-2 on CD8 and CD4 T cells isolated from plaques and from the blood of the individuals from whom these plaques were obtained.
4.1. Activation of CD8 T cells in plaques and blood
Analysis of the expression of these activation markers revealed that in plaques, CD8 T cells are more activated than in blood (Fig. 4a). CD25 was expressed by 23.05±4.6% (n=28) and 7.41±4.77% (n=26; p= 0.02) of CD8 T cells in plaques and blood, respectively. CD38 was also expressed on a larger fraction of CD8 T cells isolated from plaque than from blood: 41.26±2.69% (n=28) and 34.55±2.79% (n=26). However, this difference was not significant (p= 0.089). Also, the fraction of cells expressing HLA-DR was higher in plaques than in blood and represented respectively 47.26±3.54% (n=28) and 28.31±3.67% (n=26; p< 0.001) of CD8 T cells. The fraction of cells co-expressing CD25 and HLA-DR was the most discriminative between plaques and blood, constituting 14.88±3.29% (n=22) in plaques and only 2.48±3.54% (n=19) in blood (p=0.011).
Figure 4. Comparison of lymphocyte activation in blood and atherosclerotic plaques.
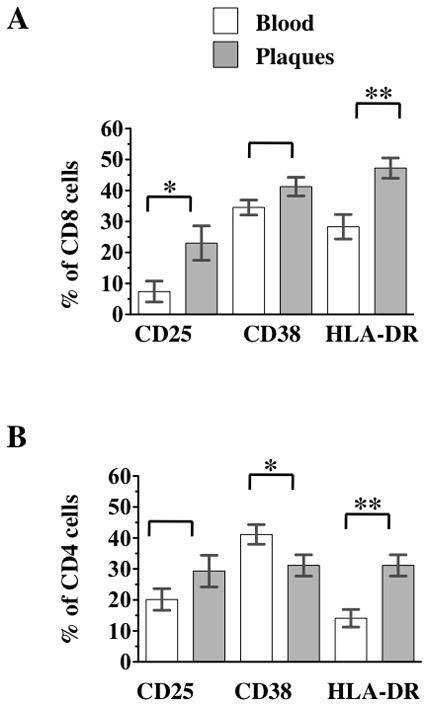
Blood cells, and cells liberated from atherosclerotic plaques were stained with a combination of CD45, CD3, CD4, CD25, CD38, and HLA-DR. a) Comparison of CD8 T cells activation in blood and atherosclerotic plaque. b) Comparison of CD8 T cells activation in blood and atherosclerotic plaque. The p value represent the results of paired t tests, * 0.01<p<0.05, ** p<0.01.
4.2. Activation of CD4 T cells in plaques and blood
CD4 T cells (Fig. 4b) in blood and plaques could not be distinguished on the basis of their expression of CD25: this activation marker was expressed by 29.31±4.35% (n=28) of plaque CD4 T cells and by 20.09±4.51% (n=26) of blood CD4 T cells, respectively (p=0.143). However, the expression of CD38 was different on plaque and blood CD4 T cells: 31.14±3.25% (n=28) and 41.13±3.38% (n=26), respectively (p=0.038). Similarly, the fractions of CD4 T cells expressing HLA-DR were different in plaques and blood and in these two tissues constituted respectively 37.16±2.92% (n=28) and 14.12±3.03% (n=26; p<0.001).
It appeared, from the comparison of the activation of CD4 and CD8 T cells, that, in plaques, CD8 T cells were preferentially activated. Indeed, 41.26±2.69% of plaque CD8 T cells expressed CD38 compared with only 31.14±3.25% of CD4 T cells (n=28, p<0.001). Similarly, HLA-DR was expressed on 47.26±3.54% of CD8 T cells and 37.16±2.92% of CD4 T cells (n=26, p=<0.001). Also, in blood, HLA-DR expression was higher on CD8 T cells than on CD4 T cells: respectively 28.31±3.67% vs. 7.41±4.77% (n=26, p=<0.001). However, the expression of CD25 was higher on CD4 T cells than on CD8 T cells: respectively by 20.09±4.51% vs. 7.4±3.8% (n=26, p<0.001).
Finally, we stained cells for the production of INF-γ and IL-2. However, these cytokines were not expressed in the cells, unless they were activated with a polyclonal activator PMA/iononomycin. When activated, among CD8 T cells in plaque 29.54±8.3% (median 29.758% IQR[4.66%-54.28%], n=5) expressed Il-2 and 34.09±15.46 (median 22.95%, IQR[9.07%–64.68%], n=5) expressed IFN-γ. In blood, these cytokines were respectively expressed by 4.13±8.29% (median 1.97%, IQR[0.275%-9.08%], n=5) and 20.63±15.64% (median 5.75%, IQR[2.53%-46.16%]). Similar analysis of CD4 T cells revealed that in plaques 40.73±8.9% (median 36.90% IQR[16.51%-66.85%], n=5) expressed Il-2 and 26.55±10.66 (median 18.5%, IQR[5.07%–52.05%](n=5)) expressed IFN-γ. In blood these cytokines were respectively expressed by 7.79±8.90% (median 4.12%, IQR[0.75%-16.66%], n=5) and 9.9±10.62% (median 3.24%, IQR[0.84%-22.33%]). We also attempted to detect the pro-inflammatory Th17 cells, defined as CD161-expressing cells that secret IL-17A9. A lager fraction of plaque than blood CD8 T cells upon stimulation expressed CD161 and produce IL-17 (29.15±4.3% vs. 17.18±3.14% and 0.48 ±0.26% vs. 0.08±0.04%, respectively). However these differences did not reach statistical significance (p=0.186 and p=0.054, respectively n=5) and there was no difference in the number of cells co-expressing IL-17 and CD161 (0.48 ±0.26% vs. 0.08±0.04%, of CD8 T cells respectively, p=0.186).
Similarly, more plaque than blood CD4 T cells expressed CD161 upon stimulation (63.16+2.28% vs. 28.97±6.02%, respectively, n=5, p=0.003) and secreted Il-17 (1.5±0.48% vs. 0.25±0.13%, n=5, p=0.041). However, when these two markers we combined to identify Th17 cells, the differences vanished, and CD161+ Th17+ cells respectively represented 0.91±0.42% vs. 0.13±0.17% of CD4 T cells in plaque and blood (p=0.12). Thus we found no statistical difference in cytokines’ expression between artificially-stimulated T cells from blood and from plaques, probably due to the large variation of the data.
In the above-presented analysis we compared fractions of T cells and status in plaques and blood from the same patients. Here, we compared these parameters with those of cells from seven healthy donors using an ANOVA across these three groups and the post-hoc analysis with the Tukey-Kramer HSD correction for multiple comparisons. The difference between T cell fractions of lymphocytes (defined by their expression of CD45 in a low SSC gate) in these three tissues was significant (p=0.026). However, the only significant difference was between the fraction of T cells in plaque and patient blood (p=0.008). A significant difference was revealed between the three groups in the fractions of CD4 and CD8 T cells (p<0.001 and p=0.007, respectively). In addition to the above-described differences between plaque and patient’s blood, the post-hoc analysis revealed differences between plaque and control blood in the fraction of CD4 (p=0.002) and CD8 (p=0.028) T cells. In contrast, the CD4 and CD8 fractions were not different between plaque donors’ blood and control blood (0.7<p<0.77). The analysis of CD4 T cells subsets confirmed all the above-described differences between plaque and patient blood, but it also revealed differences between patient’s blood and control blood: the latter contained significantly more CD4 Tem ED cells than patient’s blood (51.32±5.6% vs 32.01±2.97, p=0.0098), while CD4 Tem LD cells were more abundant in patient’s blood than in control blood (30.6±3.65% vs. 9.3±6.9%, p=0.023). Naïve CD4 T cells were found to be more abundant in control blood group than in patient’s blood (40.18±4.26% vs 19.27 ±2.25%, p<0.001). Finally this analysis revealed a difference in the distribution of CD4+ CD28− T cells, which was only significant between patient’s blood and control blood (9.16±1.39% vs. 1.91±2.5%, p=0.043).
The analysis of the CD8 T cell subsets between the three groups revealed that blood from control donors contained significantly less CD8 Tem than patient’s blood (48.97±5.49 vs .76.23±2.91% p<0.001). While the ANOVA revealed differences in the distribution of CD8 Tem ID and CD8 Tem LD between the three tissues (p=0.0001 and p=0.0006 respectively), the post-hoc analysis did not show any difference between patient’s blood and control blood (0.143<p<0.9359). Naïve CD8 T cells were not equally distributed between the three groups (p<0.001), however, the post-hoc analysis did reveal a difference between patients’ blood and plaque while revealing significant differences between control blood (33.40±3.18%) and patient’s blood (p<0.001) and plaques (p<0.001).
The fractions of B cells and NK cells were not significantly different when compared in plaques, blood from the plaques’ donors and normal blood (p=0.058 and p=0.11 respectively).
In summary our data show that plaques are highly enriched with activated T cells, especially of the CD8 phenotype.
DISCUSSION
Although since Rudolph Virchow’s time it has been suspected that inflammation contributes to the development of atherosclerosis, its pivotal role in the growth and rupture of plaques began to be appreciated only recently. The amounts of many inflammatory cytokines strongly correlate with the mortality of CAD patients 1, 10. Also, increase in the fraction of particular blood lymphocyte subsets has been reported to be associated with higher frequency of cardiac events in patients with coronary artery disease, rheumatoid arthritis, diabetes mellitus, and kidney insufficiency 11–14. Not only systemic, but also local inflammation, even distant inflammation, affects the status of atherosclerotic plaques, as for example evidenced by a significant association between periodontitis and coronary atherosclerosis 15. Even more importantly, inflammation at the site of the plaque may affect plaque growth and rupture, resulting in clinical events such as unstable angina or acute myocardial infarction. Like other cases of inflammation, inflammation at the site of a plaque should be manifested by the infiltration and activation of the cells of the immune system 3, 16, 17.
However, a comprehensive single-cell analysis of individual cells in plaques has not yet been performed except with traditional histochemistry which demonstrated that there are more lymphocytes 4, 18 and DCs 19 in complicated carotid endarterectomy specimens than in control arteries. One of the main obstacles to modern cutting-edge multi-parameter characterization of plaque cells with multi-color flow cytometry stems from the difficulty in isolating cells from plaque tissue without impairing the expression of their surface markers, which define the cells’ identity. In this study, we overcame this problem and developed an original protocol for isolation of plaque lymphocytes that preserves their surface markers.
We tested different enzyme cocktails on PBMCs, where the surface markers of the treated samples can be compared with those of the untreated control. We chose an optimal enzyme cocktail combination based on collagenase IV, which liberates cells from atherosclerotic plaques while preserving their identity. This allowed us to perform a meaningful multi-colored flow-cytometric analysis of these cells.
The first question we asked was whether plaques represent a separate immunological compartment with lymphocytes different from those in blood. We found that indeed, lymphocytes in plaques and blood differed significantly: plaques are enriched with CD8 T cells (the average CD4/CD8 ratio in blood was 2.76±0.4 while in plaques it was only 1.3±0.24). Furthermore, T lymphocytes, especially CD8 T cells in plaques, are more activated than in blood, as evaluated from the expression of the CD25, CD38, and HLA-DR activation markers. The fraction of cells co-expressing CD25 and HLA-DR in plaques was 10 times larger than in blood. Although in plaques, the fractions of T cells expressing activation markers were high, at the time of isolation, the frequency of cells spontaneously producing cytokines was below our level of detection unless the cells were artificially activated after isolation. Similar phenomenon we observed for blood cells in agreement to what was reported earlier for unstimulated blood 20–22 and to the common practice of using unstimulated blood as negative control in intracellular cytokine staining. Short of knowing the antigens responsible for the activation of these cells in vivo, only ubiquitous polyclonal activators can reveal the pattern of T cell cytokine polarization, which happened in vivo, PMA is such an activator 20.
In general, our data indicate that plaque lymphocytes were not contaminants of our preparation and did not penetrate plaques indiscriminately. Moreover, CD8 T cells in plaques not only are more abundant but also are more activated than in blood, indicating a local inflammatory-like process that takes place in plaques. One possible explanation of the fact that CD8 rather than CD4 T cells seem to be activated is that the antigens that activate T cells may be of viral or endogenous nature (e.g. a heat shock protein or oxydated forms of LDL3, 11, 23, 24. In the future, our approach may allow the expansion of T cells in order to test this speculation.
One of the drawbacks of our current study is that we did not differentiate between different types of plaques. Reliable differentiation of plaques into ruptured and non-ruptured is complicated by possible tissue damage during atherectomy. However, the usage of our protocol for T cell isolation in future studies will allow us to analyze possible differences between the T lymphocytes in tissues of individuals with ruptured and non-ruptured plaques and plaques with superficial erosions.
Also, it would be important to follow, on a larger number of samples, the differences between men and women in plaques’ T cells. In particular, it would be interesting to extend our observation on the higher proportion of CD28−CD4+ women’s plaques compared to men’s. The high proportion of these cells in blood is associated with recurrent coronary instability, type 2 diabetus mellitus25, 26, and with polycystic ovary syndrome with high risk of acute coronary syndrome 27. The high proportion of CD28−CD4+ in women’s plaques may be relevant to the lesser obstructive coronary disease in women with acute coronary syndrome compared to men 28. Another promising future work may focus on the analysis the T cell subpopulations in patients with superficial erosions of plaques that are more common in women 29.
Finally, in the current work we focused on comparing plaque and blood cells from the same donors. Another important comparison, that is between blood of patients with plaques and that of healthy individuals was largely out of the scope of our work since it requires matching the two groups for many parameters. Comparing T cells isolated from plaque and blood of patient with cardio vascular disease overcomes this problem. Nevertheless, in the present work we compared cell composition between three groups of samples: plaque cells, blood cells of the plaques’ donors and blood cells of healthy individuals. We found that blood obtained from patients with plaques contained more CD4 Tem, terminally differentiated CD4 T cells, and CD4+ CD28− T cells, but less naïve CD4 and CD8 T cells as well as early differentiated CD4 Tem. Also blood from plaque donors contained more activated T cells. These results are in agreement with the earlier published works 3, 11, 23.
In general, the enrichment of plaques with CD8 T cells and the preferential activation both of these cells and of CD4 T cells compared with activation levels in blood may indicate the presence of foreign antigens in these plaques as was suggested earlier 4,18, 30, 31, 24, 32. Identification of antigens that have triggered T cell migration to the endothelial wall 33 and activation in plaques requires analysis of the reaction of individual T cells to these antigens. With the development of the protocol of isolation and identification of T cells from plaques that is described in the present paper, such analysis is becoming possible.
Table 2.
Marker used to define cell subsets assessed in this study
| Markers | |||||||
|---|---|---|---|---|---|---|---|
|
| |||||||
| Subset
|
|||||||
| Lymphocytes | Low SSC | Hig CD45 | |||||
| B cell | CD45 | (CD3−)Δ | CD19 | ||||
| NK cells | CD45 | (CD3−)Δ | CD16 | CD56 | |||
| NK T cells | CD45 | CD3 | CD16 | CD56 | |||
|
| |||||||
| T cells | CD45 | CD3 | (CD16−)Δ | (CD56−)Δ | |||
|
| |||||||
| T cell subsets | CD4 | CD4+ | (CD8−)† | ||||
| CD8 | CD8 | ||||||
|
| |||||||
| Naives | CD197+ | (CD45RA-)Δ | CD27+ | CD28+ | |||
|
| |||||||
| Central Memory (Tcm) | CD197+ | CD45RA | CD27+ | CD28+ | |||
|
| |||||||
| Effector memory (Tem) | |||||||
|
| |||||||
| Early differentiated | (CD197−)Δ | CD45RA+/− | CD27+ | CD28+ | |||
|
|
|||||||
| Intermediately Differentiated | (CD197−)Δ | CD45RA+/− | CD27+/− | CD28+ | |||
|
|
|||||||
| Late Diffrentiated | (CD197−)Δ | CD45RA+/− | CD27− | CD28− | |||
|
| |||||||
| Treg
|
CD4 | CD25 | Foxp3 | ||||
| Th17
|
(CD8−)† | CD161 | IL-17α | IL-22 | |||
| TH1 | (CD8−)† | T-Bet | INF-γ | IL-2 | IL-2 | ||
|
| |||||||
| Activation markers | CD25 | CD38 | HLA-DR | ||||
Notes:
Exclusion marker: i.e the expression of this marker was used to gate out unwanted phenotypes.
The exclusion of CD8 expression within T cells was used to define CD4 cells when this marker couldn’t be included in the panel.
Acknowledgments
We would like to thank Dr Barry Alpher for his editorial correction of the English style of the manuscript.
Sources of Funding
This work was supported by the Russian Federal Program “Scientific and pedagogical cadres of innovation Russia 2009–2013”. Russian State (Contract # 14.740.11.0933)
The work of J-G. G. and L.M. was supported in part by the Intramural Research Program of the Eunice Kennedy-Shriver National Institutes of Child Health and Human Development, NIH.
References
- 1.Libby P, Okamoto Y, Rocha VZ, Folco E. Inflammation in atherosclerosis: Transition from theory to practice. Circ J. 2010;74:213–220. doi: 10.1253/circj.cj-09-0706. [DOI] [PubMed] [Google Scholar]
- 2.Tahara N, Imaizumi T, Virmani R, Narula J. Clinical feasibility of molecular imaging of plaque inflammation in atherosclerosis. J Nucl Med. 2009;50:331–334. doi: 10.2967/jnumed.108.060376. [DOI] [PubMed] [Google Scholar]
- 3.Gewaltig J, Kummer M, Koella C, Cathomas G, Biedermann BC. Requirements for cd8 t-cell migration into the human arterial wall. Hum Pathol. 2008;39:1756–1762. doi: 10.1016/j.humpath.2008.04.018. [DOI] [PubMed] [Google Scholar]
- 4.De Palma R, Del Galdo F, Abbate G, Chiariello M, Calabro R, Forte L, Cimmino G, Papa MF, Russo MG, Ambrosio G, Giombolini C, Tritto I, Notaristefano S, Berrino L, Rossi F, Golino P. Patients with acute coronary syndrome show oligoclonal t-cell recruitment within unstable plaque: Evidence for a local, intracoronary immunologic mechanism. Circulation. 2006;113:640–646. doi: 10.1161/CIRCULATIONAHA.105.537712. [DOI] [PubMed] [Google Scholar]
- 5.Mahnke YD, Roederer M. Optimizing a multicolor immunophenotyping assay. Clin Lab Med. 2007;27:469–485. v. doi: 10.1016/j.cll.2007.05.002. [DOI] [PMC free article] [PubMed] [Google Scholar]
- 6.Tung JW, Heydari K, Tirouvanziam R, Sahaf B, Parks DR, Herzenberg LA. Modern flow cytometry: A practical approach. Clin Lab Med. 2007;27:453–468. v. doi: 10.1016/j.cll.2007.05.001. [DOI] [PMC free article] [PubMed] [Google Scholar]
- 7.Appay V, van Lier RA, Sallusto F, Roederer M. Phenotype and function of human t lymphocyte subsets: Consensus and issues. Cytometry A. 2008;73:975–983. doi: 10.1002/cyto.a.20643. [DOI] [PubMed] [Google Scholar]
- 8.Appay V, Dunbar PR, Callan M, Klenerman P, Gillespie GM, Papagno L, Ogg GS, King A, Lechner F, Spina CA, Little S, Havlir DV, Richman DD, Gruener N, Pape G, Waters A, Easterbrook P, Salio M, Cerundolo V, McMichael AJ, Rowland-Jones SL. Memory cd8+ t cells vary in differentiation phenotype in different persistent virus infections. Nat Med. 2002;8:379–385. doi: 10.1038/nm0402-379. [DOI] [PubMed] [Google Scholar]
- 9.Brucklacher-Waldert V, Steinbach K, Lioznov M, Kolster M, Holscher C, Tolosa E. Phenotypical characterization of human th17 cells unambiguously identified by surface il-17a expression. Journal of immunology. 2009;183:5494–5501. doi: 10.4049/jimmunol.0901000. [DOI] [PubMed] [Google Scholar]
- 10.Stefanadi E, Tousoulis D, Papageorgiou N, Briasoulis A, Stefanadis C. Inflammatory biomarkers predicting events in atherosclerosis. Curr Med Chem. 2010;17:1690–1707. doi: 10.2174/092986710791111288. [DOI] [PubMed] [Google Scholar]
- 11.Libby P. Role of inflammation in atherosclerosis associated with rheumatoid arthritis. Am J Med. 2008;121:S21–31. doi: 10.1016/j.amjmed.2008.06.014. [DOI] [PubMed] [Google Scholar]
- 12.Liuzzo G, Biasucci LM, Trotta G, Brugaletta S, Pinnelli M, Digianuario G, Rizzello V, Rebuzzi AG, Rumi C, Maseri A, Crea F. Unusual cd4+cd28null t lymphocytes and recurrence of acute coronary events. J Am Coll Cardiol. 2007;50:1450–1458. doi: 10.1016/j.jacc.2007.06.040. [DOI] [PubMed] [Google Scholar]
- 13.Rizzello V, Liuzzo G, Brugaletta S, Rebuzzi A, Biasucci LM, Crea F. Modulation of cd4(+)cd28null t lymphocytes by tumor necrosis factor-alpha blockade in patients with unstable angina. Circulation. 2006;113:2272–2277. doi: 10.1161/CIRCULATIONAHA.105.588533. [DOI] [PubMed] [Google Scholar]
- 14.Giubilato S, Liuzzo G, Brugaletta S, Pitocco D, Graziani F, Smaldone C, Montone RA, Pazzano V, Pedicino D, Biasucci LM, Ghirlanda G, Crea F. Expansion of cd4+cd28null t-lymphocytes in diabetic patients: Exploring new pathogenetic mechanisms of increased cardiovascular risk in diabetes mellitus. Eur Heart J. 2011 doi: 10.1093/eurheartj/ehq499. [DOI] [PubMed] [Google Scholar]
- 15.Humphrey LL, Fu R, Buckley DI, Freeman M, Helfand M. Periodontal disease and coronary heart disease incidence: A systematic review and meta-analysis. J Gen Intern Med. 2008;23:2079–2086. doi: 10.1007/s11606-008-0787-6. [DOI] [PMC free article] [PubMed] [Google Scholar]
- 16.Naruko T, Ueda M, Haze K, van der Wal AC, van der Loos CM, Itoh A, Komatsu R, Ikura Y, Ogami M, Shimada Y, Ehara S, Yoshiyama M, Takeuchi K, Yoshikawa J, Becker AE. Neutrophil infiltration of culprit lesions in acute coronary syndromes. Circulation. 2002;106:2894–2900. doi: 10.1161/01.cir.0000042674.89762.20. [DOI] [PubMed] [Google Scholar]
- 17.Taleb S, Tedgui A, Mallat Z. Regulatory t-cell immunity and its relevance to atherosclerosis. J Intern Med. 2008;263:489–499. doi: 10.1111/j.1365-2796.2008.01944.x. [DOI] [PubMed] [Google Scholar]
- 18.Rossmann A, Henderson B, Heidecker B, Seiler R, Fraedrich G, Singh M, Parson W, Keller M, Grubeck-Loebenstein B, Wick G. T-cells from advanced atherosclerotic lesions recognize hhsp60 and have a restricted t-cell receptor repertoire. Exp Gerontol. 2008;43:229–237. doi: 10.1016/j.exger.2007.11.009. [DOI] [PubMed] [Google Scholar]
- 19.Erbel C, Sato K, Meyer FB, Kopecky SL, Frye RL, Goronzy JJ, Weyand CM. Functional profile of activated dendritic cells in unstable atherosclerotic plaque. Basic Res Cardiol. 2007;102:123–132. doi: 10.1007/s00395-006-0636-x. [DOI] [PubMed] [Google Scholar]
- 20.Sullivan KE, Cutilli J, Piliero LM, Ghavimi-Alagha D, Starr SE, Campbell DE, Douglas SD. Measurement of cytokine secretion, intracellular protein expression, and mrna in resting and stimulated peripheral blood mononuclear cells. Clin Diagn Lab Immunol. 2000;7:920–924. doi: 10.1128/cdli.7.6.920-924.2000. [DOI] [PMC free article] [PubMed] [Google Scholar]
- 21.Asemissen AM, Nagorsen D, Keilholz U, Letsch A, Schmittel A, Thiel E, Scheibenbogen C. Flow cytometric determination of intracellular or secreted ifngamma for the quantification of antigen reactive t cells. J Immunol Methods. 2001;251:101–108. doi: 10.1016/s0022-1759(01)00312-x. [DOI] [PubMed] [Google Scholar]
- 22.Theodorou GL, Marousi S, Ellul J, Mougiou A, Theodori E, Mouzaki A, Karakantza M. T helper 1 (th1)/th2 cytokine expression shift of peripheral blood cd4+ and cd8+ t cells in patients at the post-acute phase of stroke. Clin Exp Immunol. 2008;152:456–463. doi: 10.1111/j.1365-2249.2008.03650.x. [DOI] [PMC free article] [PubMed] [Google Scholar]
- 23.Libby P, Ridker PM, Maseri A. Inflammation and atherosclerosis. Circulation. 2002;105:1135–1143. doi: 10.1161/hc0902.104353. [DOI] [PubMed] [Google Scholar]
- 24.Keller TT, van der Meer JJ, Teeling P, van der Sluijs K, Idu MM, Rimmelzwaan GF, Levi M, van der Wal AC, de Boer OJ. Selective expansion of influenza a virus-specific t cells in symptomatic human carotid artery atherosclerotic plaques. Stroke. 2008;39:174–179. doi: 10.1161/STROKEAHA.107.491282. [DOI] [PubMed] [Google Scholar]
- 25.Giubilato S, Liuzzo G, Brugaletta S, Pitocco D, Graziani F, Smaldone C, Montone RA, Pazzano V, Pedicino D, Biasucci LM, Ghirlanda G, Crea F. Expansion of cd4+cd28null t-lymphocytes in diabetic patients: Exploring new pathogenetic mechanisms of increased cardiovascular risk in diabetes mellitus. Eur Heart J. 2011;32:1214–1226. doi: 10.1093/eurheartj/ehq499. [DOI] [PubMed] [Google Scholar]
- 26.Giubilato S, Campioni M, Severino A, Tritarelli A, Pazzano V, Pedicino D, Graziani F, Montone RA, Galiffa V, Giglio AF, Pitocco D, Biasucci LM, Ghirlanda G, Liuzzo G, Crea F. Altered adaptive immune response in type 2 diabetes mellitus: Enhanced pro-inflammatory activity of cd4+cd28null t-cells in diabetic versus non diabetic patients with acute coronary syndromes. Circulation. 2010:122. [Google Scholar]
- 27.Niccoli G, Apa R, Lanzone A, Liuzzo G, Spaziani C, Sagnella F, Cosentino N, Moro F, Martinez D, Morciano A, Baca M, Pazzano V, Gangale MF, Tropea A, Crea F. Cd4+cd28 null t lymphocytes are expanded in young women with polycystic ovary syndrome. Fertil Steril. 2011;95:2651–2654. doi: 10.1016/j.fertnstert.2011.01.129. [DOI] [PubMed] [Google Scholar]
- 28.Hochman JS, Tamis JE, Thompson TD, Weaver WD, White HD, Van de Werf F, Aylward P, Topol EJ, Califf RM. Sex, clinical presentation, and outcome in patients with acute coronary syndromes. Global use of strategies to open occluded coronary arteries in acute coronary syndromes iib investigators. N Engl J Med. 1999;341:226–232. doi: 10.1056/NEJM199907223410402. [DOI] [PubMed] [Google Scholar]
- 29.Arbustini E, Dal Bello B, Morbini P, Burke AP, Bocciarelli M, Specchia G, Virmani R. Plaque erosion is a major substrate for coronary thrombosis in acute myocardial infarction. Heart. 1999;82:269–272. doi: 10.1136/hrt.82.3.269. [DOI] [PMC free article] [PubMed] [Google Scholar]
- 30.Chen S, Crother TR, Arditi M. Emerging role of il-17 in atherosclerosis. J Innate Immun. 2010;2:325–333. doi: 10.1159/000314626. [DOI] [PMC free article] [PubMed] [Google Scholar]
- 31.Ionita MG, Arslan F, de Kleijn DP, Pasterkamp G. Endogenous inflammatory molecules engage toll-like receptors in cardiovascular disease. J Innate Immun. 2010;2:307–315. doi: 10.1159/000314270. [DOI] [PubMed] [Google Scholar]
- 32.Shi Y, Tokunaga O. Chlamydia pneumoniae and multiple infections in the aorta contribute to atherosclerosis. Pathol Int. 2002;52:755–763. doi: 10.1046/j.1440-1827.2002.01422.x. [DOI] [PubMed] [Google Scholar]
- 33.Barlic J, Murphy PM. Chemokine regulation of atherosclerosis. J Leukoc Biol. 2007;82:226–236. doi: 10.1189/jlb.1206761. [DOI] [PubMed] [Google Scholar]