Abstract
Objectives
The interaction of ultrasound contrast agents (UCAs) and ultrasound (US) provides a way to spatially and temporally target tissues. Recently, UCAs have been used therapeutically to induce localized angiogenesis. Ultrasound contrast agents, however, have been documented to induce negative bioeffects. To further understand the balance of risks and benefits of UCAs and to examine the mechanism of US-UCA–induced angiogenesis, this study explored the role of UCAs, in particular Definity (Lantheus Medical Imaging, Inc, North Billerica, MA), in producing an angiogenic response.
Methods
The gracilis muscles of Sprague Dawley rats were exposed to 1-MHz US. The rats were euthanized the same day or allowed to recover for 3 or 6 days post exposure (DPE). Ultrasound peak rarefactional pressures (Prs) of 0.25, 0.83, 1.4, and 2.0 MPa were used while rats were infused with either saline or Definity. Assessments for angiogenesis included capillary density, inflammation, and vascular endothelial growth factor (VEGF), both acutely (0 DPE) and at 3 and 6 DPE.
Results
The results of this study suggest that the angiogenic response is dependent on infusion media, Pr, and DPE. While capillary density did not reach significance, VEGF expression was significant for infusion media, Pr, and DPE with inflammation co-occurrence (P < .05).
Conclusions
These results suggest that the angiogenic response is elicited by a mechanical effect of US-UCA stimulation of VEGF that is potentially optimized when collapse occurs.
Keywords: angiogenesis, proangiogenic therapy, therapeutic ultrasound, ultrasound contrast agent, ultrasound-induced bioeffects, vascular endothelial growth factor
Cardiovascular diseases affect one-quarter of men and women between the ages of 20 and 39 years; this number more than doubles after the age of 40 years.1 These statistics include ischemia affecting the heart, brain, kidney, and limbs, due to atherosclerosis or diabetes. Current treatments are contraindicated for certain populations due to their invasiveness. For that reason, ultrasound (US) has been explored as a new strategy for myocardial and limb ischemia over the past decade. Ultrasound has been cited to cause upregulation of angiogenic growth factors such as vascular endothelial growth factor (VEGF) and basic fibro - blast growth factor,2,3 decreased wound healing time,4 in addition to the induction of angiogenesis in hind limb ischemia.5
Recently, microbubbles have been explored as a means of drug delivery in an effort to treat ischemia.6–8 Studies have shown that US and ultrasound contrast agents (UCAs) induce neovascularization9,10 and arteriogenesis11,12 and improve cardiac function8 in ischemic models. However, an equal amount of literature details the ability of US and UCAs to create damage to various tissues. Ultrasound and UCAs have been documented to create undesired bioeffects, including premature ventricular contractions,13 hemorrhage,14,15 capillary disruptions,16 and lesions17 in normal animal models. Bioeffects studies focus on 0-day effects in normal models, while methods to induce angiogenesis focus on 3 to 28 days after US exposure, typically with ischemic models. Acute (0-day) and effect days are rarely addressed in the same study. As such, little is known about the mechanism of US-UCA–induced angiogenesis.
One of the reasons for the disconnect between US’s biological effects and therapy is that there is a lack of understanding of mechanisms initiating the angiogenic response. Literature shows a wide range of US peak rare - factional pressures (Prs) has been used5,8,11,18,19 with no dose-effect examination of the therapy. A relatively low Pr (0.25 MPa) was demonstrated to induce an angiogenic response,7 while Fuji et al19 found a much higher Pr (4.5 MPa) to be beneficial. When UCAs are used, Pr is the exposure quantity of particular importance because it affects the behavior of the UCA. As incident Pr increases, the UCA becomes less stable and eventually collapses.20,21 The UCAs behavior affects the vasculature and initiation of a biological response.22,23
Therefore, in an effort to connect the 0-day (day of exposure) bioeffects with subsequent therapeutic responses, this study seeks to examine the role of the UCAs, and relate the physical mechanism by which US-UCA interaction induces angiogenesis, via a dose-effect study on Pr.
Materials and Methods
Ultrasound
A 1-MHz focused (f/3) single-element transducer (E1051, 0.75-in diameter; Valpey Fisher, Hopkinton, MA) connected to a power source (RAM5000; Ritec, Inc, Warwick, RI) was used for the exposures. An established procedure for exposures is detailed in previously published work.24 Briefly, a custom-built system containing 35°C degassed water was made to allow transducer coupling to the point of contact. An automated procedure, based on established standards,25,26 was used to routinely calibrate the US fields.27
Exposimetry
The in situ Prs were estimated from Pr (in situ) = Pr (in vitro) e−Ax, where Pr (in vitro) is the global-maximum water-based value. A is the attenuation coefficient of the skin (A ≈ 2 dB/cm at 1 MHz)28 overlying the gracilis muscle, which had a thickness, x, of approximately 1 mm. Attenuation of US by intervening tissue is negligible (0.98 of in vitro Pr); thus, the reported Pr is that of the in vitro value.
Prior to US exposure, the transducer was aligned with marked exposure sites. For transducer alignment, a low Pr value (50 kPa) was used to ensure minimal US-induced damage. Quantities used during the 1-MHz US exposure included Prs of 0, 0.25, 0.83, 1.4, and 2.0 MPa, a pulse duration of 10 cycles (10 microseconds), a pulse repetition frequency of 10 Hz, and an exposure duration of 5 minutes at each location.
Animals
One hundred fifty female Sprague Dawley rats (Harlan, Indianapolis, IN) were used in this 3 × 4 × 2 factorial study examining days post exposure (DPE; 0, 3, or 6), Pr, and infusion media (saline or Definity [Lantheus Medical Imaging, Inc, North Billerica, MA]), respectively. The rats were not only within a specified age range (11–13 weeks old) but also a specific weight range (190–250 g; mean, 200 g). Six rats served as cage controls, and contralateral limbs were used as shams (Pr = 0 MPa) for exposed animals. The remaining 144 rats were randomly assigned to 1 of 3 × 4 × 2 = 24 groups with n = 6 for each group.
Rats were weighed and anesthetized with ketamine hydrochloride (87 mg/kg) and xylazine (13 mg/kg) administered intraperitoneally. Hind limb hair over the gracilis muscle was removed with an electric clipper, followed by a depilatory agent (Nair; Carter-Wallace, Inc, New York, NY) to maximize sound transmission. The rat was then placed in a custom-built holder. Two locations, approximately 6 mm apart, on either the right or left gracilis muscle (randomized) were marked with a black dot to denote the US exposure location. The US transducer was visually aligned with the black dot using a custom-built laser pointer that was spatially registered with the beam focus. For both US-UCA– and US-saline–infused groups, the 0-day rats were euthanized within 1 hour following exposure; the 3- and 6-day rats were euthanized on their respective days.
The experimental protocol was approved by the Institutional Animal Care and Use Committee of the University of Illinois and satisfied all campus and National Institutes of Health rules for the humane use of laboratory animals. Animals were housed in an Association for Assessment and Accreditation of Laboratory Animal Care (Rockville, MD)–approved animal facility and provided food and water ad libitum.
Microbubble Preparation and Infusion
The manufacturer’s recommended dosage for infusion was used to establish the 1× concentration of Definity for UCA-infused groups.
Initial Manual Injection of the UCA or Saline
Prior to US exposure, the rat tail vein was manually injected for 30 seconds with 0.5 mL of Definity solution (0.15 mL of Definity in 0.35 mL of saline) such that the UCA was introduced into circulation. The saline group received 0.5 mL of saline for 30 seconds prior to US exposure.
Infusion of UCAs or Saline
After manual injection, 1.0 mL of Definity solution (0.3 mL of Definity in 0.7 mL of saline) was infused with an infusion pump (model 780100; KD Scientific, Holliston, MA) for 15 minutes into the rat tail vein at a rate of 4.0 mL/h. The resulting infusion rate was a maximum of 2 × 10⁸ microbubbles/min. The first of 2 US-exposed sites was started approximately 5 seconds after the infusion pump was started (5 minutes per exposed site, 3 minutes for realignment with the next site, and 2 sites per rat = 13 minutes). Both exposures were completed before the infusion pump was stopped such that the Definity solution was present during each 5-minute exposure.
The saline infusion groups received the same treatment but without UCA addition, and the contralateral limbs served as the sham group, which received no US exposure.
Euthanization
Rats were euthanized on their respective assessment days using carbon dioxide asphyxiation followed by cervical dislocation with prompt removal of exposed regions via a 6-mm biopsy punch.
Tissue Preparation and Processing
One exposed location was snap frozen in liquid nitrogen and the other formalin-fixed in 10% phosphate-buffered saline–formalin (Fisher Scientific, Pittsburgh, PA) for a maximum of 24 hours. The formalin-fixed tissues were then paraffin embedded (Fisher Scientific). Three-micrometer-thick sections were stained with hematoxylineosin for whole-tissue examination and CD-31 antibody (1A10; Cell Marque, Rocklin, CA) for capillary density counts and inflammation assessments.
Capillary Density Assessment
For each exposed site, the following slides were created: hematoxylin-eosin, CD-31, and CD-31 negative control. A CD-31–positive control was made for a batch of slides. CD-31 slides were used for capillary density counting according to techniques detailed in previously published literature.24 Only full lumen capillaries were counted. An Axioscope 2 upright light microscope (Carl Zeiss Microscopy, Thornwood, NY) had a high-power field of 0.45 mm in diameter at 40× magnification. Fifteen high-power fields were averaged and reported as capillaries per square millimeter ± SEM.
Inflammatory Cell Assessment
All slides were placed in a digital slide scanner (NanoZoomer Virtual Microscopy, NanoZoomer Digital Pathology; Hamamatsu, Bridgewater, NJ) to create digital images of the stained sections. Then, a MATLAB (The MathWorks, Natick, MA) routine was used to quantify the presence of a brown stain indicative of inflammatory cells marked by CD-31 according to techniques previously used.24
Vascular Endothelial Growth Factor Analysis
The snap frozen section was used for VEGF analysis. First, total RNA was isolated using an RNeasy kit (Qiagen, Valencia, CA). The procedure used was a standard protocol.29 Then the optical density of the solution was read using a Nanodrop 2000 Spectrophotometer (Thermo Scientific, Wilmington, DE). The RNA was labeled and stored at −80°C. After isolation, the RNA was reverse transcribed to complementary DNA.
A real-time polymerase chain reaction was run on the cDNA (Platinum Q polymerase chain reaction package insert) with an ABI Prism 7500 genetic analyzer (Applied Biosystems, Foster City, CA) using a TaqMan 1-step reverse transcription–polymerase chain reaction master mix reagent kit (Applied Biosystems) according to the manufacturer’s recommendation. Real-time reactions were carried out using pooled RNA samples for both 18S RNA and VEGF-A RNA. The VEGF primer was designed with the forward sequence: CCACTTCATGGGCTTTCTGCT, and reverse sequence: CACTTGTACCTCCACCATGCCAAG. Values for VEGF were normalized to values obtained for 18S RNA in each sample, and data were expressed relative to normalized values for controls.
Statistical Analysis
N-way analysis of variance in MATLAB was used to determine if the main effects of Pr or DPE were statistically significant for each of the measured end points (eg, capillary density, inflammation, and VEGF). The level of significance was set at α = .05. Multiple comparisons using the Tukey-Kramer method were used to compare infusion media, pressure groups, and assessment days. The sham (0-MPa exposure) and cage control were not statistically different. Therefore, to reduce the number of analyses and increase statistical power, the sham and cage control were combined and are displayed as simply the control.
Results
Capillary Density
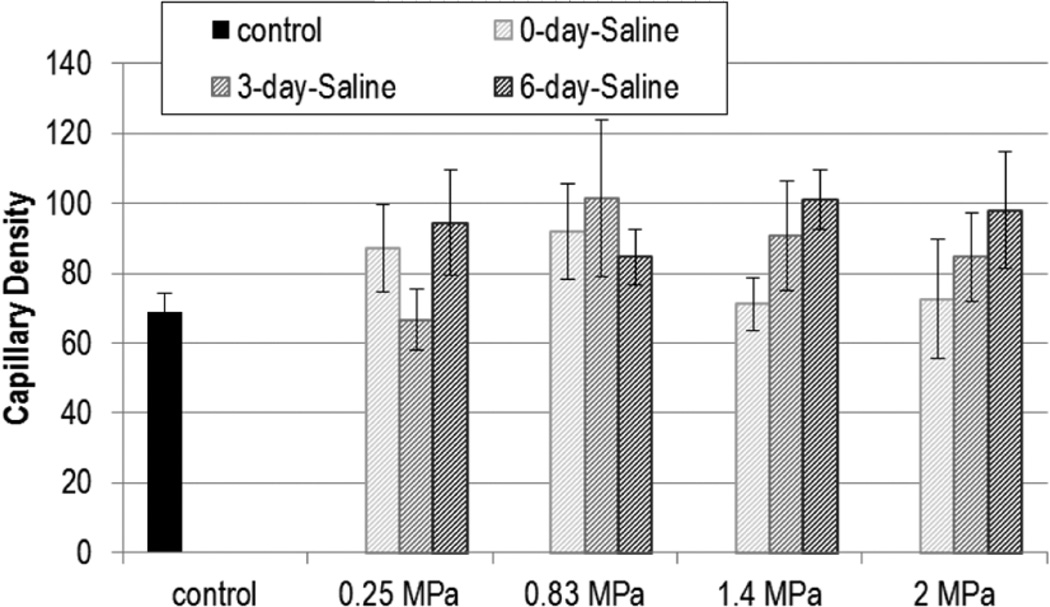
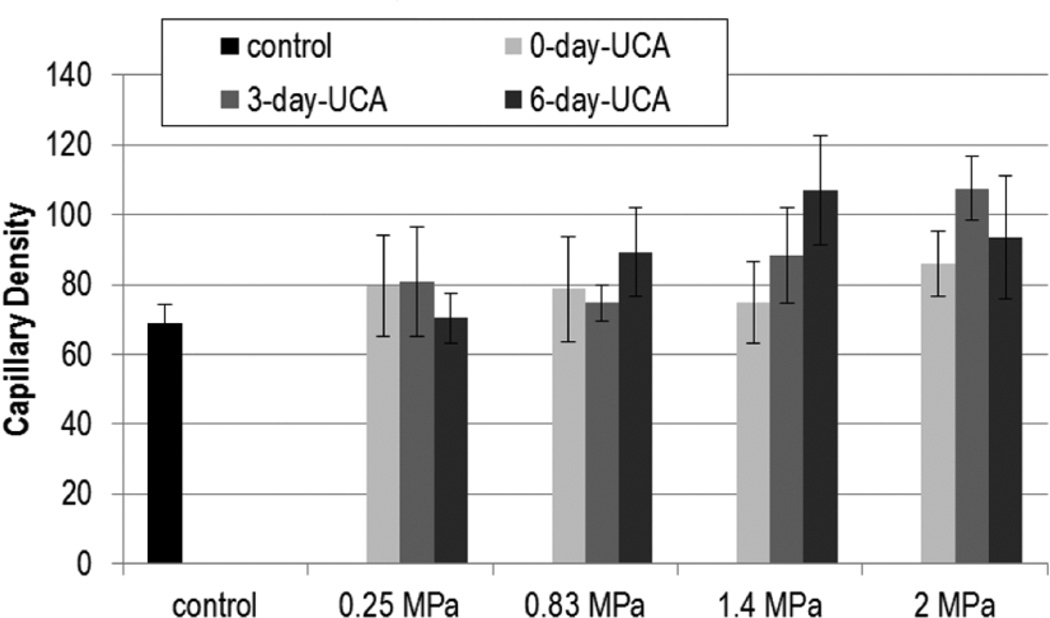
Figures 1 and 2 show the capillary density with US exposure for 0.25, 0.83, 1.4, and 2.0 MPa at 0, 3, and 6 DPE for saline and UCA infusion, respectively. Statistical significance was not found with Pr or DPE for capillary density.
Figure 1.
Capillary density (capillaries/mm2) for exposures: saline. The stripes darken as days post exposure (DPE) increase, with 0 DPE in light gray stripes and 6 DPE in dark grey stripes. Error bars denote SEM.
Figure 2.
Capillary density (capillaries/mm2) for exposures: ultrasound contrast agent (UCA). The solid gray color darkens as days post exposure (DPE) increase, with 0 DPE in light gray and 6 DPE in dark gray. Error bars denote SEM.
Inflammation
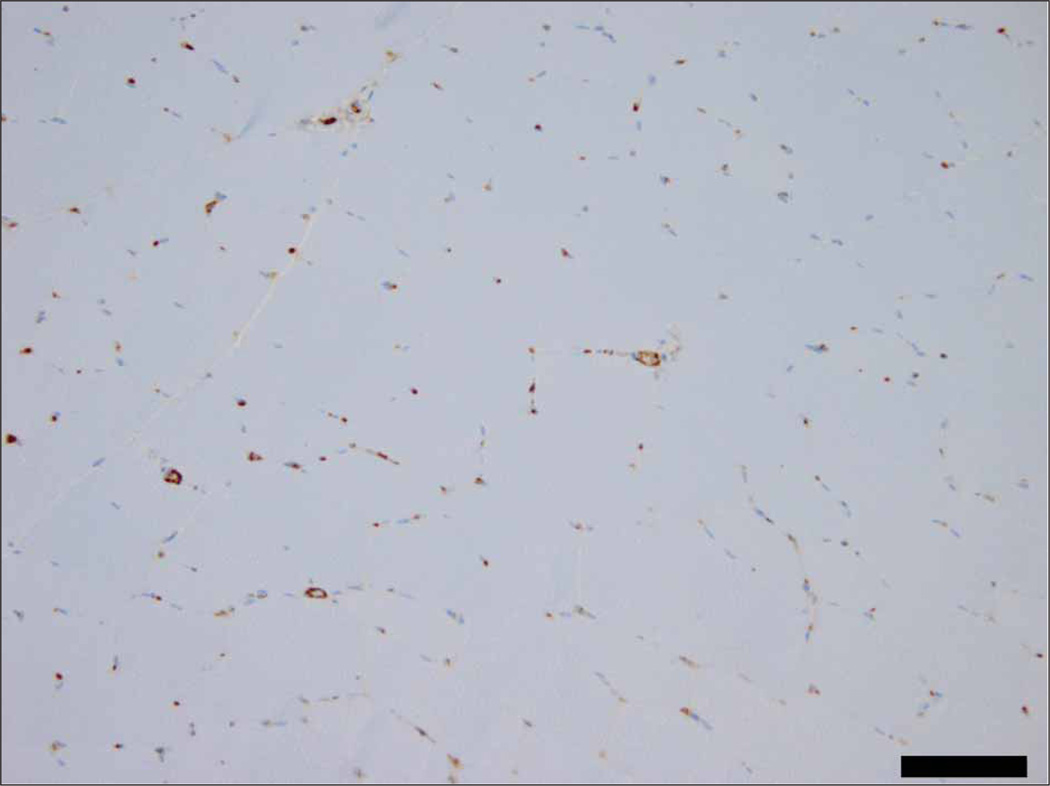
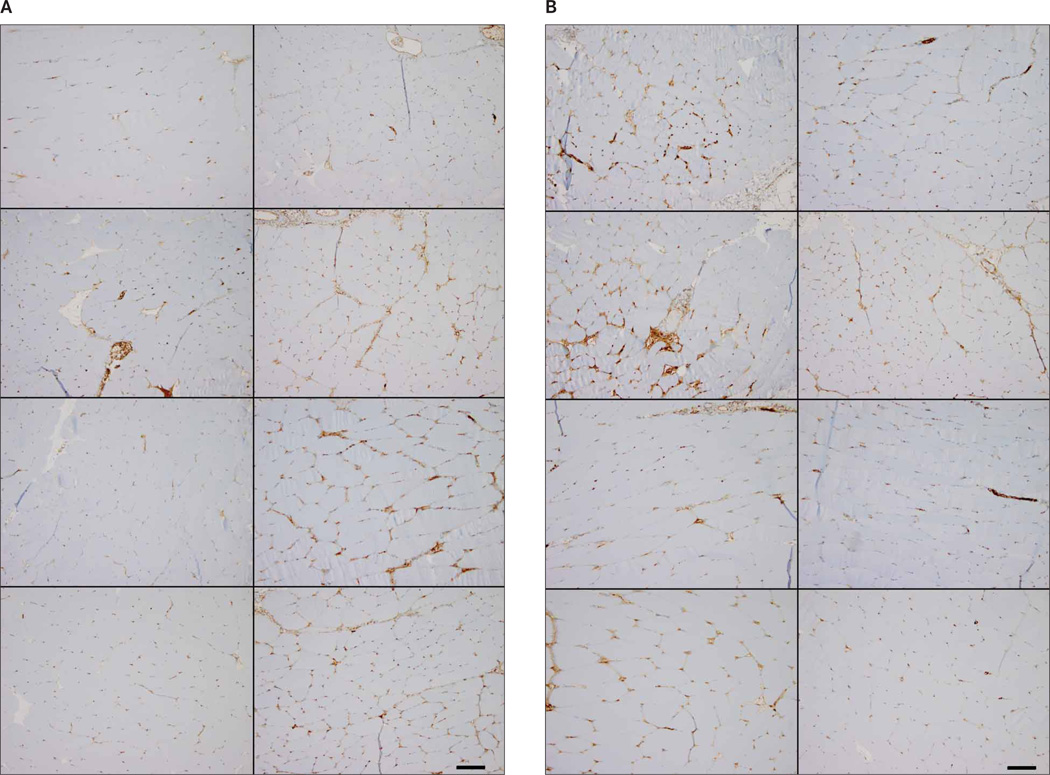
Representative immunohistochemistry images of inflammation are shown in Figures 3 and 4. Figure 3 demonstrates the control level of inflammation seen with CD-31 staining. In Figure 4A, acute inflammation (0 DPE) images representing 0.25 to 2.0 MPa show minimal variation for saline and UCA infusion (Figure 4B). Figure 4, A and B, also displays immunohistochemistry staining at 6 DPE for saline and UCA.
Figure 3.
Representative image of the control CD-31–stained slide. Scale bar denotes 100 µm.
Figure 4.
Representative images of exposed CD-31–stained slides. A, Saline, B, Ultrasound contrast agent. Zero-days post exposure (DPE) groups are shown in the left column with increasing Pr. Top left to bottom left are 0.25, 0.83, 1.4, and 2.0 MPa, respectively. The 6-DPE counterparts are in the right column. Top right to bottom right are 0.25, 0.83, 1.4, and 2.0 MPa, respectively. Scale bars denote 100 µm.
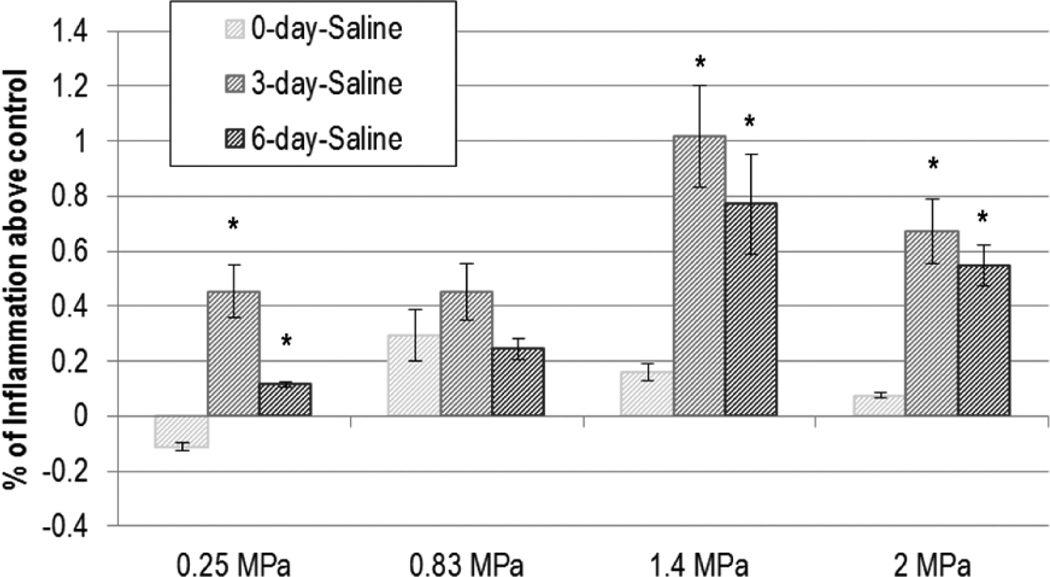
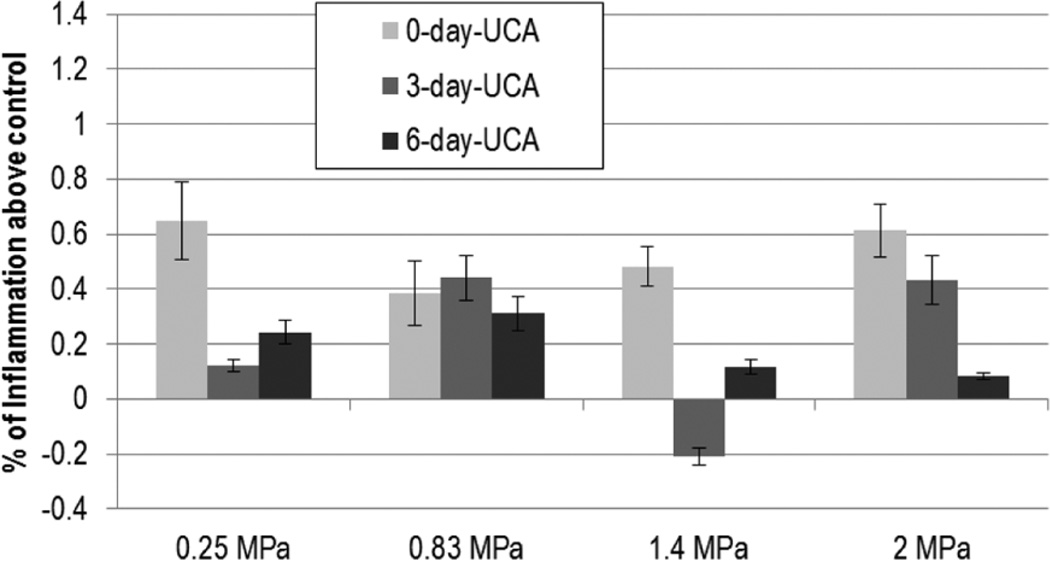
Inflammation did not demonstrate a trend across Pr for either UCA- or saline-infused groups (Figures 5 and 6); DPE was found to be significant in the saline-infused group only. The inflammation at 3 DPE was found to be significantly higher than 0 DPE for all but 0.83 MPa (P < .02); however analysis of variance revealed that the 3- and 6-DPE groups did not differ.
Figure 5.
Saline: normalized inflammation. The stripes darken as days post exposure (DPE) increase, with 0 DPE in light gray stripes and 6 DPE in dark gray stripes. Error bars denote SEM. *P < .02 with respect to 0 DPE.
Figure 6.
Ultrasound contrast agent: normalized inflammation. The solid gray color darkens as days post exposure (DPE) increase, with 0 DPE in light gray and 6 DPE in dark gray. Error bars denote SEM.
Vascular Endothelial Growth Factor
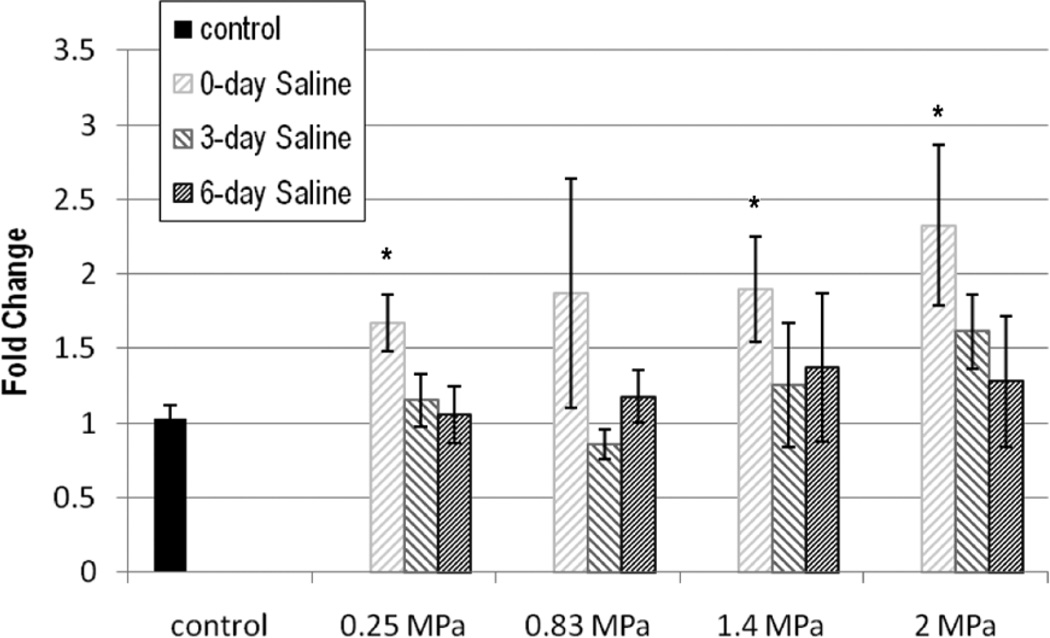
Vascular endothelial growth factor expression is shown in Figures 7 and 8 in terms of fold change. With saline, DPE was significant for VEGF (P < .001). The 0-DPE mean value of VEGF increased with pressure for all but 0.83 MPa with respect to the control, but neither 3 nor 6 DPE were significantly different from the control.
Figure 7.
Vascular endothelial growth factor (VEGF) expression in fold change: saline. The stripes darken as days post exposure (DPE) increase, with 0 DPE in light gray stripes and 6 DPE in dark gray stripes. Error bars denote SEM. *P < .01 with respect to the control.
Figure 8.
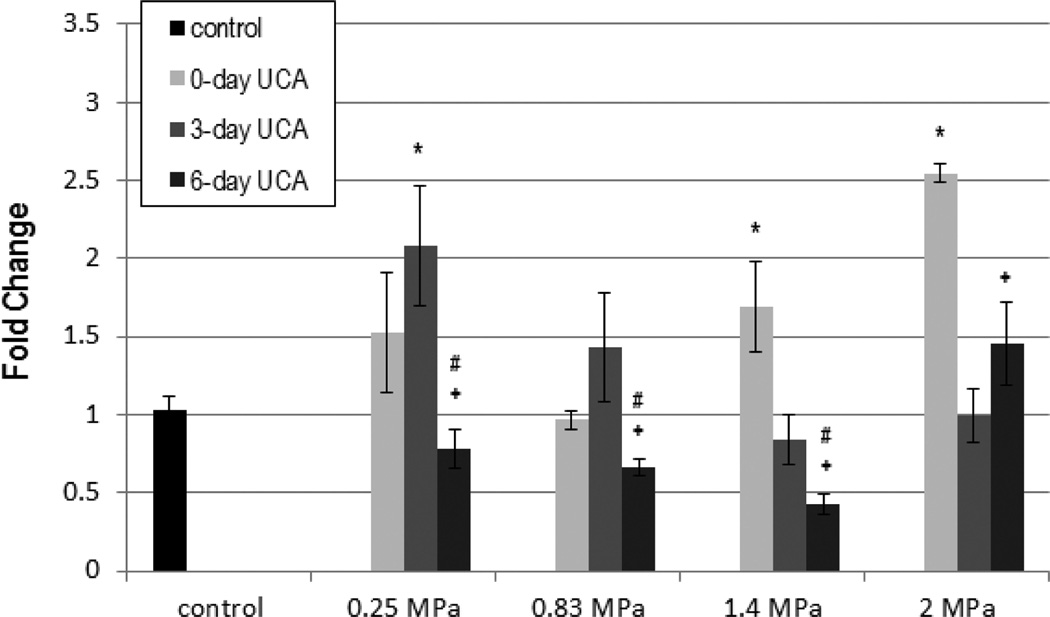
Vascular endothelial growth factor (VEGF) expression in fold change: ultrasound contrast agent (UCA). The solid gray color darkens as days post exposure (DPE) increase, with 0 DPE in light gray and 6 DPE in dark gray. Error bars denote SEM. *P < .01 with respect to the control; +P < .001 with respect to 0 DPE; #P < .001 with respect to 3 DPE.
Both Pr and DPE main effects were significant for VEGF when the UCA was used (P < .01; P < .001, respectively). Multiple comparisons showed that acutely 1.4 and 2.0 MPa, and 0.25 MPa at 3 DPE were significantly different from the control, indicating a pressure dependency (Figure 8). Six DPE was also found to be significantly lower than 0 and 3 DPE for all but 2.0 MPa, whereas 3 DPE was not statistically different from 6 DPE.
Discussion
The intent herein was to ensure that excessive damage did not occur acutely, but also to elicit an angiogenic response such that the mechanism could be explored. With information concerning the mechanism of US-induced angiogenesis, current treatments can be improved, optimized, or assessed for use in a particular situation.
This study used a range of pressures and three measurements (capillary density, inflammation, and VEGF) to explore if US and/or US-UCA interactions could be used to induce an angiogenic effect. Inflammation and capillary density at 0 DPE were measured to ensure that excessive damage did not occur acutely. Further, inflammation (0 DPE) was explored as a possible potentiator of the angiogenic response. There was no acute reduction in capillary density with respect to the control. Inflammation, however, did increase with respect to 0 DPE for the saline group for all Prs except 0.83 MPa. The maximal increase seen for inflammation was approximately 1%. Biologically, this increase is not large enough to place inflammation outside normal limits, which suggests that inflammation induced by US-UCAs is not occurring in excess (ie, minimal damage). Because the increase is biologically insignificant, it is uncertain whether or not inflammation is potentiating the angiogenic response.
The angiogenic effect was measured with both capillary density at 3 and 6 DPE and VEGF at 0, 3, and 6 DPE. These assessments, however, seemingly supported two opposing conclusions. Capillary density showed no statistical significance across infusion media, Pr, or DPE, while VEGF was found to be dependent on infusion media, incident Pr, and DPE. Capillary density was chosen as an end point because the literature suggests that capillaries increase by approximately 33% (with respect to their control) after exposure to US and UCAs at 3 to 7 days.9 In this study, 33% and greater increases are seen with respect to the control at 3 or 6 DPE, but the effects are not seen due to the factorial nature of the design. Vascular endothelial growth factor is a well-known and studied marker of angiogenesis; therefore, it was assessed as a secondary measurement. Vascular endothelial growth factor showed no significant change across Pr when saline was used; however, when the UCA was introduced, VEGF became significant across Pr and DPE. Because VEGF increases, the data suggest that there was, indeed, an angiogenic response. The data also suggest that collapse of the UCA resulted in higher acute VEGF expression.
It was expected that as Pr increased, the acute capillary density, inflammation, and VEGF would decrease, and there would be a subsequent rebound as DPE increased, as seen in previous findings.24 Literature supports that there is possibly a range of Prs that may result in beneficial therapy. Ultrasound pressures ranging from 0.18 to 1.8 MPa (1 MHz) have been used to stimulate healing in varicose ulcers, induce angiogenesis, and treat ischemia both with and without the use of UCAs.5–7,9,12,30,31
Ultrasound Bioeffects
It is generally assumed that the benefits of US are damage induced—as a result of inertial cavitation or cellular changes via mechanical perturbation.12,18,24,32 These effects may or may not result in tissue level damage. Research shows that US induces petechiae in vivo without tissue destruction.14,33 The saline-infused group was used to assess US bioeffects. A rise in VEGF and inflammation was expected to occur prior to any increase in capillary density, as seen in the literature.9,34,35 Analysis of this study agreed with VEGF appearing with exposure to US and inflammation increasing above the control. Ultrasound caused inflammation that demonstrated an onset peaking at 3 DPE. The 3-DPE peak of inflammation was not unexpected as angiogenesis is known to involve both early- and late-stage inflammation.34
Ultrasound Contrast Agents
Ultrasound contrast agents increase the potential for damage by introducing cavitational bodies intravascularly. While the general progression of angiogenesis was similar, the UCA group demonstrated significant differences from the saline group. With UCAs, inflammation is detected acutely, possibly due to the increased level of vascular perturbation, but does not vary with Pr or DPE. One reason for this counterintuitive response might be the UCA concentration chosen. For therapeutic applications, typically, UCA concentrations have exceeded the standard recommendations for imaging.9,12,19 However, literature involving UCAs use concentrations ranging from 0% to 60% of the solution consisting of microbubbles. To prevent excess damage, this study used a relatively low UCA concentration (≈35%).
Interestingly, when UCAs are used, Pr is one of the most relevant parameters. Ultrasound contrast agent behavior has been documented for its dependence on Pr. Ultrasound contrast agents progress from oscillation to collapse with increasing Pr. This laboratory, in separate in vitro experiments, characterized the collapse threshold of Definity with a 1-MHz transducer. This threshold reaches the 5% occurrence level at approximately 0.25 MPa.21 The occurrence rises to 50% at approximately 0.5 MPa, and 100% of bubbles exposed to US collapse at about 1.25 MPa with oscillation co-occurrence.21 Thus, the range of Prs chosen was from 5% to 100% collapse occurrence with exposure to US.
In this study, 0.25 MPa is representative of a predominantly oscillation-inducing pressure. As Pr increases, UCAs slowly expand and rapidly contract, resulting in collapse and shell fragmentation (Pr = 0.83, 1.4, and 2.0 MPa). This collapse potentially damages the vascular endothelium and surrounding tissue. In this study, there was no decrease in acute capillary density as seen previously, 24 signifying that the vascular endothelium was not ruptured. These data show that the presence of UCAs causes a change in the VEGF expression possibly due to continual local hemodynamic disturbance from oscillation (Figure 8). As Pr increases, collapse eliminates the constant oscillatory disturbance in the US beam focus, but infusion replenishes the UCAs. While locally circulating red blood cells may be damaged, the vessel lumen remains intact, as seen in Figures 1 and 2, suggesting a mechanical dependence of VEGF stimulation, not vascular or tissue damage (Figure 8). Although inflammation did increase at 3 DPE for the saline group, suggesting some level of perturbation to the vascular endothelium and/or exposed muscle, this effect did not reach significance when the UCA was used, indicating again that the angiogenic response is influenced by the presence of UCAs. Interestingly the 0.83-MPa setting for inflammation and VEGF saline groups displays a trend across DPE that differs from the other Pr settings, resulting in insignificance, for which the reason is not understood at this time. A similar occurrence is noticed with the 2.0-MPa setting for VEGF when UCAs are used, which may be due to the involvement of collapse. More work needs to be conducted to fully understand if/to what extent collapse and Pr influences the response.
Ultrasound-UCA–Induced Angiogenesis
The expression of VEGF was demonstrated to occur in vitro3 and in vivo5 after exposure to US, which agrees with the findings in this study. One of the proposed mechanisms underlying US exposure and vascular growth relates to the induction of local hypoxia and inducing VEGF expression. 5 This reinforces the possibility of the mechanical effect inducing VEGF. Ultrasound and UCAs seem to disturb the normal state, and this disturbance caused an increase in VEGF in both this study and others.5,9 This study displayed higher fold changes in VEGF for all pressures explored when compared to previous findings in an ischemic model.5
Heating as a Possible Mechanism
Ultrasound-induced heating has also been documented to provide some therapeutic benefit.36 The maximum change in temperature can be approximated with ΔTmax = (Q̇ Δt)/Cv, where Δt is the exposure duration (for a single pulse, exposure duration is 10 microseconds); Cv is the medium’s heat capacity per unit volume (4.18 J/cm3-°C for biological tissue); and Q̇ is the rate of heat generation per unit volume.37–39 For this study, ΔTmax was calculated to be 0.95°C for the 2.0-MPa exposure. This approximation assumes no heat removal, which is not necessarily the case for a 5-minute exposure. Further, thermal therapy frequently requires repeated exposures of continuous US,36,40 whereas 1-time pulsed US was used herein. Thus, it is reasonable to assume that heating is not a significant biophysical mechanism for the results noted herein.
Previously published work conducted in this laboratory used the same UCA concentration but a pressure that was approximately double the maximum Pr used in this study.24 Unlike the damage seen in previous work, this study supports the idea that a mechanical effect elicits the angiogenic response. When UCAs are introduced, two profiles change: inflammation and VEGF; VEGF seems to have some correspondence to the occurrence of collapse, whereas the mere presence of UCAs changes the inflammation profile.
It should be noted that the literature has, to date, reported only effects seen days after treatment, with no investigation of connections between exposure and angiogenesis. If we remove 0 and 3 DPE from this data set, we find that capillary density and inflammation are statistically different from the control for all measured end points. This result would then support the effects reported by Chappell et al.9 The effect seen in this study raises mechanistic questions for other US-UCA–induced angiogenesis studies. Further work regarding US-UCA–induced angiogenesis needs to be done to fully characterize the mechanism such that current therapeutic parameters can be selected for a desired result.
Limitations
The objective of this study was to assess mechanisms; how well the treatment is received in ischemic situations was not explored. Ischemic models have been explored and shown to be effective by other groups.11,19
A normal animal model was used, which could likely be more resilient to drastic changes in capillary density until sufficiently high Prs are met. There is also a potential for UCA concentration dependence.
Conclusions
Ultrasound exposure has the potential to stimulate an angiogenic response. When UCAs are added, the progression of the response is disturbed, particularly when collapse occurs. These results suggest that a mechanical effect of US-UCAs elicits angiogenesis via inflammation and increased VEGF expression.
Acknowledgments
This work was funded in part by National Institutes of Health grant R37 EB002641 and National Institutes of Health fellowship F31 HL097653-01 (C.A.J.).
Abbreviations
- DPE
days post exposure
- Pr
peak rarefactional pressure
- UCA
ultrasound contrast agent
- US
ultrasound
- VEGF
vascular endothelial growth factor
References
- 1.Lloyd-Jones D, Adams R, Carnethon M, et al. Heart Disease and stroke statistics—2009 update: a report from the American Heart Association Statistics Committee and Stroke Statistics Subcommittee. Circulation. 2009;119:e21–e181. doi: 10.1161/CIRCULATIONAHA.108.191261. [DOI] [PubMed] [Google Scholar]
- 2.Rantanen J, Thorsson O, Wollmer P, Hurme T, Kalimo H. Effects of therapeutic ultrasound on the regeneration of skeletal myofibers after experimental muscle injury. Am J Sports Med. 1999;27:54–59. doi: 10.1177/03635465990270011701. [DOI] [PubMed] [Google Scholar]
- 3.Reher P, Doan N, Bradnock B, Meghji S, Harris M. Effect of ultrasound on the production of IL-8, basic FGF and VEGF. Cytokine. 1999;11:416–423. doi: 10.1006/cyto.1998.0444. [DOI] [PubMed] [Google Scholar]
- 4.Young SR, Dyson M. The effect of therapeutic ultrasound on angiogenesis. Ultrasound Med Biol. 1990;16:261–269. doi: 10.1016/0301-5629(90)90005-w. [DOI] [PubMed] [Google Scholar]
- 5.Barzelai S, Sharabani-Yosef O, Holbova R, et al. Low-intensity ultrasound induces angiogenesis in rat hind limb ischemia. Ultrasound Med Biol. 2006;32:139–145. doi: 10.1016/j.ultrasmedbio.2005.08.010. [DOI] [PubMed] [Google Scholar]
- 6.Korpanty G, Grayburn PA, Shohet RV, Brekken RA. Targeting vascular endothelium with avidin microbubbles. Ultrasound Med Biol. 2005;31:1279–1283. doi: 10.1016/j.ultrasmedbio.2005.06.001. [DOI] [PubMed] [Google Scholar]
- 7.Zen K, Okigaki M, Hosokawa Y, et al. Myocardium-targeted delivery of endothelial progenitor cells by ultrasound mediated microbubble destruction improves cardiac function via an angiogenic response. J Mol Cell Cardiol. 2006;40:799–809. doi: 10.1016/j.yjmcc.2006.03.012. [DOI] [PubMed] [Google Scholar]
- 8.Song X, Zhu H, Jin L, et al. Ultrasound-mediated microbubble destruction enhances the efficacy of bone marrow mesenchymal stem cell transplantation and cardiac function. Clin Exp Pharmacol Physiol. 2008;36:267–271. doi: 10.1111/j.1440-1681.2008.05049.x. [DOI] [PubMed] [Google Scholar]
- 9.Chappell JC, Kilbanov AL, Price RJ. Ultrasound-microbubble-induced neovascularization in mouse skeletal muscle. Ultrasound Med Biol. 2005;31:1411–1422. doi: 10.1016/j.ultrasmedbio.2005.06.010. [DOI] [PubMed] [Google Scholar]
- 10.Miyake Y, Ohmori K, Yoshida J, et al. Granulocyte colony-stimulating factor facilitates the angiogenesis induced by ultrasonic microbubble destruction. Ultrasound Med Biol. 2007;33:1796–1804. doi: 10.1016/j.ultrasmedbio.2007.05.017. [DOI] [PubMed] [Google Scholar]
- 11.Song J, Cottler PS, Klibanov AL, Kaul S, Price RJ. Microvascular remodeling and accelerated hyperemia blood flow restoration in arterially occluded skeletal muscle exposed to ultrasonic microbubble destruction. Am J Physiol Heart Circ Physiol. 2004;287:H2754–H2761. doi: 10.1152/ajpheart.00144.2004. [DOI] [PubMed] [Google Scholar]
- 12.Chappell JC, Song J, Kilbanov AL, Price RJ. Ultrasonic microbubble destruction stimulates therapeutic artiogenesis via the CD18-dependent recruitment of bone marrow-derived cells. Arterioscler Thromb Vasc Biol. 2008;28:1117–1122. doi: 10.1161/ATVBAHA.108.165589. [DOI] [PubMed] [Google Scholar]
- 13.MacRobbie AG, Raeman CH, Child SZ, Dalecki D. Thresholds for premature contractions in murine hearts exposed to pulsed ultrasound. Ultrasound Med Biol. 1997;23:761–765. doi: 10.1016/s0301-5629(97)00049-5. [DOI] [PubMed] [Google Scholar]
- 14.Miller DL, Gies RA. Gas-body-based contrast agent enhances vascular bioeffects of 1.09 MHz ultrasound on mouse intestine. Ultrasound Med Biol. 1998;24:1201–1208. doi: 10.1016/s0301-5629(98)00063-5. [DOI] [PubMed] [Google Scholar]
- 15.Bigelow TA, Miller RJ, Blue JP, O’Brien WD., Jr Hemorrhage near fetal rat bone exposed to pulsed ultrasound. Ultrasound Med Biol. 2007;33:311–317. doi: 10.1016/j.ultrasmedbio.2006.08.015. [DOI] [PubMed] [Google Scholar]
- 16.Skyba DM, Price RJ, Linka AZ, Sklak TC, Kaul S. Direct in vivo visualization of intravascular destruction of microbubbles by ultrasound and its local effects on tissue. Circulation. 1998;98:290–293. doi: 10.1161/01.cir.98.4.290. [DOI] [PubMed] [Google Scholar]
- 17.Zachary JF, Blue Jr, Miller RJ, Ricconi BJ, Eden JG, O’Brien WD., Jr Lesions of ultrasound-induced lung hemorrhage are not consistent with thermal injury. Ultrasound Med Biol. 2006;32:1763–1770. doi: 10.1016/j.ultrasmedbio.2006.06.012. [DOI] [PMC free article] [PubMed] [Google Scholar]
- 18.Leong-Poi H, Kuliszowski MA, Lekas M, et al. Therapeutic artiogenesis by ultrasound-mediated VEGF165 plasmid gene delivery to chronically ischemic skeletal muscle. Circ Res. 2007;101:295–303. doi: 10.1161/CIRCRESAHA.107.148676. [DOI] [PubMed] [Google Scholar]
- 19.Fuji H, Sun Z, Li S, et al. Ultrasound-targeted gene delivery induced angiogenesis after a myocardial infarction in mice. JACC Cardiovasc Imaging. 2009;7:869–879. doi: 10.1016/j.jcmg.2009.04.008. [DOI] [PubMed] [Google Scholar]
- 20.Ammi AY, Cleveland RO, Mamou J, Wang GI, Bridal SL, O’Brien WD., Jr Ultrasonic contrast agent shell rupture detected by inertial cavitation and rebound signals. IEEE Trans Ultrason Ferroelectr Freq Control. 2006;53:126–136. doi: 10.1109/tuffc.2006.1588398. [DOI] [PMC free article] [PubMed] [Google Scholar]
- 21.King DA, Malloy MJ, Roberts AC, Haak A, Yoder CC, O’Brien WD., Jr Determination of postexcitation thresholds for single ultrasound contrast agent microbubbles using double passive cavitation detection. J Acoust Soc Am. 2010;127:3449–3455. doi: 10.1121/1.3373405. [DOI] [PMC free article] [PubMed] [Google Scholar]
- 22.Nyborg WL. Acoustic streaming near a boundary. J Acoust Soc Am. 1958;30:329–339. [Google Scholar]
- 23.Elder SA. Cavitation microstreaming. J Acoust Soc Am. 1959;31:54–64. [Google Scholar]
- 24.Johnson CA, Sarwate S, Miller RJ, O’Brien WD., Jr A temporal study of ultrasound contrast agent-induced changes in capillary density. J Ultrasound Med. 2010;29:1267–1275. doi: 10.7863/jum.2010.29.9.1267. [DOI] [PMC free article] [PubMed] [Google Scholar]
- 25.American Institute of Ultrasound in Medicine, National Electrical Manufacturers Association. Acoustic Output Measurement Standard for Diagnostic Ultrasound Equipment. Laurel, MD: American Institute of Ultrasound in Medicine; Rosslyn, VA: National Electrical Manufacturers Association; 1998. [Google Scholar]
- 26.American Institute of Ultrasound in Medicine, National Electrical Manufacturers Association. Standard for the Real-Time Display of Thermal and Mechanical Acoustic Output Indices on Diagnostic Ultrasound Equipment. Rev 1. Laurel, MD: American Institute of Ultrasound in Medicine; Rosslyn, VA: National Electrical Manufacturers Association; 1998. [Google Scholar]
- 27.Sempsrott JM, O’Brien WD., Jr . Proceedings of the 1999 IEEE Ultrasonics Symposium. Piscataway, NJ: Institute of Electrical and Electronics Engineers; 1999. Experimental verification of acoustic saturation; pp. 1287–1290. [Google Scholar]
- 28.Riederer-Henderson MA, Olerud JE, O’Brien WD, Jr, et al. Biochemical and acoustical parameters of normal canine skin. IEEE Trans Biomed Eng. 1988;35:967–972. doi: 10.1109/10.8678. [DOI] [PubMed] [Google Scholar]
- 29.Qiagen GmbH. RNeasy Mini Handbook. 4th ed. Hilden, Germany: Qiagen GmbH; 2006. [Google Scholar]
- 30.Dyson M, Franks C, Suckling J. Stimulation of healing varicose ulcers by ultrasound. Ultrasonics. 1976;14:232–236. doi: 10.1016/0041-624x(76)90024-x. [DOI] [PubMed] [Google Scholar]
- 31.Hogan RD, Burke KM, Franklin TD. The effect of ultrasound on microvascular hemodynamics in skeletal muscle: effects during ischemia. Microvasc Res. 1982;23:370–379. doi: 10.1016/s0026-2862(82)80009-5. [DOI] [PubMed] [Google Scholar]
- 32.Gormley G, Wu J. Acoustic streaming near Albunex spheres. J Acoust Soc Am. 1998;104:3115–3118. [Google Scholar]
- 33.Nyborg WL, Carson PL, Miller MW, et al. Exposure Criteria for Medical Diagnostic Ultrasound, I: Criteria Based on Thermal Mechanisms. NCRP report No. 113. Bethesda, MD: National Council on Radiation Protection and Measurements; 1992. [Google Scholar]
- 34.Bates DO, Pritchard-Jones RO. The role of vascular endothelial growth factor in wound healing. Int J Low Extrem Wounds. 2003;2:107–120. doi: 10.1177/1534734603256626. [DOI] [PubMed] [Google Scholar]
- 35.Mariotti M, Maier J, editors. New Frontiers in Angiogenesis. Dordrecht, the Netherlands: Springer; 2006. Angiogenesis: an overview; pp. 2–4. [Google Scholar]
- 36.Draper DO, Mahaffey C, Kaiser D, Eggett D, Jarmin J. Thermal ultrasound decreases tissue stiffness of trigger points in upper trapezius muscles. Physiother Theory Pract. 2010;26:167–172. doi: 10.3109/09593980903423079. [DOI] [PubMed] [Google Scholar]
- 37.Fry WJ, Fry RB. Temperature changes produced in tissue during ultrasonic irradiation. J Acoust Soc Am. 1953;25:6–11. [Google Scholar]
- 38.Cavicchi TJ, O’Brien WD., Jr Heat generated by ultrasound in an absorbing medium. J Acoust Soc Am. 1984;76:1244–1245. doi: 10.1121/1.391374. [DOI] [PubMed] [Google Scholar]
- 39.O’Brien WD., Jr Ultrasound biophysics mechanisms. Prog Biophys Mol Biol. 2007;93:212–255. doi: 10.1016/j.pbiomolbio.2006.07.010. [DOI] [PMC free article] [PubMed] [Google Scholar]
- 40.Usuba M, Miyanaga Y, Miyakawa S, Maeshima T, Shiraski Y. Effect of heat increasing the range of knee motion after the development of a joint contracture: an experiment with an animal model. Arch Phys Med Rehabil. 2006;87:247–253. doi: 10.1016/j.apmr.2005.10.015. [DOI] [PubMed] [Google Scholar]


