

Abstract
2-Oxoglutarate and Fe(II) dependent oxygenases are a major class of Nε-methyl lysine demethylases that are involved in epigenetic regulation. Assays suitable for implementation in a high-throughput manner have been lacking for these enzymes. Here, we describe the design and implementation of a robust and miniaturized high-throughput kinetic assay for inhibitors of JMJD2E using a formaldehyde dehydrogenase-coupled reaction with real-time fluorescence detection. Reactant compatibility studies resulted in simplification of the assay scheme to the mixing of two reagent solutions, both of which were stable overnight. The assay was miniaturized to a 4 μL volume in 1,536-well format and was used to screen the Library of Pharmacologically Active Compounds (LOPAC1280). Inhibitors identified by the screen were further characterized in secondary assays including FDH counterscreen and demethylation assays that monitored demethylation by MALDI-TOF MS. The assay developed here will enable the screening of large compound libraries against the Jumonji demethylases in a robust and automated fashion.
INTRODUCTION
Histone methylation influences genetic processes including heterochromatin formation, X-chromosome inactivation, genomic imprinting, transcriptional regulation and DNA repair 1. Although once thought to be an irreversible modification, it is now clear that histone lysine Nε-methylation is a dynamic process. Both histone methyltransferases and histone demethylases have been implicated in biomedically important pathophysiological processes, which include effects on embryonic stem cell differentiation, development and tumorigenesis 2. The histone demethylase JMJD2C, which catalyses the demethylation of trimethyl lysine 9 of histone H3 (H3K9me3), has been shown to associate with the androgen receptor (AR), facilitating AR-dependent transcription. Knockdown of JMJD2C by siRNA inhibited demethylation of H3K9me3 and reduced androgen-dependent cell proliferation of prostate cancer cells 3, suggesting that the JMJD2 demethylase family may be therapeutic targets.
The largest set of histone demethylases belongs to the Fe(II) and 2-oxoglutarate oxygenase (2OG) superfamily. The catalytic cycle of 2OG oxygenases involves sequential binding of 2OG, substrate and, finally, binding of molecular oxygen to the single Fe(II) at the active site 4; oxidation/decarboxylation of 2OG then generates an active Fe(IV)=O species, which reacts to hydroxylate substrates, likely by insertion of oxygen into C-H bonds 5, 6. Other than the histone lysine demethylases, known human 2OG oxygenases include prolyl hydroxylases (involved in collagen biosynthesis and the hypoxic response), DNA demethylases, lysyl hydroxylases (collagen biosynthesis), and enzymes involved in fatty acid metabolism 7.
A few 2OG oxygenases, and in particular the collagen prolyl-4-hydroxylases, have been previously targeted for inhibition, particularly in the treatment of liver fibrosis 8, 9. More recently, inhibitors have also been reported for the hypoxic-response oxygenases PHD2 10, 11 and FIH 12, 13, and the DNA demethylase AlkB 14. Inhibitors of the GA 20-oxygenase involved in gibberellin biosynthesis in plants have found application in agriculture as plant growth retardants 15. However, the multiplicity of histone-modifying enzymes (and the post-translational modifications that they catalyze) means that defining the biological roles of individual enzymes and modifications/combinations of modifications is challenging. One approach to this problem is to identify small molecules that selectively inhibit individual histone-modifying enzymes/enzyme subfamilies. Here we describe the first high-throughput assays for a histone demethylase subfamily, which will be useful for the development of small molecule functional probes for this purpose. Notable examples of small molecules that target epigenetic enzymes include the histone deacetylase-1 inhibitor suberoylanilide hydroxamic acid (SAHA)16 and a histone methyltransferase G9a inhibitor 17, 18.
To our knowledge, no large-scale high-throughput screen for inhibitors of the 2OG dependent histone demethylases has been reported. The high level of sequence similarity among the JMJD2 demethylases, together with the high relative levels of stability and activity of recombinant JMJD2E (in comparison with the other JMJD2 enzymes), led to the selection of JMJD2E as a model enzyme suitable for inhibition studies on the JMJD2 family 19. Kinetic assays based on detection of the formaldehyde co-product have been reported for JMJD2A and JMJD2E19, 20. These assays enabled the identification of selected inhibitor scaffolds for JMJD2E, with starting points being based on known inhibitors of the Fe(II)/2OG oxygenases, or on structural similarity to 2OG. Reported JMJD2E inhibitors included pyridine-dicarboxylic acids and N-oxalylamino acids19. Interestingly, the identified inhibitors also included hydroxamic acid-type HDAC inhibitors, including trichostatin A (TSA) and suberoylanilide hydroxamic acid (SAHA), which is currently in clinical use for the treatment of cutaneous T-cell lymphoma 21. Most of the inhibitors identified in these studies are iron chelators, and/or mimics of the cosubstrate 2OG; achieving selectivity between different Fe/2OG dependent oxygenases thus will likely be a major challenge in this field.
The likely difficulty in achieving selective inhibition of particular histone demethylases/subfamilies with compounds designed to mimic 2OG means that there is an unmet need for the identification of diverse inhibitor chemotypes. Here we report the development and application of a high-throughput screening method for the histone demethylases. The previously described formaldehyde dehydrogenase coupled assay22 was redesigned to a simplified and robust protocol which was miniaturized to a low 4 μL volume in 1,536-well format. A pilot screen of a library of bioactives yielded several novel inhibitors which were further characterized in secondary assays. The method presented here will be useful for the discovery of new inhibitors for these enzymes within large compound collections.
MATERIALS AND METHODS
Chemicals and consumables
Dimethyl sulfoxide (DMSO, certified ACS grade) was from Fisher, Inc. The trimethylated histone peptide substrate ARK(me3)STGGK was synthesized and HPLC-purified either in-house using a CS-Bio CS336S automated peptide synthesizer (Supporting Figure 1) or by the Tufts University Core Facility (Boston, MA). Ferrous ammonium sulfate (FAS), (+)-sodium L-ascorbate (SA), β-nicotinamide adenine dinucleotide hydrate (NAD+), Tween-20, formaldehyde dehydrogenase from P. putida (FDH) and disodium 2-oxoglutarate (hereafter 2OG) were from Sigma (St. Louis, MO). HEPES buffer was obtained from Gibco. Black solid-bottom 384-well or 1,536-well assay plates were from Greiner Bio-One (Monroe, NC).
Enzyme
The catalytic domain of human JMJD2E (residues 1–337) was produced as an N-terminally His6-tagged protein in E. coli, and purified by Ni-affinity chromatography and size-exclusion chromatography, and stored at a concentration of 60 mg/mL in HEPES 50 mM NaCl 500 mM pH 7.5, as reported 19.
Assay optimization in 384- and 1,536-well formats
Reactions were performed in 50 mM HEPES pH 7.5 containing 0.01% Tween-20. During the initial assay optimization in 384-well plates, reagents were added as two separate solutions, subsequently referred to as the enzyme solution and substrate solution, respectively. The concentrations given refer to the final values attained in the assay. Using this assay, the Km and kcat parameters for the two substrates were determined to be 14.0 ±1.8 μM and 0.174±0.006 s−1 for 2OG and 21.3±1.1 μM and 0.076±0.001 s−1 for the ARK(me3)STGGK peptide substrate, respectively.
Initially, 21 μL of an ‘enzyme solution’ containing 50 nM JMJD2E, 0.1 mM sodium ascorbate (SA) and 10 μM ferrous ammonium sulfate (FAS) was prepared, and after 15 minutes incubation at room temperature, 9 μL of a ‘substrate solution,’ comprising 0.001 U/μL FDH (one unit defined as 1 μmol formaldehyde oxidized to formic acid in one minute at pH 7.5 and 37 °C), 0.5 mM NAD+, 50 μM disodium oxoglutarate (2OG) and 50 μM peptide substrate, was added. Fluorescence values were recorded every other minute using a ViewLux High-throughput charge-coupled devise (CCD) imager (Perkin-Elmer, Waltham, MA) employing a standard 340 nm excitation and 450 nm emission filter set. A three-solution protocol was also investigated; in this case, 20 μL of the JMJD2E-only solution was added into the well first, followed by 10 μL each of a SA-FAS solution, followed by the substrate solution with the aforementioned components.
In the final miniaturized assay, the JMJD2E concentration was increased to 100 nM in order to produce stronger signal. Reactions were initiated by dispensing 3 μL of enzyme solution (4/3x final concentration) into a 1,536-well assay plate using a nanoliter solenoid-based dispenser (Beckman-Coulter, Fullerton, CA). The assay plate was incubated at room temperature for 10 minutes, followed by a 1 μL addition of 4x substrate solution to initiate the reaction (final assay volume of 4 μL). The plate was then manually transferred into the ViewLux reader for kinetic measurements. To screen for false positive results due to inhibition of FDH, FDH-only assays were run using FDH as the enzyme (0.000025 U/μL final concentration) and 10 μM formaldehyde and 0.25 mM NAD+ as the substrate, and following the same fluidic protocol as described above for the coupled assay.
Compound Library
The Library of Pharmacologically Active Compounds (LOPAC1280, Sigma-Aldrich) of 1,280 known bioactives was obtained as a set of 10 mM DMSO solutions and formatted as a dilution series in 1,536-well compound plates (1:5 dilution ratio) at 5 μL per well. Additional details on the preparation of the compound library for quantitative high-throughput screening (qHTS) have been previously described23.
qHTS Protocol and Data Analysis
Enzyme solutions (3 μL) were dispensed into a 1,536-well Greiner black solid-bottom assay plate. The LOPAC compounds (23 nL) were transferred using a Kalypsys pintool equipped with 1,536-pin array (10 nL slotted pins, V&P Scientific, Palo Alto, CA). The plate was incubated at room temperature (15 min), and then a 1 μL aliquot of substrate solution was added to initiate the reaction. The plate was manually transferred to ViewLux imager where an initial reading was obtained. The plate was then removed from the reader, incubated for 30 minutes, and returned to the reader for a second fluorescence reading. For automated robotic screening, plates were subjected to the same protocol steps except for the transfer steps which were performed by 6-axes anthropomorphic robotic arms as described previously.24 Compound plates containing DMSO as a vehicle-only control were included at the beginning and the end of the screen to monitor any systematic trend in the assay signal associated with reagent dispenser variation or decreases in enzyme specific activity. For activity calculations, Δ values were computed as the difference in fluorescence intensity between last and first time points. The percentage activity was calculated from the median values of the catalyzed, or neutral control, and the uncatalyzed, or 100% inhibited, control, respectively, using in-house software (http://ncgc.nih.gov/pub/openhts/)23–25.
Matrix-assisted laser desorption-ionization time-of-flight mass spectrometry (MALDI-TOF-MS) assay for JMJD2E activity
For the MS assays, JMJD2E (2 μM), FAS (10 μM) and SA (100 μM) in HEPES buffer, 50 mM, pH 7.5, were incubated with inhibitor (stock solutions in DMSO, final in-assay concentration varied, but final DMSO concentration was 5 % of assay mix) for 15 min at room temperature. Disodium 2OG (10 μM) and peptide (10 μM) were added, and the mixture was incubated for 30 min at 37 °C, before 1:1 quenching with methanol followed by addition of four volumes of 20 mM triammonium citrate. The diluted assay mixture (1 μL) was then mixed with α-cyano-4-hydroxycinnamic acid (the MALDI-TOF-MS matrix, 1μL) and spotted onto a MALDI-TOF-MS plate before analysis. The relative intensities of different methylation states observed in the mass spectra (Supporting Figure 1) were then used to calculate percentage demethylation, and IC50s were calculated from the variation in percentage demethylation at different inhibitor concentrations, as reported19.
RESULTS AND DISCUSSION
Our starting point for the optimization of a screening protocol for JMJD2E was a recently-reported coupled-enzyme method19, 22, 26 that utilizes a trimethylated peptide substrate corresponding to a fragment of histone H3 (sequence ARKme3STGGK) with detection of the formaldehyde co-product in real time by a formaldehyde dehydrogenase (FDH) coupled reaction. FDH catalyzes oxidation of formaldehyde to formic acid with the concomitant reduction of the non-fluorescent β-nicotinamide adenine dinucleotide hydrate (NAD+) cofactor to the fluorescent NADH co-product (Figure 1). This assay has been used in routine investigations of demethylase activity in cuvette and 96- and 384-well formats; typically, it involves the preparation of enzyme [JMJD2E, sodium ascorbate (SA), and ferrous ammonium sulfate (FAS)] and substrate (peptide, FDH, 2OG, NAD+) solutions, and combination of the two (with or without the presence of a candidate inhibitor) in order to initiate the reaction. While our initial tests performed with freshly prepared reagents yielded strong fluorescent signals, we wished to investigate the long term integrity of the assay components as a prerequisite for a large scale robotic screening campaign. The enzyme and substrate solutions were therefore incubated separately on ice for 5 hours (after an initial measurement of activity to serve as a 100% activity control); virtually no activity was seen after each solution was incubated separately on ice for 5 hours. The reaction progress curve closely tracked the no-enzyme control, indicating loss of activity of some or all of the reagents after storage for 5 h on ice (Figure 2A).
Figure 1. JMJD2E coupled assay principle.

JMJD2E-catalyzed demethylation of H3K9me3 and concomitant oxidation/decarboxylation of 2OG. Demethylation releases formaldehyde, which is oxidized to formic acid by FDH, with concomitant reduction of NAD+ to NADH, which is monitored by fluorescence spectroscopy.
Figure 2. Reaction protocol optimization.

Reactant compatibility studies were performed in order to arrive at a robust HTS assay. The assay signal was observed to deteriorate after five hours of storage of the enzyme (also containing SA and FAS) and substrate solutions (A). Reagent component deconvolution tests (B) were performed at the following protocol conditions, comparing the respective activity to that obtained from freshly-prepared reagents: both solutions prepared fresh at the point of testing (condition A, 100% activity reference), substrate solution tested after five-hour storage with freshly-made enzyme (condition B), enzyme solution tested after five-hour storage with freshly-made substrate (condition C), freshly prepared enzyme tested with SA and FAS which had been stored separately on ice for five hours (condition D), enzyme which was stored for 5 hours on ice and tested with freshly prepared SA and FAS (condition E), freshly prepared enzyme tested with SA and FAS that were stored together on ice (condition F), and freshly prepared enzyme tested with SA and FAS that were stored together at room temperature (condition G). Comparable performance of 2-solution (triangles) and 3-solution (squares) protocols (complete reaction: solid symbols, no-enzyme control: empty symbols) (C). Error bars indicate standard deviations from triplicate measurements.
A series of reagent component deconvolution experiments was then performed in order to identify the source of the drop in assay performance and to enable a robust screening condition. Both reagent solutions were stored on ice for five hours and their activity was cross-tested with freshly prepared complementary solutions. As reference, a reaction conducted with both solutions prepared fresh at the point of testing was used (Figure 2B, condition A). The performance of the two stored solutions differed drastically. The substrate solution survived the five-hour storage intact (Figure 2B, condition B); in contrast, the enzyme solution lost approximately 92% of its activity (Figure 2B, condition C). It was concluded that the loss of assay signal upon reagent storage was associated with reagent degradation taking place within the enzyme solution.
To determine whether the apparent degradation was due to instability of JMJD2E itself, or to the combination of JMJD2E, SA and FAS, the components of the enzyme solution were subdivided and kept on ice, or at room temperature, while the substrate solution, previously shown to be stable, was kept on ice for five hours. Freshly prepared JMJD2E tested with SA and FAS which had been stored separately on ice for five hours, displayed only an 8.5% loss in activity as compared with an entirely freshly prepared enzyme solution (Figure 2B, condition D). JMJD2E which was stored for 5 hours on ice and tested with freshly prepared SA and FAS lost 17% of activity (Figure 2B, condition E). This result indicates that JMJD2E, while having lost some activity after storage on ice, was not particularly unstable when stored by itself. In contrast, freshly prepared JMJD2E tested with SA and FAS that were stored together on ice, or at room temperature, for five hours, displayed 37 % and 77 % loss of activity, respectively (Figure 2B, conditions F and G). This indicates that initially observed enzyme solution instability was primarily due to degradation associated with the SA-FAS mixture, and that the rate of SA-FAS degradation was accelerated at room temperature. It is known that ascorbic acid decomposes in the presence of ferric ions (formed from ferrous ions and oxygen)27; further, a recent report also describes the Fe(III) mediated degradation of dehydroascorbate in the absence of oxygen28.
Having established that the stability of the JMJD2E enzyme was dramatically improved upon its separation from SA-FAS, we then investigated whether the protocol could be improved further by merging the SA-FAS components with the substrate solution to yield a streamlined two-solution scheme. Thus, we performed overnight stability tests of reagent sets corresponding to a three-solution [(i) JMJD2E, (ii) SA-FAS, and (iii) substrate solution consisting of 2OG, peptide substrate, FDH, and NAD+] or two-solution [(i) JMJD2E and (ii) substrate solution consisting of SA, FAS, 2OG, peptide substrate, FDH, and NAD+] protocols, respectively. While there was an initial decrease in signal strength during the first approximately 3 hours of storage (Figure 2C), no significant further drop was observed upon extended storage. Importantly, the stability profiles for the two-versus three-solution protocols were nearly identical, demonstrating that merging all the non-JMJD2E components into one combined substrate solution does not lead to a worsened assay performance. Using the two-solution protocol thus established, FDH and FAS titrations were performed in order to re-validate the optimal levels of these key components (Supporting Figure 2). Final concentrations of 0.00025 U/μL FDH and 10 μM FAS were selected.
The simplified two-solution protocol was then miniaturized to a 1,536-well format by direct volume scaling. Thus, 3 μL of 4/3x solution of enzyme solution was dispensed in a plate. Inhibitor addition, if applicable, was achieved by a pintool delivery of 23 nL of compound solution. Addition of 1 μL 4x substrate solution initiated the reaction. To re-assess the stability of the reagents within the finally configured miniaturized assay, comparison runs of reagents stored for 0 (fresh), 8, and 24 hours were then performed (Figure 3). Consistent with the earlier results obtained in 384-well format, only a minimal loss of activity was observed. We note that unlike previous methods19 where JMJD2E was assayed at a 2 μM concentration (placing a relatively high limit on the IC50 value that can be obtained), the present optimized protocol yielded sufficient signal with the use of only 100 nM JMJD2E, thereby making it more economical with respect to protein consumption and more sensitive to inhibitors. Recording the fluorescence intensity in real-time kinetic mode afforded the facile detection of autofluorescent compounds which contributed excessive amounts of fluorescence to the initial fluorescence readouts24, 29, 30.
Figure 3. Robustness of the optimized 1,536-well based assay.

Plotted are averages and standard deviations derived from 16 wells per reaction control (complete reaction: solid symbols, no-enzyme control: empty symbols) for reaction progress curves obtained with fresh reagents (squares) and reagents stored on ice for 8 h (triangles) or 24 h (circles).
The JMJD2E assay was then applied to screen an 8-point dilution series of the LOPAC1280 compound library with final compound concentrations ranging from 18.3 nM to 57.2 μM. Consistently high Z′ factors31 (average 0.93) were observed throughout the screen (Figure 4A), indicating a stable assay. The hits identified in this screen, all of which exhibited IC50s above 2.5 μM, were dominated by catechol and flavonoid compounds (representative screen-derived concentration-response curves shown in Figure 4B). To investigate these hits, select catechols and flavonoids (Table 1) were acquired as dry powders and their activity further characterized. A counterscreen with the FDH coupling enzyme failed to yield significant inhibition from any of the compounds up to the top 57 μM concentration tested, thus ruling them out as false positive acting on FDH. A comparison of IC50 values obtained from the coupled assay, and an assay where the removal of methyl groups from the substrate was monitored by MALDI-TOF MS, was then carried out19. The high level of concordance between the results from the present miniaturized HTS assay and the orthogonal mass spectrometry-based method (Table 1) further validated the high-throughput methodology for 2OG-dependent demethylase inhibitor identification. 2,4-Pyridinedicarboxylic acid (2,4-PDCA), a previously noted 2OG-competitive inhibitor of JMJD2E19, yielded IC50 values of 0.20 μM and 0.9 μM in the present HTS and MALDI-TOF MS assays, respectively. The IC50 values determined by the MALDI-TOF MS technique were on average higher than the corresponding values derived from the miniaturized coupled assay, at least in part because of the higher concentration (2 μM) of JMJD2E employed in the former. To further demonstrate the robustness of the assay and the reproducibility of the inhibition effect observed in the screen, we performed a triplicate screen of the same compound collection, in dose-response mode, using a fully integrated robotic system.24 A high and stable Z′ trend was noted for this expanded screen; moreover, there was an excellent reproducibility of the actual concentration-response curves among the three replicates (Supporting Figure 3).
Figure 4. LOPAC1280 qHTS.

The performance of the qHTS assay with the LOPAC compounds is evidenced by the consistently high Z′ factor (A) and a set of concentration-response curves associated with top screening actives (B).
Table 1. HTS Actives.
IC50 values are given in μM, and were determined from duplicate measurements. The “Fe ratio” is the ratio of IC50 values obtained when the compound was tested in the coupled assay in the presence of 20 μM FAS versus 2.5 μM FAS.
| Sample | HTS | MALDI | Fe ratio |
|---|---|---|---|
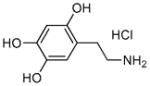
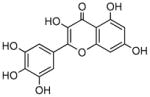 Myricetin |
3.6 | 3.2 | 1.6 |
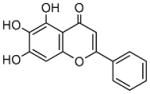 Baicalein |
4.0 | 4.5 | 3.9 |
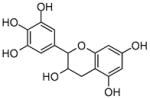 Epigallocatechin |
5.0 | N/D | 1.1 |
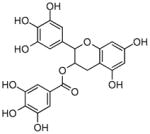 Epigallocatechin gallate |
3.2 | 3.0 | 5.0 |
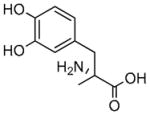 L-Methyldopa |
4.0 | 6.1 | 0.45 |
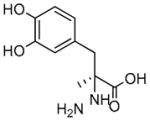 S(−)-Carbidopa |
8.0 | 7.5 | 3.9 |
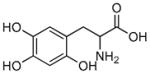 6-Hydroxy-DL-DOPA |
5.0 | N/D | 0.29 |
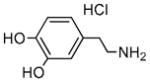 Dopamine hydrochloride |
7.1 | 2.2 | 0.36 |
 Oxidopamine Hydrochloride |
4.0 | 12.2 | 3.1 |
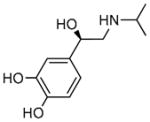 (−)-Isoproterenol hydrochloride |
10 | 8.4 | 0.30 |
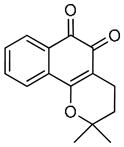 beta-Lapachone |
3.6 | 8.4 | N/D |
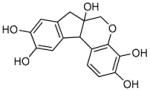 hematoxylin |
2.0 | 3.4 | 8.9 |
 Fenoldopam bromide |
7.9 | 10.1 | 1.3 |
N/D = not determined.
Most, if not all, of the initial lead compounds have the potential to bind to iron ions at the active site and/or in solution. In order to probe the mechanism of action of the present compounds with respect to iron chelation in solution32, pairs of FDH coupled assays were then performed utilizing concentrations of FAS which were respectively higher (20 μM) and lower (2.5 μM) than the level used in the initial screen. We used the ratio of IC50 values in the high-FAS assays (20 μM FAS) compared to those in the low-FAS assays (2.5 μM FAS) (Table 1) to serve as an approximate measure of an inhibitor’s propensity for iron chelation in solution. EDTA, a recognized iron chelator, yielded a ratio of 5.9 in these tests. Approximately half of the compounds tested exhibited low ratios of below 3 and all compounds except two (epigallocatechin gallate and hematoxylin) displayed ratios below 4; further, the ratios for several related compounds (L-methyldopa, (−)-isoproterenol, 6-hydroxy-DL-DOPA, and dopamine) were below 1, As most of the ratios observed, particularly those below 1 and between 1 and 3, fall within the typical variation of IC50 measurements it is difficult to derive firm conclusions regarding the structure-ferrous-chelation relationship from the present tests; however, catechols and flavonoids have already been noted for their iron-binding properties33. Kinetic analysis of the mode of inhibition of four of these compounds (baicalein, S-(−)-carbidopa, β-lapachone, and fenoldopam, Supporting Figure 4) revealed that β-lapachone, fenoldopam and baicalein were noncompetitive inhibitors of JMJD2E with respect to 2OG (Ki = 3.55 ± 0.41 μM, Ki = 1.92 ± 0.11 μM, and Ki = 4.33 ± 0.39 μM, respectively), while S-(−)-carbidopa appears to be an uncompetitive inhibitor of JMJD2E with respect to 2OG (αKi = 1.98 ± 0.17). Thus, unlike most reported 2OG oxygenase inhibitors, none of these compounds appears to be competitive with 2OG. Further work is required to identify their precise mode of inhibition, and it is possible that it involves a combination of factors.
Many biological activities have been associated with catechols and flavonoids. The predominance of catechols and the related flavonoids that were obtained from screening the LOPAC library probably reflects a combination of their relative abundance in most known bioactive screening collections, and the ability of the aromatic ene-diol functionality to act as a bidentate iron chelator. Several reports have described the inhibition of 2OG oxygenases by catechols/flavonoids, including the collagen lysyl hydroxylases34 and the hypoxia inducible factor (HIF) prolyl and asparaginyl hydroxylases14, 35–37. The finding that catechols/flavonoids also inhibit JMJD2E, and likely other 2OG dependent oxygenases, suggests that many, if not all, 2OG oxygenases will be inhibited by such compounds. Thus in vivo reports on the cellular activity of these compounds that attempt to make correlations between the inhibition of specific enzymes and cellular/physiological responses should be treated with caution. The observed activities are not questioned; however, it is likely that they result from many interactions with a wide variety of enzyme targets38, 39. Indeed, there is evidence that catechols/flavonoids are promiscuous inhibitors and in some cases have been shown to cause protein aggregation under in vitro screening conditions40, 41.
The lack of non-catechol/flavonoid hits from the screening of the LOPAC compound set suggests that the identification of new lead compounds suitable for optimization for inhibition of JMJD2E and related demethylases may require the screening of much larger and more diverse compound collections. The simple and robust homogeneous assays that we have developed and validated for monitoring JMJD2E activity will enable such large-scale high-throughput screens.
Supplementary Material
Acknowledgments
This research was supported in part by the Molecular Libraries Initiative of the NIH Roadmap for Medical Research and the Intramural Research Program of the NHGRI, NIH, and in part by the Wellcome Trust, the Biotechnology and Biological Sciences Research Council and the Commonwealth Scholarship Commission in the United Kingdom. The Structural Genomics Consortium is a registered charity (number 1097737) that receives funds from the Canadian Institutes for Health Research, the Canadian Foundation for Innovation, Genome Canada through the Ontario Genomics Institute, GlaxoSmithKline, Karolinska Institutet, the Knut and Alice Wallenberg Foundation, the Ontario Innovation Trust, the Ontario Ministry for Research and Innovation, Merck & Co., Inc., the Novartis Research Foundation, the Swedish Agency for Innovation Systems, the Swedish Foundation for Strategic Research and the Wellcome Trust.
Footnotes
COMPETING INTERESTS STATEMENT
CJS is a cofounder of ReOx, a company that is interested in the exploitation of the hypoxic response for therapeutic benefit. The authors declare no other competing financial interests
References
- 1.Klose RJ, Zhang Y. Nat Rev Mol Cell Biol. 2007;8:307–318. doi: 10.1038/nrm2143. [DOI] [PubMed] [Google Scholar]
- 2.Cloos PA, Christensen J, Agger K, Helin K. Genes Dev. 2008;22:1115–1140. doi: 10.1101/gad.1652908. [DOI] [PMC free article] [PubMed] [Google Scholar]
- 3.Wissmann M, Yin N, Muller JM, Greschik H, Fodor BD, Jenuwein T, Vogler C, Schneider R, Gunther T, Buettner R, Metzger E, Schule R. Nat Cell Biol. 2007;9:347–353. doi: 10.1038/ncb1546. [DOI] [PubMed] [Google Scholar]
- 4.Clifton IJ, McDonough MA, Ehrismann D, Kershaw NJ, Granatino N, Schofield CJ. J Inorg Biochem. 2006;100:644–669. doi: 10.1016/j.jinorgbio.2006.01.024. [DOI] [PubMed] [Google Scholar]
- 5.Hausinger RP. Crit Rev Biochem Mol Biol. 2004;39:21–68. doi: 10.1080/10409230490440541. [DOI] [PubMed] [Google Scholar]
- 6.Price JC, Barr EW, Glass TE, Krebs C, Bollinger JM. J Am Chem Soc. 2003;125:13008–13009. doi: 10.1021/ja037400h. [DOI] [PubMed] [Google Scholar]
- 7.Loenarz C, Schofield CJ. Nat Chem Biol. 2008;4:152–156. doi: 10.1038/nchembio0308-152. [DOI] [PubMed] [Google Scholar]
- 8.Tschank G, Brocks DG, Engelbart K, Mohr J, Baader E, Gunzler V, Hanauske-Abel HM. Biochem J. 1991;275(Pt 2):469–476. doi: 10.1042/bj2750469. [DOI] [PMC free article] [PubMed] [Google Scholar]
- 9.Myllyharju J. Ann Med. 2008;40:402–417. doi: 10.1080/07853890801986594. [DOI] [PubMed] [Google Scholar]
- 10.Dao JH, Kurzeja RJM, Morachis JM, Veith H, Lewis J, Yu V, Tegley CM, Tagari P. Analytical Biochemistry. 2009;384:213–223. doi: 10.1016/j.ab.2008.09.052. [DOI] [PubMed] [Google Scholar]
- 11.Nangaku M, Kojima I, Tanaka T, Ohse T, Kato H, Fujita T. Recent Pat Cardiovasc Drug Discov. 2006;1:129–139. doi: 10.2174/157489006777442522. [DOI] [PubMed] [Google Scholar]
- 12.Hewitson KS, Lienard BM, McDonough MA, Clifton IJ, Butler D, Soares AS, Oldham NJ, McNeill LA, Schofield CJ. J Biol Chem. 2007;282:3293–3301. doi: 10.1074/jbc.M608337200. [DOI] [PubMed] [Google Scholar]
- 13.McDonough MA, McNeill LA, Tilliet M, Papamicael CA, Chen QY, Banerji B, Hewitson KS, Schofield CJ. J Am Chem Soc. 2005;127:7680–7681. doi: 10.1021/ja050841b. [DOI] [PubMed] [Google Scholar]
- 14.Welford RW, Schlemminger I, McNeill LA, Hewitson KS, Schofield CJ. J Biol Chem. 2003;278:10157–10161. doi: 10.1074/jbc.M211058200. [DOI] [PubMed] [Google Scholar]
- 15.Rademacher W. Annu Rev Plant Physiol Plant Mol Biol. 2000;51:501–531. doi: 10.1146/annurev.arplant.51.1.501. [DOI] [PubMed] [Google Scholar]
- 16.Marks PA. Oncogene. 2007;26:1351–1356. doi: 10.1038/sj.onc.1210204. [DOI] [PubMed] [Google Scholar]
- 17.Chang Y, Zhang X, Horton JR, Upadhyay AK, Spannhoff A, Liu J, Snyder JP, Bedford MT, Cheng X. Nat Struct Mol Biol. 2009;16:312–317. doi: 10.1038/nsmb.1560. [DOI] [PMC free article] [PubMed] [Google Scholar]
- 18.Kubicek S, O’Sullivan RJ, August EM, Hickey ER, Zhang Q, Teodoro ML, Rea S, Mechtler K, Kowalski JA, Homon CA, Kelly TA, Jenuwein T. Mol Cell. 2007;25:473–481. doi: 10.1016/j.molcel.2007.01.017. [DOI] [PubMed] [Google Scholar]
- 19.Rose NR, Ng SS, Mecinovic J, Lienard BM, Bello SH, Sun Z, McDonough MA, Oppermann U, Schofield CJ. J Med Chem. 2008;51:7053–7056. doi: 10.1021/jm800936s. [DOI] [PubMed] [Google Scholar]
- 20.Hamada S, Kim TD, Suzuki T, Itoh Y, Tsumoto H, Nakagawa H, Janknecht R, Miyata N. Bioorg Med Chem Lett. 2009;19:2852–2855. doi: 10.1016/j.bmcl.2009.03.098. [DOI] [PubMed] [Google Scholar]
- 21.Belvedere S, Witter DJ, Yan J, Secrist JP, Richon V, Miller TA. Bioorg Med Chem Lett. 2007;17:3969–3971. doi: 10.1016/j.bmcl.2007.04.089. [DOI] [PubMed] [Google Scholar]
- 22.Lizcano JM, Unzeta M, Tipton KF. Anal Biochem. 2000;286:75–79. doi: 10.1006/abio.2000.4782. [DOI] [PubMed] [Google Scholar]
- 23.Yasgar A, Shinn P, Michael S, Zheng W, Jadhav A, Auld D, Austin C, Inglese J, Simeonov A. J Assoc Lab Automat. 2008;13:79–89. doi: 10.1016/j.jala.2007.12.004. [DOI] [PMC free article] [PubMed] [Google Scholar]
- 24.Michael S, Auld D, Klumpp C, Jadhav A, Zheng W, Thorne N, Austin C, Inglese J, Simeonov A. Assay Drug Dev Technol. 2008;6:637–657. doi: 10.1089/adt.2008.150. [DOI] [PMC free article] [PubMed] [Google Scholar]
- 25.Inglese J, Auld DS, Jadhav A, Johnson RL, Simeonov A, Yasgar A, Zheng W, Austin CP. Proc Nat Acad Sci USA. 2006;103:11473–11478. doi: 10.1073/pnas.0604348103. [DOI] [PMC free article] [PubMed] [Google Scholar]
- 26.Ng SS, Kavanagh KL, McDonough MA, Butler D, Pilka ES, Lienard BM, Bray JE, Savitsky P, Gileadi O, von Delft F, Rose NR, Offer J, Scheinost JC, Borowski T, Sundstrom M, Schofield CJ, Oppermann U. Nature. 2007;448:87–91. doi: 10.1038/nature05971. [DOI] [PubMed] [Google Scholar]
- 27.Erdey L, Bodor E. Anal Chem. 1952;24:418–420. [Google Scholar]
- 28.Mecinovic J, Hamed RB, Schofield CJ. Angew Chem Intl Ed. 2009;48:2796–2800. doi: 10.1002/anie.200806296. [DOI] [PubMed] [Google Scholar]
- 29.Inglese J, Johnson RL, Simeonov A, Xia M, Zheng W, Austin CP, Auld DS. Nat Chem Biol. 2007;3:466–479. doi: 10.1038/nchembio.2007.17. [DOI] [PubMed] [Google Scholar]
- 30.Simeonov A, Kulkarni A, Dorjsuren D, Jadhav A, Shen M, McNeill DR, Austin CP, Wilson DM., III PLoS ONE. 2009;4:e5740. doi: 10.1371/journal.pone.0005740. [DOI] [PMC free article] [PubMed] [Google Scholar]
- 31.Zhang JH, Chung TD, Oldenburg KR. J Biomol Screen. 1999;4:67–73. doi: 10.1177/108705719900400206. [DOI] [PubMed] [Google Scholar]
- 32.Mira L, Fernandez MT, Santos M, Rocha R, Florencio MH, Jennings KR. Free Radical Res. 2002;36:1199–1208. doi: 10.1080/1071576021000016463. [DOI] [PubMed] [Google Scholar]
- 33.Andjelkovic M, Van Camp J, De Meulenaer B, Depaemelaere G, Socaciu C, Verloo M, Verhe R. Food Chem. 2006;98:23–31. [Google Scholar]
- 34.Murray JC, Cassell RH, Pinnell SR. Biochim Biophys Acta. 1977;481:63–70. doi: 10.1016/0005-2744(77)90137-1. [DOI] [PubMed] [Google Scholar]
- 35.Wilson WJ, Poellinger L. Biochem Biophys Res Comm. 2002;293:446–450. doi: 10.1016/S0006-291X(02)00244-9. [DOI] [PubMed] [Google Scholar]
- 36.Zhou YD, Kim YP, Li XC, Baerson SR, Agarwal AK, Hodges TW, Ferreira D, Nagle DG. J Nat Prod. 2004;67:2063–2069. doi: 10.1021/np040140c. [DOI] [PMC free article] [PubMed] [Google Scholar]
- 37.Cho H, Lee HY, Ahn DR, Kim SY, Kim S, Lee KB, Lee YM, Park H, Yang EG. Mol Pharmacol. 2008;74:70–81. doi: 10.1124/mol.107.040162. [DOI] [PubMed] [Google Scholar]
- 38.Hwang KY, Oh YT, Yoon H, Lee J, Kim H, Choe W, Kang I. Neurosci Lett. 2008;444:264–269. doi: 10.1016/j.neulet.2008.08.057. [DOI] [PubMed] [Google Scholar]
- 39.Triantafyllou A, Mylonis I, Simos G, Bonanou S, Tsakalof A. Free Rad Biol Med. 2008;44:657–670. doi: 10.1016/j.freeradbiomed.2007.10.050. [DOI] [PubMed] [Google Scholar]
- 40.McGovern SL, Shoichet BK. J Med Chem. 2003;46:1478–1483. doi: 10.1021/jm020427b. [DOI] [PubMed] [Google Scholar]
- 41.McGovern SL, Caselli E, Grigorieff N, Shoichet BK. J Med Chem. 2002;45:1712–1722. doi: 10.1021/jm010533y. [DOI] [PubMed] [Google Scholar]
Associated Data
This section collects any data citations, data availability statements, or supplementary materials included in this article.