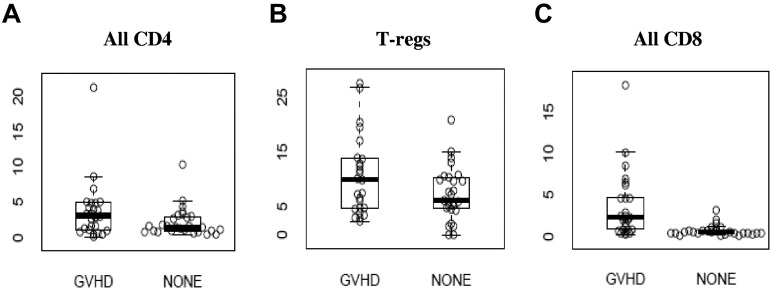
Figure 1.
CD30 expression on T-cell subsets (A) CD4+ T cells, (B) regulatory T cells (T-regs), and (C) CD8+ T cells. Values on the y-axis are the percentage of the cells in each specific T-cell subset expressing CD30. Exact values and ranges are listed in Table 2.

