Abstract
Purpose
To examine how demographic and geographic variations in US populations from 2011 to 2050 will contribute to estimated numbers of primary open-angle glaucoma (POAG).
Design
Cross-sectional study
Methods
Prevalence rates from selected population-based studies were used to estimate the number of persons aged 40 years and older with POAG in the US. For calculation, the age-, sex-, race/ethnicity-specific prevalence rates were multiplied by the US census estimates and projections from 2011–2050. Main outcome measures are estimated numbers of persons with POAG in different age, sex and racial/ethnic groups and total and per-capita POAG rates by state.
Results
In 2011, 2.71 million persons in the US have POAG, with the highest estimated number among populations aged 70–79 years (31%), women (53%), and non-Hispanic white (44%). The largest demographic group is non-Hispanic white women. In 2050, an estimated 7.32 million persons will have POAG; with the highest number among populations aged 70–79 years (32%), women (50%), and Hispanics (50%). The largest demographic group will shift to Hispanic men. During the next 40 years, the highest per capita POAG rates will double in New Mexico, Texas, and Florida.
Conclusions
Despite the high prevalence of POAG in African Americans and Hispanics, the largest group in the US is currently among older non-Hispanic white women but is expected to shift to Hispanic men over the next few decades. Given this shift, the greatest yield from screening programs is likely to be in those states with high numbers of non-Hispanic white women and Hispanic men.
Glaucoma, a leading cause of blindness worldwide, remains a significant public health problem.1 It is estimated that the number of people worldwide with glaucoma will increase from 60.5 million in 2010 to 79.6 million in 2020.1 Primary open-angle glaucoma (POAG) is the most common type, constituting 74% of all persons with glaucoma.1 As the population in the US (United States) ages, the number of persons with POAG is rising.2, 3 Additionally, increasing immigration to the US in the past decades has further contributed to the rising number. The percentage of people of Hispanic/Latino and Asian origins has more than doubled in recent decades.3 According to one estimate, the data on POAG prevalence rates in Hispanics/Latinos and other minorities are lacking. Recently, the Los Angeles Latino Eye Study (LALES) and other large population-based studies on Asians have concluded and reported their results.4–7 Data from these recent population-based studies have not been included in previous estimates. Analyses including these more recent data will improve the accuracy of the estimation, particularly for these minority groups. Furthermore, most previous estimates of POAG have focused on prevalence and have highlighted the high rates in African Americans and Hispanics/Latinos. In this study, we estimate the overall numbers of persons with POAG and highlight how demographic differences within the US are related to geographic variations in the burden of POAG, elucidating how demographic changes in the population over the next four decades are likely to change the groups that contribute to the greatest burden of this disease in the US.
Methods
Data Sources
We calculated the number of persons with POAG in the US for 5 racial/ethnic groups; non-Hispanic whites, African Americans, Hispanics/Latinos, Asians and other minorities. Based on the census, the term other minorities refers to populations classified as American Indian, Alaska Native, Native Hawaiian, and other Pacific Islander. A MEDLINE (Medical Literature Analysis and Retrieval System Online) search was performed to identify representative studies for each racial/ethnic group of the US population. Search terms used included the MeSH (medical subject headings) terms “glaucoma, open-angle” and “prevalence” with restrictions on language (English) and date (1/1/1986 to 11/15/2010). A total of 258 relevant abstracts were identified and reviewed. All of the US population estimates and projections were obtained from data provided on www.census.gov.
Study Selection and Data Extraction
The representative studies for each racial/ethnic group in the US were selected based on 1) population-based studies conducted in the US, 2) diagnostic criteria based on assessment of visual field and/or optic nerve, and 3) available age-, sex-, and racial/ethic-specific prevalence rates for the studied population aged 40 years or older. Based on our review, six major population-based studies have been conducted in the US for predominantly non-Hispanic white populations (Framingham Eye Study, Baltimore Eye Survey and Beaver Dam Eye Study), mixed white and African American populations (Baltimore Eye Survey and Salisbury Eye Evaluation Study) and Hispanic/Latino populations - Proyecto VER [Vision and Eye Research] and LALES.4, 8–12 Based on our selection criteria, the Baltimore Eye Survey was selected to represent non-Hispanic white and African American populations, and the LALES was chosen to represent Hispanic/Latino populations. A supplemental table summarizing diagnostic criteria for POAG for each study and reason to include/exclude each study is available online. In brief, we excluded the Framingham Eye Study because the screening method used might lead to underestimation of POAG prevalence.8 In this study, screening examination was performed in 10% of the sample. In addition, we excluded the Beaver Dam Eye Study because the study’s criteria for POAG diagnosis were based on intraocular pressure, which is not included in the current definition of POAG.9 Furthermore, the Salisbury Eye Evaluation Study was excluded because the study was limited to older participants, aged 73 years or greater.11 In addition, details of vertical cup-to-disc ratio and symmetry were not described. For the US Hispanics/Latinos, the Proyecto VER was not included based on its limited diagnostic criteria. Specifically, it included only cases with structural and functional evidence in category 1 and advanced cases of structural damage with unproven visual field loss in category 2 (vertical cup-to-disc ratio > 0.85). Thus the study was likely to underestimate the prevalence. On the other hand, the LALES criteria are similar to those used in other selected US studies. Lastly, because data on prevalence rate of POAG in US Asians and other minorities are lacking, an alternative approach was applied. We found three major population-based studies or surveys of Asian populations, including the population survey in the Chinese residents in Singapore, Tanjong Pagar district, the Singapore Malay Eye Study, and the Beijing Eye Study.5–7 We selected the study of Chinese residents of Singapore to represent US Asians5 for two reasons: first, the Chinese are the largest group of US Asians,13 and second, the socioeconomic background of Chinese residents in Singapore is similar to that of residents in the US. Specifically, Singapore and the US ranked eleventh and thirteenth, respectively, according to the Economist Intelligent Unit’s quality-of-life index based on 9 quality-of-life factors, including income and life expectancy.14 In addition, the Singaporean government provides subsidized medical insurance for retirees, “Medisave”, comparable to the US “Medicare.”15 For other minorities, we used estimated prevalence rates developed by the Eye Disease Prevalence Research Group (EDPRG). Specifically, given that there are no studies that have been conducted on racial/ethnic groups included in the “other minorities” group, the Eye Disease Prevalence Research Group used the unweighted average of the pooled stratum-specific prevalence rates for whites, African Americans and Hispanics/Latinos for the other minorities group.2 Table 1 provides characteristics of selected studies for each race/ethnicity.2, 4, 5, 10
Table 1.
Characteristics of selected population-based studies utilized for calculating estimated number of persons with primary open-angle glaucoma in the United States.
| Selected Studies | BES10 | BES10 | LALES4 | Singapore Study5 | EDPRG2 |
|---|---|---|---|---|---|
| Race/Ethnicity | Non-Hispanic White | African American | Hispanic | Asian | Other Minorities |
| Sample Size | 2913 | 2395 | 6142 | 1232 | 23012* |
| Sex (women/men) | 1.3 | 1.7 | 1.4 | 1.2 | 1.4 |
| Age Range (years) | 40+ | 40+ | 40+ | 40+ | 40+ |
| Overall Prevalence of POAG in percent (95% CI) | 1.7 (1.1–2.3) | 5.6 (4.6–6.6) | 4.7 (4.2,5.3) | 2.4 (1.6,3.2) | 1.86 (1.8–2.0) |
Abbreviations: POAG, primary open-angle glaucoma; BES, the Baltimore Eye Survey; LALES, the Los Angeles Latino Eye Study; EDPRG, the Eye Disease Prevalence Research Group; Other Minorities; American Indian, Alaska Native, Native Hawaiian and other Pacific Islander; CI, confidence interval.
The EDPRG “other minorities” prevalence is an un-weighted pooled prevalence rate derived from the sum of all participants from non-Hispanic White, African American and Hispanics used in the EDPRG estimate of the prevalence of POAG.2
Data Synthesis
The principal investigator and/or co-investigator of the selected studies were contacted to obtain age-, sex-, and racial/ethnic-specific prevalence rates for POAG. Of note, because the data for population aged 80 years and older are not available in the Singapore Study, we used the prevalence rates for population aged 70–79 years for population aged 80 years and older.
All of the US population estimates and projections were obtained from data provided on www.census.gov. We used a 2008 updated version for population estimate and a 2009 updated version for population projection based on the US census 2000 for the analyses. The updated versions were adjusted for annual birth rates, death rates, and net immigration. Specifically, this adjustment was calculated by the census.
The detailed methods for population estimates and projection can be found at www.census.gov.16 In brief, based on the 2000 census, the census bureau produces quarterly updated estimates of the US population. The updated estimates are calculated from the base population, adding births to US resident women, subtracting deaths to US residents, and adding net international migrants. Data for births to US women, deaths to US residents and net international immigration are derived from the National Health Center for Health Statistics and American Community Survey. In the present study, we used the 2008 updated estimate, as recommended by the US Census. In addition, the census bureau provides data for population projection from 2000 to 2050. In the present study, we used the middle series of the 2009 version for population projections. In brief, the projections were calculated using “a cohort-component” method. Specifically, for each passing year, one year of age was added to each person, and the number was then adjusted by survival rate and net immigration. A new birth cohort, the population under one year of age was calculated by applying projected age-specific fertility rates to the female population aged 15 to 49 years. In the middle series, fertility was assumed to remain almost constant (2.1 births per woman); life expectancy is projected to increase from 76.0 years in 1993 to 82.6 years in 2050; and net immigration remains constant at 880,000 per year.17
Current and Projected estimates of Persons with POAG from 2011–2050
Tables for age-, sex- and race/ethnicity-specific US estimates and projections from 2011–2050 were obtained from www.census.gov. The strata-matched prevalence rates for POAG were multiplied by the population estimates and projections to calculate the number of persons with POAG in the US from 2011–2050.16
Current and Projected estimates of Persons with POAG by State and Region
Customized tables for estimates of the US population in 2009 (current) and 2050 (projected) by age, sex, and race/ethnicity for each state and region were obtained from www.census.gov. The strata-matched prevalence rates for POAG were then multiplied by the population estimates to calculate the number of persons with POAG and the per capita burden (density in percent) of POAG in the US by state and region.16
The total number of persons with POAG from 2011–2050 was computed by combining estimated number of persons with POAG by age, sex, and race/ethnicity. All analyses were performed using SAS (Statistical Analysis System) (SAS Institute Inc., Cary NC) and Microsoft Excel® 2007 (Microsoft Corporation, Bellevue, WA).
Sensitivity Analysis
We conducted a sensitivity analysis of our assumptions regarding the prevalence rate of POAG in the US for different racial and ethic groups. We tested the impact of our assumptions by making changes in the main model and by modifying prevalence rates based on available data. For scenario 1, the pooled prevalence rates from the EDPRG, the combined data for European-derived non-Hispanic whites, were used for non-Hispanic whites. For scenario 2, the pooled prevalence rates from the Proyecto VER and LALES were used for Hispanics/Latinos. For scenario 3, the pooled prevalence rates from the Eye Disease Prevalence Research Group and the unweighted averages of the pooled stratum-specific prevalence rates for whites, African Americans, and Hispanics/Latinos were used for Asians. We then compared the numbers from each scenario to the main model.
Results
Demographic Changes from 2011–2050
The following summarizes demographic changes from current to future projected numbers of persons with POAG in the US from 2011–2050.
Current Estimates of Persons with POAG in the US
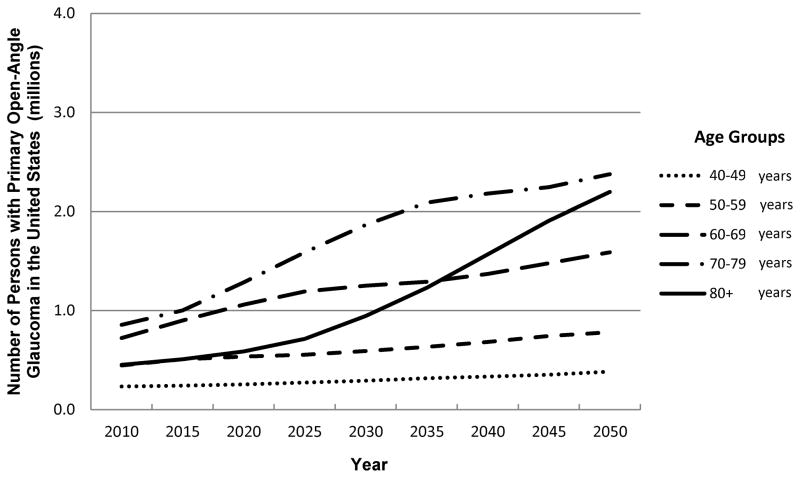
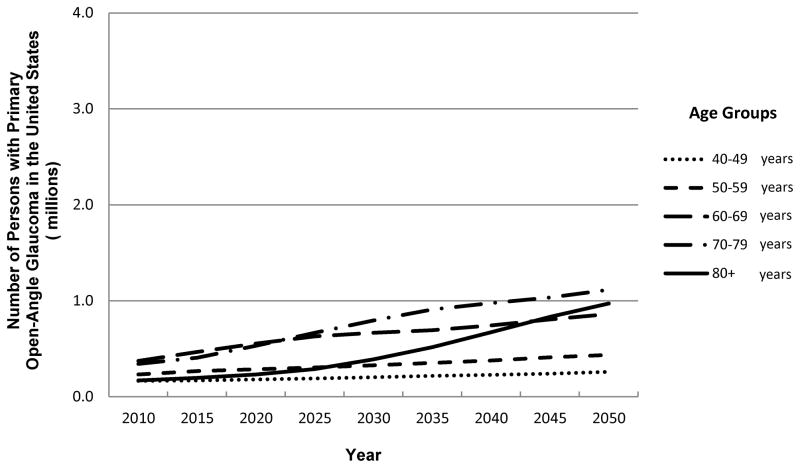
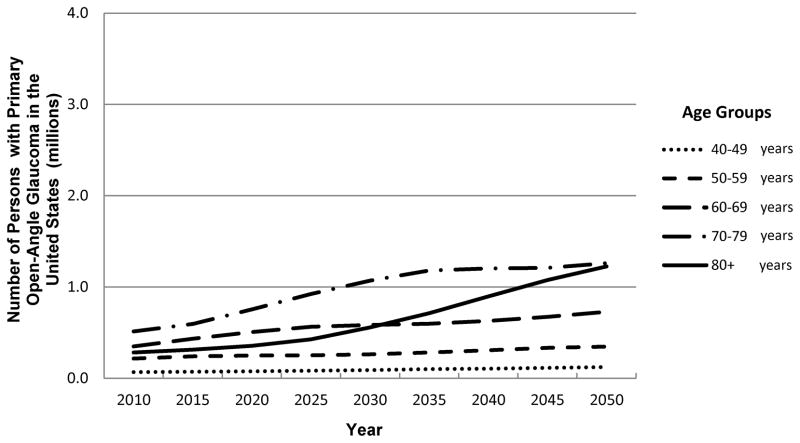
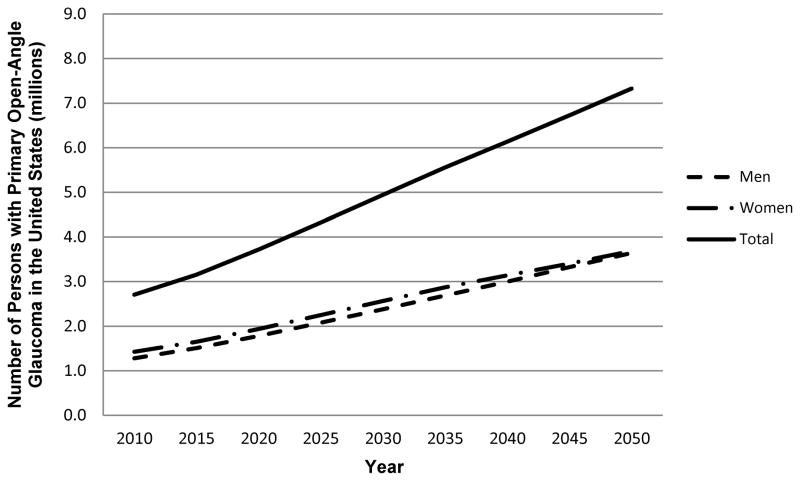
In 2011, 2.71 million persons in the US have POAG. The largest number of persons with POAG is among those aged 70–79 (31%), followed by those aged 60–69 (27%), aged 50–59 (17%), aged 80 and older (17%), and aged 40–49 (8%). (Table 2 and Fig 1). Women with POAG outnumber men with POAG by 11% (Table 3, Fig 2). In terms of race/ethnicity, non-Hispanic whites (44%) constitute the largest number of persons with POAG in the US. (Table 3, Fig 3). Overall, non-Hispanic white women make up 25% of the current estimate, and non-Hispanic white women aged 70 years and older make up the single largest demographic group of this current estimate.
Table 2.
Projected number of persons with Primary Open-angle Glaucoma in the US stratified by age group from 2011 to 2050 (in millions)
| Age Group | 2011 | 2015 | 2020 | 2025 | 2030 | 2035 | 2040 | 2045 | 2050 |
|---|---|---|---|---|---|---|---|---|---|
| 40–49 years | 0.23 | 0.24 | 0.25 | 0.27 | 0.29 | 0.32 | 0.33 | 0.35 | 0.38 |
| 50–59 years | 0.45 | 0.51 | 0.53 | 0.55 | 0.59 | 0.63 | 0.68 | 0.74 | 0.78 |
| 60–69 years | 0.72 | 0.90 | 1.06 | 1.19 | 1.25 | 1.29 | 1.37 | 1.48 | 1.59 |
| 70–79 years | 0.85 | 1.00 | 1.28 | 1.59 | 1.86 | 2.09 | 2.18 | 2.24 | 2.38 |
| 80+ years | 0.45 | 0.51 | 0.59 | 0.71 | 0.95 | 1.23 | 1.57 | 1.91 | 2.20 |
| Total | 2.71 | 3.15 | 3.72 | 4.32 | 4.94 | 5.56 | 6.13 | 6.72 | 7.32 |
| Women/Men | 1.11 | 1.10 | 1.09 | 1.08 | 1.08 | 1.07 | 1.05 | 1.02 | 1.01 |
Figure 1.
Estimated number of primary open-angle glaucoma cases in the US by age group (all persons)
Table 3.
Estimated number of persons with Primary Open-angle Glaucoma in the United States stratified by Race/Ethnicity and Sex from 2011 to 2050 (in millions)
| 2011 | 2015 | 2020 | 2025 | 2030 | 2035 | 2040 | 2045 | 2050 | |
|---|---|---|---|---|---|---|---|---|---|
| Non-Hispanic White | |||||||||
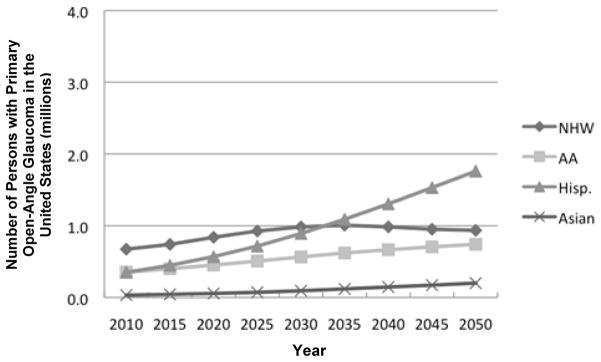
| Women | 0.67 | 0.74 | 0.84 | 0.93 | 0.98 | 1.01 | 0.98 | 0.95 | 0.94 |
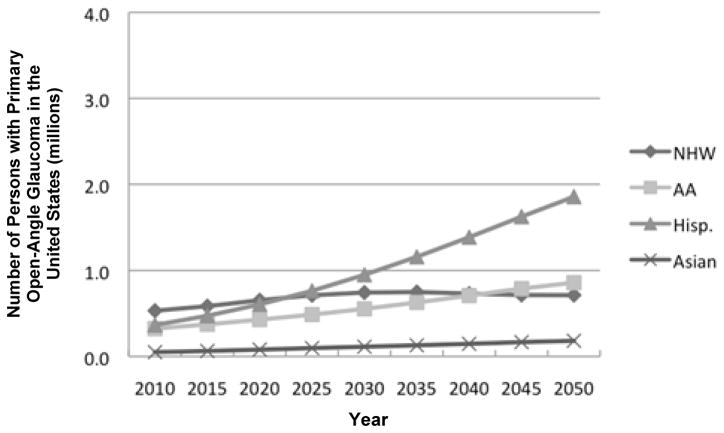
| Men | 0.53 | 0.58 | 0.65 | 0.71 | 0.74 | 0.75 | 0.73 | 0.71 | 0.71 |
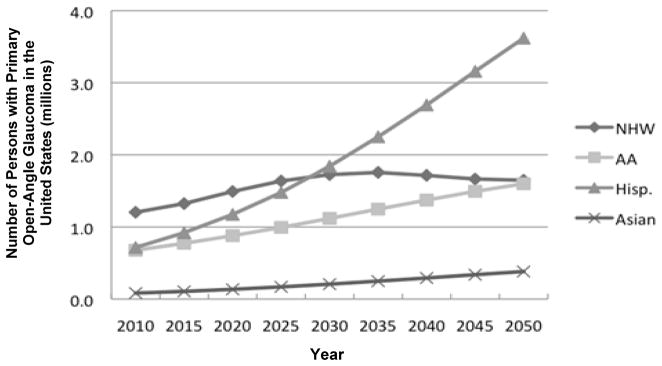
| Total | 1.20 | 1.32 | 1.49 | 1.64 | 1.73 | 1.76 | 1.72 | 1.67 | 1.65 |
| African American | |||||||||
| Women | 0.35 | 0.40 | 0.45 | 0.51 | 0.57 | 0.62 | 0.67 | 0.71 | 0.74 |
| Men | 0.32 | 0.37 | 0.43 | 0.49 | 0.55 | 0.63 | 0.71 | 0.79 | 0.86 |
| Total | 0.68 | 0.77 | 0.88 | 0.99 | 1.12 | 1.25 | 1.37 | 1.49 | 1.60 |
| Hispanic/Latino | |||||||||
| Women | 0.35 | 0.45 | 0.57 | 0.72 | 0.89 | 1.09 | 1.30 | 1.53 | 1.76 |
| Men | 0.36 | 0.47 | 0.60 | 0.76 | 0.95 | 1.16 | 1.39 | 1.63 | 1.86 |
| Total | 0.72 | 0.92 | 1.17 | 1.48 | 1.84 | 2.25 | 2.69 | 3.16 | 3.62 |
| Asian | |||||||||
| Women | 0.03 | 0.04 | 0.06 | 0.07 | 0.09 | 0.12 | 0.15 | 0.17 | 0.20 |
| Men | 0.05 | 0.06 | 0.08 | 0.10 | 0.11 | 0.13 | 0.15 | 0.17 | 0.18 |
| Total | 0.08 | 0.11 | 0.13 | 0.17 | 0.21 | 0.25 | 0.29 | 0.34 | 0.38 |
| Other Minorities | |||||||||
| Women | 0.02 | 0.02 | 0.02 | 0.02 | 0.03 | 0.03 | 0.04 | 0.04 | 0.04 |
| Men | 0.01 | 0.01 | 0.01 | 0.02 | 0.02 | 0.02 | 0.02 | 0.03 | 0.03 |
| Total | 0.03 | 0.03 | 0.04 | 0.04 | 0.05 | 0.06 | 0.06 | 0.07 | 0.07 |
Figure 2.
Estimated number of primary open-angle glaucoma cases in the US by age group (men)
Figure 3.
Estimated number of primary open-angle glaucoma cases in the US by age group (women)
Projected Estimates of Persons with POAG in the US from 2011–2050
In 2050, an estimated 7.32 million persons are projected to have POAG (an increase of 270% from current estimates, whereas the overall US population will increase only 150% from its current estimate). A higher proportion of the number of persons with POAG will be those aged 70–79 (32%), followed by persons aged 80 years and older (30%), 60–69 years (22%), 50–59 years (11%) and 40–49 years (5%). (Table 2, Fig 1). Women will outnumber men by a smaller proportion (1%) than currently (11%) (Table 3, Fig 2). By 2035, the single largest demographic group will consist of Hispanic/Latino men aged 70 years and older. Finally, in 2050, Hispanics/Latinos will make up 50% of the projected number and constitute the largest group of persons with POAG compared to non-Hispanic whites (currently, the largest proportion); and Hispanic/Latino men will outnumber non-Hispanic white women (currently, women outnumber men) (Table 3, Fig 3).
Geographic Distributions from 2011–2050
The following summarizes geographic changes from current to future projected numbers of persons with POAG distribution in the US from 2011–2050.
Current Geographic Distribution
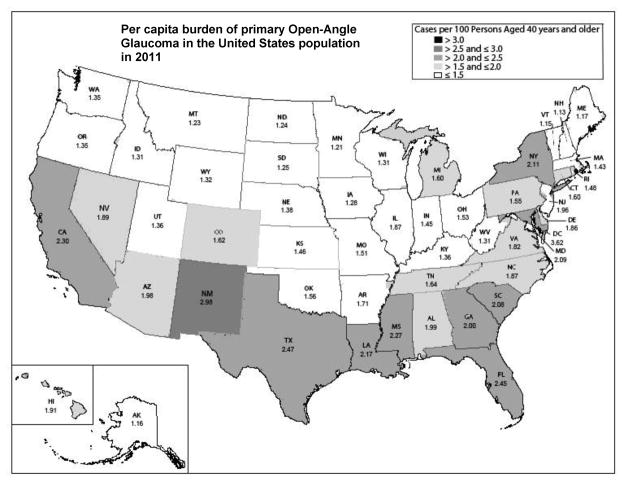
Currently by state, California, Texas, and Florida have the highest estimated numbers of persons with POAG (0.36, 0.24, and 0.23 million, respectively). By state, the three highest per capita burden of POAG are in New Mexico, Texas, and Florida (2.98%, 2.47%, and 2.45%, respectively, Fig 4A). By region, the majority (40%) of all persons with POAG in the US will be located in the Southern region, followed by 22% in the West, 17% in the Midwest and 17% in the Northeast regions (Table 4). Furthermore, the highest per capita burden of POAG by region is in the South (2.10%), followed by West (1.99%), Northeast (1.77%) and Midwest (1.53%). By sex, women outnumber men in every region. By race/ethnicity, the highest estimated numbers are among non-Hispanic whites in all regions except the West, where Hispanics/Latinos are the major contributor (Table 4). Specifically, non-Hispanic white women are the major contributors in every region except the West, where the major contributors are Hispanic/Latino men.
Figure 4.
Estimated number of persons with primary open-angle glaucoma in the US by sex.
Table 4.
Numbers of persons with Primary Open-angle Glaucoma in the US stratified by race/ethnicity, gender and region in 2011 and 2050 (in thousands)
| In 2011 | Northeast | Midwest | South | West | ||||
|---|---|---|---|---|---|---|---|---|
| Women | Men | Women | Men | Women | Men | Women | Men | |
| Non Hispanic White | 136.7 | 102.3 | 168.0 | 130.0 | 237.0 | 183.7 | 125.3 | 102.5 |
| African American | 59.4 | 52.0 | 59.9 | 55.0 | 188.2 | 171.4 | 27.7 | 28.9 |
| Asian American | 5.7 | 9.8 | 2.8 | 4.6 | 5.4 | 9.0 | 20.6 | 23.7 |
| Hispanic | 53.9 | 51.2 | 22.4 | 27.3 | 129.3 | 134.3 | 130.0 | 140.1 |
| Other Minorities | 0.7 | 0.4 | 1.4 | 0.9 | 3.1 | 2.1 | 4.9 | 3.2 |
| Total | 256.3 | 215.6 | 254.4 | 217.8 | 563.0 | 500.5 | 308.5 | 298.3 |
| Region Total | 471.9 | 472.2 | 1063.5 | 606.8 | ||||
| In 2050 | Northeast | Midwest | South | West | ||||
|---|---|---|---|---|---|---|---|---|
| Women | Men | Women | Men | Women | Men | Women | Men | |
| Non Hispanic White | 192.6 | 137.3 | 235.0 | 172.7 | 329.7 | 246.8 | 173.4 | 136.8 |
| African American | 127.1 | 142.2 | 126.6 | 151.3 | 393.1 | 458.6 | 58.0 | 77.0 |
| Asian American | 34.7 | 35.4 | 16.6 | 16.3 | 32.2 | 32.4 | 135.3 | 91.2 |
| Hispanic | 273.2 | 260.3 | 110.1 | 135.4 | 673.2 | 712.2 | 657.2 | 714.9 |
| Other Minorities | 2.0 | 1.3 | 3.9 | 2.6 | 8.9 | 6.1 | 13.7 | 9.1 |
| Total | 629.6 | 576.4 | 492.3 | 478.4 | 1437.1 | 1456.2 | 1037.6 | 1029.0 |
| Region Total | 1206.0 | 970.7 | 2893.3 | 2066.5 | ||||
Geographic variations of the current and projected estimates of Persons with POAG in the US
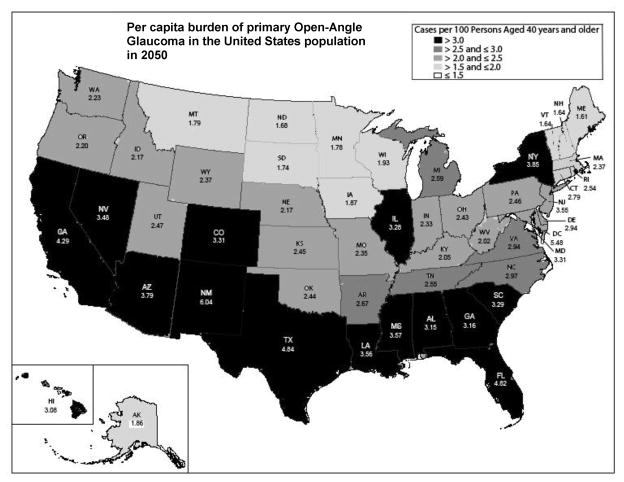
In 2050, the three highest projected numbers will be in California, Texas, and Florida (1.35, 0.88, and 0.76 million, respectively). By state, the three highest per capita POAG rates will be in New Mexico, Texas, and Florida (6.04%, 4.84% and 4.82%, respectively, Fig 4B). Of note, the per capita burden in these three states is estimated to double by 2050 compared to the current per capita rate. By region, the majority (40%) of all persons with POAG in the US will remain in the Southern region, followed by 28% in the West, 16% in the Northeast and 13% in the Midwest regions (Table 4). By region, the highest per capita burden of POAG is in the South (3.82%) and the West (3.82%), followed by the Northeast (3.16%) and Midwest (2.49%). The projected per capita burden by region will increase by 1.6 to 1.9 fold.
Sensitivity analysis (Table 5) showed that, compared to the main model, the estimates using the Eye Disease Prevalence Research Group pooled rates for non-Hispanic whites (scenario 1) were higher by 13% and 9% for 2011 and 2050, respectively. In addition, the estimates using pooled prevalence rates from the Proyecto VER and LALES for Hispanics/Latinos (scenario 2) were lower by 19% and 15% for 2011 and 2050, respectively. Lastly, the estimates using the Eye Disease Prevalence Research Group rates for Asians (scenario 3) were lower by 0.2% and 0.3% for 2011 and 2050, respectively.
Table 5.
Sensitivity analysis showing the proportional change (compared to the primary analysis) in the numbers of persons with primary open-angle glaucoma in the United States when using data from different studies.
| Scenario | Non-Hispanic White | African American | Hispanic/Latino | Asian | Other Minorities | % Difference in 2011 | % Difference in 2050 |
|---|---|---|---|---|---|---|---|
| Primary Analysis model | BES | BES | LALES | Singapore Study | EDPRGb | Reference | Reference |
| Scenario 1 | EDPRGa | BES | LALES | Singapore Study | EDPRGb | +13% | +9% |
| Scenario 2 | BES | BES | LALES and Proyecto | Singapore Study | EDPRGb | −19% | −15% |
| Scenario 3 | BES | BES | LALES | EDPRGb | EDPRGb | −0.2% | −0.3% |
BES, Baltimore Eye Survey; LALES, the Los Angeles Latino Eye Study; EDPRG, the Eye Disease Prevalence Research Group.
A pooled prevalence from the combined data for European-derived non-Hispanic whites including the Baltimore Eye Survey, the Blue Mountains Eye Study, the Beaver Dam Eye Study, the Rotterdam Study, and the Melbourne Visual Impairment Project was used.
the un-weighted average of the pooled stratum-specific prevalence rates for non-Hispanic Whites, African Americans and Hispanics was used.
Discussion
The estimated current number of persons with POAG in the US is 2.71 million, with the highest estimates among individuals aged 70 and older, women, and non-Hispanic whites. Our model predicts a large increase in the number of persons with POAG and a shift in the number of persons with POAG among sex and racial/ethnic subpopulations in the US over the next 40 years. In brief, the number of persons with POAG is estimated to increase by 28% per decade, from 2.71 million in 2011 to 7.32 million in 2050. The populations aged 60 and older, especially women aged 70 and older, contribute significantly to the rising number. During this period, women with POAG will outnumber men with POAG by a lesser degree. Based on race/ethnicity, the highest estimated number of persons with POAG will shift from non-Hispanic white women to Hispanic/Latino men by 2035.
Compared to a previous study, 2 the Eye Disease Prevalence Research Group estimated that the number of persons with POAG in the US will rise 22% per decade, from 2.22 million in 2000 to 3.36 million in 2020. Our analysis predicted an 11% higher number of persons with POAG in 2020 (3.72 million). The discrepancy is most likely due to differences in the methods and use of underlying data sources. First, the Eye Disease Prevalence Research Group utilized the 2020 projection based on the 2000 US census, whereas our estimations used population projections based on the 2009 updated version of the 2000 US census.18 Briefly, the 2009 version provides projections adjusted for changes in births, deaths, and net gain in international migration. Second, different population-based studies were selected to estimate the number of persons with POAG. Specifically, the Eye Disease Prevalence Research Group used the pooled prevalence rates from the combined data for European-derived non-Hispanic whites, while the present forecast used prevalence rates from the Baltimore Eye Survey, a population-based study of non-Hispanic whites in the US. In addition, the Eye Disease Prevalence Research Group selected a population-based study of Mexican-derived Hispanics/Latinos from Arizona,12 whereas our calculation was based on the LALES, a population-based study of Latinos of Mexican ancestry in California.4 Of note, the prevalence of POAG in Hispanics/Latinos used in our study was higher than that used in the Eye Disease Prevalence Research Group (4.74% vs 1.97%).2, 4, 12 The difference in POAG prevalence between the two studies might be due to the higher proportion of Native Americans included in the Proyecto VER (40% in the Proyecto VER vs 5.3% in LALES) and different criteria used for POAG diagnosis. Specifically, the Proyecto VER used diagnostic criteria that might lead to underestimation of the prevalence. For instance, POAG diagnostic criteria based solely on structural changes were used in all selected studies. In the Baltimore Eye Survey, 15.6% and 8% of all POAG cases were diagnosed based on structural criteria only for non-Hispanic whites and African Americans, respectively. Likewise, these criteria were used in 19.2% of all POAG cases in the LALES, and in 59.1% of all POAG cases in the Singapore Study.4, 5, 10 However, compared to the selected studies the Proyecto VER included only 1.1% of cases based primarily on the structure criteria.”12 Finally, different methods were used to calculate estimated numbers of POAG for Asians. The Eye Disease Prevalence Research Group used the unweighted average of the pooled data age- and sex-specific rates for non-Hispanic whites, African Americans, and Hispanics/Latinos, whereas our analyses used data from the selected population survey in Singapore.2 All aforementioned reasons are likely to account for the difference in the POAG estimates reported by the Eye Disease Prevalence Research Group and our study.
Demographic Changes from 2011–2050
We determined how age, sex and race/ethnicity contribute to the demographic changes in the number of persons with POAG in the US from 2011–2050.
Contribution of Age-related differences
The high burden of POAG among aging populations is most likely due to a combination of high prevalence rates of POAG among the elderly and the rapid growth in aging populations. Specifically, increased age is a known risk factor for POAG.2, 5, 10, 12, 19–21 In addition, the population aged 65 and older is increasing at a faster rate than the total population, according to the National Center for Health Statistics.3 Furthermore, Baby Boomers (those born between 1946–1964) will be 65 years and older by 2029; and as they age, the population aged over 75 years will rise significantly.3 Specifically, the population aged over 75 years will rise from 6% of total population in 2006 to 9% by 2030 and 12% by 2050.3 Our analysis estimated that the number of people aged 70 years and older with POAG will rise from 1.31 million in 2011 to 4.57 million by 2050. These aging populations will require significant national resources, and attention should be directed toward this group.
Contribution of Sex-related differences
Women with POAG outnumber men with POAG in the world and in the US.1, 2 In addition, the highest POAG burden is among women aged 70 and older. This observation reflects a longer life expectancy in women compared to men (75.65 years in men and 80.69 years in women).22 Although there is no sex predilection for POAG,2, 8–10, 12, 19, 23–28 given that women have a longer life expectancy, our analysis shows that currently, a greater number of women have POAG compared to men. Thus, to prevent blindness, early treatment and more aggressive therapy should be considered and offered to elderly women for two reasons. First, in light of their longer life expectancy women are likely to bear the burden of vision loss for a longer period of time. Second, a gender disparity in the management of POAG exists, with women being 24% less likely to be treated for glaucoma and newly diagnosed women being less likely to fill their glaucoma medication prescriptions and to undergo laser/glaucoma therapy.29 In contrast to the current situation, over the next four decades the sex differences in the percentages of the number of persons with POAG will become smaller (11% difference in 2011 vs 1% difference in 2050). This most likely reflects an increasing life expectancy in men, particularly among Hispanic/Latino men.
Contribution of Race/Ethnicity-related differences
Although the prevalence of POAG is highest among African Americans and Hispanics/Latinos (Table 1), non-Hispanic whites contribute the greatest estimated number because of the high number of elderly non-Hispanic white women in the US. Our analysis predicts that the largest estimated number of persons with POAG will change from non-Hispanic whites to Hispanics/Latinos between 2011 and 2050. By 2035, Hispanic/Latino men will be the major US subpopulation with POAG. There are several factors that might explain this rapid growth. Hispanics/Latinos are the fastest growing US minority.3, 16 Specifically, the number of Hispanics/Latinos increased by 37% whereas the non-Hispanic population increased by only 5%. The rapid growth of Hispanics/Latinos is due to multiple causes based on data from the census. First, the fertility rate in Hispanics/Latinos is higher than in the overall population.17 Second, Hispanics/Latinos have longer life expectancy compared to the “other race” group. 17 Third, Hispanics/Latinos constitute the majority of immigrants.16 Overall, the increase in the Hispanic/Latino population is mainly due to natural growth rather than international immigration.30 The majority-minority cross-over has been predicted by the census to occur between 2040–2050. 30 Related to this, our analysis predicts that the majority-minority cross-over of the number of persons of POAG would occur in 2035. This shift is most likely driven by the high life expectancy of the first waves of Hispanic/Latino immigrants starting in 1970–1980 rather than being influenced by the added number from the young immigrants (typically younger than 35 years of age).31,32 In addition, based on US Census projections, the non-Hispanic white population aged 40 years and older in the US begins to decline in 2035.16
Particular attention should be focused on Hispanics/Latinos for two reasons: First, Hispanics/Latinos will contribute the highest estimated number of persons with POAG in the next four decades. Second, Hispanics/Latinos may have less access to health care compared to other demographic groups, such as non-Hispanic whites and Asians.3 Furthermore, based on previous reports, Hispanics/Latinos have the highest number of persons with undetected POAG (75% in Hispanics/Latinos, 50% in non-Hispanic whites, and 58% in African Americans). In 2011, the estimated numbers of persons with undetected POAG for Hispanics/Latinos, non-Hispanic whites, and African Americans are 0.54, 0.60, and 0.39 million, respectively. Because of the rapid growth and high prevalence of POAG among Hispanics/Latinos, the number of persons with undetected POAG is projected to be 2.72 million, compared to 0.83 for non-Hispanic whites and 0.93 million for African Americans in 2050.
Geographic Changes in the per capita burden of POAG in the US from 2011–2050
This forecast is unique in that we calculated the total and per capita burden of POAG by state to further assess the current and future geographic variations. In brief, the current estimated number of persons with POAG is highest in California, Texas, Florida, and the South, whereas the per capita burden of POAG is highest in New Mexico, Texas, and Florida and in the South. In 2050, the highest POAG estimates will remain in California, Texas, Florida, and the South. Similarly, the per capita burden of POAG will remain highest in New Mexico, Texas, and Florida; however the per capita burden will double in these states. Specifically, the per capita burden will increase from 2.5%–3% in 2011 to 5%–6% in 2050. This is most likely due to the high proportion of elderly and Hispanics/Latinos in these states. Finally, the West will join the South among the regions with the highest per capita burden of POAG. Based on this forecast, screening programs for POAG are likely to have the highest yield by targeting these states and regions that have highest per capita burden.
For the next 40 years, the US Asian population will continue to rise at a much faster rate compared to the overall population (a 200% increase in the Asian population vs a 10% increase in the overall population).15, 16 However, while there is a rapid increase in the size of the US Asian population our sensitivity analysis indicates a less than 1% difference in the total estimated number of persons with POAG using different prevalence rates for Asian in the US. As the Asian population in the US continues to grow, using prevalence rates from the population-based study of US Asians will most likely improve the accuracy of future projections. In addition, our sensitivity analysis showed that if the pooled rates from the Eye Disease Prevalence Research Group were used for non-Hispanic whites, the estimates would be about 10% higher, compared to the primary model. However, if the pooled rates from the Proyecto VER and LALES were used for Hispanics/Latinos, the estimates would be approximately 15% to 19% lower, compared to the primary model. This again emphasizes the importance of selecting the proper studies to represent each racial/ethic group, especially for groups that will have a higher impact, such as Hispanics/Latinos. Nevertheless, either using the primary model (LALES for Hispanics/Latinos) or a pooled rate from the Proyecto VER and LALES for Hispanics/Latinos (scenario #2, Table 5), a majority of persons with POAG in 2050 will be Hispanics/Latino.
Study Limitations
Our study has several limitations. Similar to other forecasts, there are embedded uncertainties.33 First, inherent errors in our data from selected studies and/or in the US census may lead to differences in our predictions and to what in fact happens in the future.33 For instance, our calculation was performed with an assumption that age-, sex- and racial/ethnic-specific prevalence rates would not alter with time. Furthermore, our model did not account for any changes in future treatment/prevention of POAG that could substantially affect the prevalence rates of POAG. In addition, race/ethnicity and age used in the census are self-reported. The self-report is the current standard for race/ethnicity identification in the census, as well as in all published studies. The most commonly used measure of the accuracy of census projection is the mean absolute percentage error (MAPE), which is the difference between the projections and the true census counts. The overall MAPE for the US was 2.64%.34 Regardless of the possible embedded uncertainties, the census is the best data available and is commonly used for all US government and UN and WHO projections. Second, standardized criteria for POAG diagnosis are still lacking. We therefore carefully selected the representative studies for each racial/ethic group based on the similar criteria. Third, the number of persons with POAG in those who self-reported “mixed race” was not included for two reasons. It is not certain which race/ethnic specific prevalence rate is appropriate in the mixed race persons. Furthermore, we decided to err towards underestimation by not including this subpopulation. Specifically, the persons who reported mixed race make up 1.7% of the US population in 2011 and 3.6% of the total population in 2050. Regardless of these limitations and inherent uncertainty, the present study provides the estimated numbers and trends of the US populations with POAG from 2011–2050 from currently available resources.
In conclusion, contrary to current perceptions, the highest estimated number of persons with POAG is among non-Hispanic white women, despite the high prevalence rates of POAG in African Americans and Hispanics/Latinos. However, the greatest burden of POAG in the US is projected to shift from non-Hispanic whites to Hispanics/Latinos and from non-Hispanic white women to Hispanic/Latino men by 2035. While the largest burden exists in the populous states, screening yield will be higher in those states with the higher per capita burden of POAG. Specifically, the demographic shift from non-Hispanic white women to Hispanic/Latino men suggests that states and regions with larger Hispanic/Latino populations will bear the larger share of future burden of POAG.
From practical standpoint, the current recommendations for glaucoma screening by American Academy of Ophthalmology target populations at risk, including elderly, individuals with a family history of glaucoma, and African Americans and Hispanics/Latinos. Similarly, Medicare and Medicaid cover glaucoma examinations for individuals with diabetes, a family history of glaucoma, African Americans aged 50 years and older, and Hispanic/Latino Americans aged 65 years and older. Given that the highest number of persons with POAG in the US currently are amongst non-Hispanic white women screening programs should also be targeted at this population. Finally, given a projected highest per capita burden of POAG is in New Mexico, Texas, and Florida, the greatest yield from the current and future screening and intervention programs are likely to be in these states.
Figure 5.
Estimated number of primary open-angle glaucoma cases in the US by race/ethnicity (all persons). NHW=Non-Hispanic White; AA= African American; Hisp.= Hispanic/Latino.
Figure 6.
Estimated number of primary open-angle glaucoma cases in the US by race/ethnicity (men). NHW=Non-Hispanic White; AA= African American; Hisp.= Hispanic/Latino.
Figure 7.
Estimated number of primary open-angle glaucoma cases in the US by race/ethnicity (women). NHW=Non-Hispanic White; AA= African American; Hisp.= Hispanic/Latino.
Figure 8.
Per capita burden of Open-Angle Glaucoma in each state in the United States in 2011
Figure 9.
Per capita burden of Open-Angle Glaucoma in each state in the United States in 2050
Acknowledgments
Funding/Support: National Eye Institute EY 11753 (RV), Bethesda, MD, and K12HD055892 (TSV) (National Institute of Child Health and Human Development and the Office of Research on Women’s Health), Bethesda, MD.
Other Acknowledgements: We would like to thank Joanne Katz, ScD, MS, Baltimore, MD; James Tielsch, PhD, Baltimore, MD; and Tien Wong, MD, PhD, Singapore; for providing us unpublished data from their studies.
Biography

Thasarat S. Vajaranant, MD is an Assistant Professor in the Department of Ophthalmology and Visual Sciences, University of Illinois at Chicago. She is a recipient of the AAO Achievement Award, a career development award from the K12 program (BIRCWH) and a Young Clinician-Scientist Award from the American Glaucoma Society. She has also been named the Best Doctor in American and Castle Connelly’s America Top Doctor. Her research interest involves glaucoma epidemiology and women’s eye health.
Footnotes
Financial Disclosures: None
Contributions to Authors in each of these areas: design and conduct of the study (RV, TSV, SW); collection (TSV, SW), analysis (SW), and interpretation of the data (RV, TSV, SW); and preparation (TSV, SW), review (RV, TSV, MT), or approval of the manuscript (RV).
Statement about Conformity with Author Information: The IRB waived the need for IRB approval of this cross-sectional study.
Publisher's Disclaimer: This is a PDF file of an unedited manuscript that has been accepted for publication. As a service to our customers we are providing this early version of the manuscript. The manuscript will undergo copyediting, typesetting, and review of the resulting proof before it is published in its final citable form. Please note that during the production process errors may be discovered which could affect the content, and all legal disclaimers that apply to the journal pertain.
References
- 1.Quigley HA, Broman AT. The number of people with glaucoma worldwide in 2010 and 2020. Br J Ophthalmol. 2006;90(3):262–267. doi: 10.1136/bjo.2005.081224. [DOI] [PMC free article] [PubMed] [Google Scholar]
- 2.Friedman DS, Wolfs RC, O’Colmain BJ, et al. Prevalence of open-angle glaucoma among adults in the United States. Arch Ophthalmol. 2004;122(4):532–538. doi: 10.1001/archopht.122.4.532. [DOI] [PMC free article] [PubMed] [Google Scholar]
- 3.National Center for Health Statistics. Health, United States, 2008 With Special Feature on the Health of Young Adults. Hyattsville, Md: Dept. of Health and Human Services; 2009. [Accessed January 31, 2012]. Available at: http://www.cdc.gov/nchs/data/hus/hus08.pdf. [PubMed] [Google Scholar]
- 4.Varma R, Ying-Lai M, Francis BA, et al. Prevalence of open-angle glaucoma and ocular hypertension in Latinos: the Los Angeles Latino Eye Study. Ophthalmology. 2004;111(8):1439–1448. doi: 10.1016/j.ophtha.2004.01.025. [DOI] [PubMed] [Google Scholar]
- 5.Foster PJ, Oen FT, Machin D, et al. The prevalence of glaucoma in Chinese residents of Singapore: a cross-sectional population survey of the Tanjong Pagar district. Arch Ophthalmol. 2000;118(8):1105–1111. doi: 10.1001/archopht.118.8.1105. [DOI] [PubMed] [Google Scholar]
- 6.Shen SY, Wong TY, Foster PJ, et al. The prevalence and types of glaucoma in Malay people: the Singapore Malay eye study. Invest Ophthalmol Vis Sci. 2008;49(9):3846–3851. doi: 10.1167/iovs.08-1759. [DOI] [PubMed] [Google Scholar]
- 7.Wang YX, Xu L, Yang H, Jonas JB. Prevalence of glaucoma in North China: the Beijing Eye Study. Am J Ophthalmol. 2010;150(6):917–924. doi: 10.1016/j.ajo.2010.06.037. [DOI] [PubMed] [Google Scholar]
- 8.Leibowitz HM, Krueger DE, Maunder LR, et al. The Framingham Eye Study monograph: An ophthalmological and epidemiological study of cataract, glaucoma, diabetic retinopathy, macular degeneration, and visual acuity in a general population of 2631 adults, 1973–1975. Surv Ophthalmol. 1980;24(Suppl):335–610. [PubMed] [Google Scholar]
- 9.Klein BE, Klein R, Sponsel WE, et al. Prevalence of glaucoma. The Beaver Dam Eye Study. Ophthalmology. 1992;99(10):1499–1504. doi: 10.1016/s0161-6420(92)31774-9. [DOI] [PubMed] [Google Scholar]
- 10.Tielsch JM, Sommer A, Katz J, Royall RM, Quigley HA, Javitt J. Racial variations in the prevalence of primary open-angle glaucoma. The Baltimore Eye Survey. JAMA. 1991;266(3):369–374. [PubMed] [Google Scholar]
- 11.Friedman DS, Jampel HD, Muñoz B, West SK. The prevalence of open-angle glaucoma among blacks and whites 73 years and older: the Salisbury Eye Evaluation Glaucoma Study. Arch Ophthalmol. 2006;124(11):1625–1630. doi: 10.1001/archopht.124.11.1625. [DOI] [PubMed] [Google Scholar]
- 12.Quigley HA, West SK, Rodriguez J, Munoz B, Klein R, Snyder R. The prevalence of glaucoma in a population-based study of Hispanic subjects: Proyecto VER. Arch Ophthalmol. 2001;119(12):1819–1826. doi: 10.1001/archopht.119.12.1819. [DOI] [PubMed] [Google Scholar]
- 13.Barnes JS, Bennett CE. The Asian Population. [Accessed January 31, 2012];Census 2000 Brief. 2000 Available at: http://www.census.gov/prod/2002pubs/c2kbr01-16.pdf.
- 14.Economist Intelligence Unit’s quality-of-life index. [Accessed January 31, 2012];The World in 2005. Available at: http://www.economist.com/media/pdf/QUALITY_OF_LIFE.pdf.
- 15. [Accessed January 31, 2012];Healthcare financing framework in Singapore. Available at: http://mycpf.cpf.gov.sg/CPF/my-cpf/Healthcare/PvdHC2.htm.
- 16.US Census Bureau. U.S. Population Projections. [Accessed January 31, 2012];Methodology Statement for the 2008 National Projections: United States Population Projections by Age, Sex, Race, and Hispanic Origin: July 1, 2000–2050. Available at: http://www.census.gov/population/www/projections/methodstatement08.html.
- 17.Day JC. National Population Projections. I. US Census Bureau, Population Division and Housing and Household Economic Statistics Division; [Accessed January 31, 2012]. Population Profile of the United States. Available at: http://www.census.gov/population/www/pop-profile/files/p23-189.pdf. [Google Scholar]
- 18.U.S. Census Bureau. [Accessed January 31, 2012];National Population Projections Released 2008 (Based on Census 2000) Available at: http://www.census.gov/population/www/projections/summarytables.html.
- 19.Mitchell P, Smith W, Attebo K, Healey PR. Prevalence of open-angle glaucoma in Australia. The Blue Mountains Eye Study. Ophthalmology. 1996;103(10):1661–1669. doi: 10.1016/s0161-6420(96)30449-1. [DOI] [PubMed] [Google Scholar]
- 20.Wolfs RC, Borger PH, Ramrattan RS, et al. Changing views on open-angle glaucoma: definitions and prevalences--The Rotterdam Study. Invest Ophthalmol Vis Sci. 2000;41(11):3309–3321. [PubMed] [Google Scholar]
- 21.Wensor MD, McCarty CA, Stanislavsky YL, Livingston PM, Taylor HR. The prevalence of glaucoma in the Melbourne Visual Impairment Project. Ophthalmology. 1998;105(4):733–739. doi: 10.1016/S0161-6420(98)94031-3. [DOI] [PubMed] [Google Scholar]
- 22.Central Intelligence Agency. The World Factbook. [Accessed January 31, 2012];Life expectancy at birth. Available at: https://www.cia.gov/library/publications/the-world-factbook/fields/2102.html.
- 23.Vajaranant TS, Nayak S, Wilensky JT, Joslin CE. Gender and glaucoma: what we know and what we need to know. Curr Opin Ophthalmol. 2010;21(2):91–99. doi: 10.1097/ICU.0b013e3283360b7e. [DOI] [PMC free article] [PubMed] [Google Scholar]
- 24.Dielemans I, Vingerling JR, Wolfs RC, Hofman A, Grobbee DE, de Jong PT. The prevalence of primary open-angle glaucoma in a population-based study in The Netherlands. The Rotterdam Study. Ophthalmology. 1994;101(11):1851–1855. doi: 10.1016/s0161-6420(94)31090-6. [DOI] [PubMed] [Google Scholar]
- 25.de Voogd S, Ikram MK, Wolfs RC, Jansonius NM, Hofman A, de Jong PT. Incidence of open-angle glaucoma in a general elderly population: the Rotterdam Study. Ophthalmology. 2005;112(9):1487–1493. doi: 10.1016/j.ophtha.2005.04.018. [DOI] [PubMed] [Google Scholar]
- 26.Leske MC, Wu SY, Hennis A, Honkanen R, Nemesure B BESs Study Group. Risk factors for incident open-angle glaucoma: the Barbados Eye Studies. Ophthalmology. 2008;115(1):85–93. doi: 10.1016/j.ophtha.2007.03.017. [DOI] [PubMed] [Google Scholar]
- 27.Rudnicka AR, Mt-Isa S, Owen CG, Cook DG, Ashby D. Variations in primary open-angle glaucoma prevalence by age, gender, and race: a Bayesian meta-analysis. Invest Ophthalmol Vis Sci. 2006;47(10):4254–4261. doi: 10.1167/iovs.06-0299. [DOI] [PubMed] [Google Scholar]
- 28.Doshi V, Ying-Lai M, Azen SP, Varma R Los Angeles Latino Eye Study Group. Sociodemographic, family history, and lifestyle risk factors for open-angle glaucoma and ocular hypertension. The Los Angeles Latino Eye Study. Ophthalmology. 2008;115(4):639–647.e2. doi: 10.1016/j.ophtha.2007.05.032. [DOI] [PubMed] [Google Scholar]
- 29.Friedman DS, Nordstrom B, Mozaffari E, Quigley HA. Variations in treatment among adult-onset open-angle glaucoma patients. Ophthalmology. 2005;112(9):1494–1499. doi: 10.1016/j.ophtha.2005.02.010. [DOI] [PubMed] [Google Scholar]
- 30.Ortman JM, Guarneri CE. [Accessed January 31, 2012];United States Population Projections: 2000 to 2050. Available at: http://www.census.gov/population/www/projections/analytical-document09.pdf.
- 31.Dockterman D, Velasco G. Table 9a. Age and Gender Distributions for Nativity Groups: 2009 in the United States, 2009. Washington, DC: Pew Hispanic Center; 2010. [Accessed January 31, 2012]. Statistical portrait of Hispanics in the United States, 2008–2010. Available at: http://pewhispanic.org/files/factsheets/foreignborn2009/Table%209a.pdf. [Google Scholar]
- 32.Pew Hispanic Center. [Accessed January 31, 2012];The Mexican American Boom – Births Overtake Immigration. Available at: http://pewhispanic.org/files/reports/144.pdf. Published July 14, 2011.
- 33.Rein DB, Wittenborn JS, Zhang X, et al. Forecasting age-related macular degeneration through the year 2050: the potential impact of new treatments. Arch Ophthalmol. 2009;127(4):533–540. doi: 10.1001/archophthalmol.2009.58. [DOI] [PubMed] [Google Scholar]
- 34.Wang C-L. Working Paper Series No 67. US Department of Commerce. Economic and Statistics Administration, US Census Bureau; [Accessed January 31, 2012]. Evaluation of Census Bureau’s 1995–2025 State Population Projections. Published October 2002. Available at: http://www.census.gov/population/www/documentation/twps0067/twps0067.pdf. [Google Scholar]


