

This report summarizes the advances in data acquisition, image reconstruction, and optimization processes that were identified by consensus as being necessary to achieve effective dose levels for routine CT that are well below background levels.
Abstract
This Special Report presents the consensus of the Summit on Management of Radiation Dose in Computed Tomography (CT) (held in February 2011), which brought together participants from academia, clinical practice, industry, and regulatory and funding agencies to identify the steps required to reduce the effective dose from routine CT examinations to less than 1 mSv. The most promising technologies and methods discussed at the summit include innovations and developments in x-ray sources; detectors; and image reconstruction, noise reduction, and postprocessing algorithms. Access to raw projection data and standard data sets for algorithm validation and optimization is a clear need, as is the need for new, clinically relevant metrics of image quality and diagnostic performance. Current commercially available techniques such as automatic exposure control, optimization of tube potential, beam-shaping filters, and dynamic z-axis collimators are important, and education to successfully implement these methods routinely is critically needed. Other methods that are just becoming widely available, such as iterative reconstruction, noise reduction, and postprocessing algorithms, will also have an important role. Together, these existing techniques can reduce dose by a factor of two to four. Technical advances that show considerable promise for additional dose reduction but are several years or more from commercial availability include compressed sensing, volume of interest and interior tomography techniques, and photon-counting detectors. This report offers a strategic roadmap for the CT user and research and manufacturer communities toward routinely achieving effective doses of less than 1 mSv, which is well below the average annual dose from naturally occurring sources of radiation.
© RSNA, 2012
Introduction
On February 24 and 25, 2011, more than 120 members of the computed tomography (CT) community gathered in Bethesda, Md, for a summit on the management of radiation dose in CT. Sponsored by the National Institute of Biomedical Imaging and Bioengineering, the Coalition for Imaging and Bioengineering Research, the National Institute of Child Health and Human Development, and the National Heart Lung and Blood Institute and supported by the U.S. Food and Drug Administration, the American College of Radiology, the American College of Cardiology, and the Academy of Radiology Research, the summit brought together participants from academia, clinical practice, industry, and regulatory and funding agencies to identify the steps required to reduce the effective dose from routine CT examinations to less than 1 mSv, which is below annual background levels of ionizing radiation.
To compare the amount of ionizing radiation from different types of exposures, such as naturally occurring sources and CT examinations, the quantity effective dose is used (1,2). Effective dose takes into account the complex distribution of dose to different organs and tissues, and the varying radiation sensitivities of these organs and tissues, to compute a single number that estimates the overall detriment from the exposure to a reference person within a general population. Defined by the International Commission for Radiation Protection, effective dose calculations use organ doses that are averaged across sex as well as tissue risk coefficients that are averaged across age (1,3,4). Thus, effective dose describes the radiation detriment from a specific source, such as radon, a CT examination, or chest radiography, as opposed to describing the dose received by any individual (4). Although scanner settings must be tailored to the size of the individual patient, effective dose is defined for scanner output values (volume CT dose index values) appropriate to an individual of similar size and shape as the International Commission for Radiation Protection’s reference person (a 70–80-kg adult) (5). This yields typical effective dose values of 1–2 mSv for routine head CT, less than 1 to 12 mSv for coronary CT angiography, 5–7 mSv for routine thoracic or abdominal CT, and 3–4 mSv for routine pelvic CT (6). Across all examination types, the average effective dose from a CT examination in the United States in 2006 was approximately 6.5 mSv (7).
The risk of harm from effective doses of less than 100 mSv is a highly controversial topic. At the effective doses associated with CT (approximately 1–12 mSv), the risks are extremely small or may in fact be zero (8,9). However, because the annual effective dose to the U.S. population from naturally occurring sources is, on average, 3 mSv (range, 1–10 mSv), and because no geographic correlation with cancer risk has been established between areas of lower and higher background radiation levels, summit organizers and attendees agreed that by reducing the effective doses associated with most routine CT examinations to a fraction of background dose levels we can reach a dose level at which long-term risks can be considered negligible. It was therefore the goal of this summit to determine the technologies and strategies that will result in routine CT being performed at or below an effective dose of 1 mSv, hence the phrase “submillisievert CT.”
In this report, we summarize the advances in data acquisition, image reconstruction, and optimization processes that were identified by consensus as being necessary to achieve effective dose levels for routine CT that are well below background levels. Some of these techniques are already commercially available, including automatic exposure control (10–12), automatic tube potential selection (13), beam-shaping filters, and dynamic z-axis collimators (14,15). Others, such as iterative reconstruction algorithms and noise reduction methods, are just becoming widely available (16–23). Together, these techniques can reduce dose by a factor of two to four (Table). Other technical advances that show considerable promise are also described, including PCDs and interior tomographic reconstruction algorithms; however, these are several years or more from commercial availability. Nonetheless, there are strategies to accelerate the adoption of existing dose reduction techniques, optimize scanning protocols, and validate emerging technologies. Chief among these are software tools to simulate protocols with lower dose settings and access to raw patient data. The following provides a strategic roadmap for the CT user and research and manufacturer communities for reducing dose by a factor of 10 relative to 64-row (and higher) CT systems (Fig 1), which, when accomplished, will result in routine CT scanning at effective doses of less than 1 mSv.
Estimated Reduction in Dose from Various Technical Advances
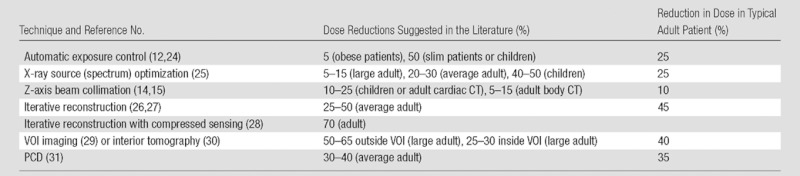
Note.—PCD = photon-counting detector, VOI = volume of interest.
Figure 1:

Bar chart shows anticipated reduction in dose owing to cumulative effect of various dose-reduction approaches for single-phase CT of the abdomen and pelvis. Data were obtained with the estimated percentage dose reductions given in the Table. For most multidetector CT (MDCT) systems with at least 64 detector rows, the effective dose to a reference adult (∼70–80 kg) is estimated to be 10 mSv. With addition of automatic exposure control systems that modulate tube current according to patient attenuation, the estimated dose reduction for a typical adult is 25%, reducing the effective dose from single-phase CT of the abdomen and pelvis to 7.5 mSv. Use of optimal x-ray spectra would further decrease effective dose by 25% to 5.6 mSv. Each successive dose-reduction approach is applied to the previous dose estimate, ordered according to the likelihood of widespread clinical availability and use. After all methods discussed herein are available clinically, the effective dose associated with this examination is anticipated to have been reduced by approximately a factor of 10, from 10 to 1.1 mSv.
Data Acquisition: Innovations Required in X-ray Sources
The x-ray tube in a CT scanner produces x-rays with a continuous spectrum of energies. This results in beam-hardening effects, which cause errors in CT numbers and artifacts behind highly attenuating materials. However, monoenergetic sources, such as synchrotrons, are not likely to be clinically practical. Thus, for the foreseeable future, improvements in x-ray source technology will continue to focus on improvements to x-ray tubes and generators, including (a) increasing the range of tube potential values available to allow greater customization of scanning parameters to specific patients and clinical applications; (b) increasing generator power levels to allow higher tube current values for use with lower tube potentials; (c) optimizing the composition, shape, and thickness of the x-ray filter to deliver x-ray intensities that are matched to the patient attenuation profile and to produce as “monoenergetic” of a spectrum as possible; and (d) producing small, uniform, and stable focal spots that maintain their shape and size as tube potential and tube current are varied so that spatial resolution is not affected by changes in x-ray intensity (number of photons per square centimeter).
Selection of the optimal tube potential and filtration is currently an active area of research (25,32–36). Studies have shown that the most dose-efficient tube potential depends not only on the diagnostic task but also the patient size (25,35). For example, for contrast material–enhanced scans in small- and medium-sized patients, tube potentials of 80 and 100 kV provide a higher iodine contrast-to-noise ratio (CNR) for the same scanner radiation output and allow for a dose reduction of up to 50% compared with a tube potential of 120 kV (Fig 2). However, for unenhanced scans of large and obese patients, tube potentials of 140 kV and higher provide optimal image quality. The use of contrast media with k edges in the range of 50–90 keV (eg, ytterbium and tantalum) would require substantially higher tube potentials than are used today (eg, 180 kV). This would provide an increased CNR per unit of dose (37).
Figure 2a:

(a) Graph shows iodine CNR as a function of tube potential for three phantom sizes. The same volume CT dose index was used for the four tube potentials for each phantom (small, 6.6 mGy; medium, 15.3 mGy; large, 37.0 mGy). (b) Graph shows relative dose required to match the iodine CNR as a function of tube potential for the three phantom sizes. CTDIvol = volume CT dose index.
Figure 2b:

(a) Graph shows iodine CNR as a function of tube potential for three phantom sizes. The same volume CT dose index was used for the four tube potentials for each phantom (small, 6.6 mGy; medium, 15.3 mGy; large, 37.0 mGy). (b) Graph shows relative dose required to match the iodine CNR as a function of tube potential for the three phantom sizes. CTDIvol = volume CT dose index.
As tube potential is decreased, tube current must be increased more strongly than the tube potential decrease to obtain sufficient photon intensity at short scanner rotation times (<0.5 second). However, because power is proportional to the product of the tube potential and tube current, increased power is necessary to provide sufficient photon intensity at low tube potentials. Thus, the realization of dose reduction from the use of optimized tube potential will require new x-ray tube and generator technologies that are capable of operating at high power levels at previously unused potentials (eg, <80 kV and >140 kV). High power levels also allow for more aggressive beam filtration, which reduces the number of low-energy photons in the beam and results in a decrease in patient dose. For the higher spatial resolution required by some special applications, a reduction of focal spot size is an additional goal.
In summary, a greater range of tube potentials and higher power levels to allow for higher filtration are the main developmental goals for clinical CT systems. Smaller focal spot sizes and novel source designs are important topics for ongoing technical development. These developments may allow for dose reductions of up to 50% in many contrast-enhanced applications and about 25% as an average over all applications. Achieving these goals will require cooperation with industry, where x-ray source and generator developments are most often initiated.
Data Acquisition: Innovations Required in Detector Technology
Problems with Current CT Detectors
Currently available clinical CT systems use a type of detector that integrates all of the energy deposited over a finite time period to produce a single signal. No information is available about the individual photons interacting with the detector; the signal produced by a single 120-keV photon would be identical to that produced by three 40-keV photons. The inability of energy-integrating detectors to differentiate between photons of different energies presents two major limitations to achieving routine submillisievert CT.
First, the differences in soft-tissue x-ray attenuation are smaller at higher energies than at lower energies. However, higher-energy photons dominate the measured signal, resulting in relatively poor soft-tissue contrast.
Second, to visualize these subtle differences in soft-tissue contrast, image noise must be kept low, requiring larger x-ray exposures.
The absence of energy information regarding individual photons also limits the quantitative potential of CT. CT numbers do not accurately measure the linear attenuation coefficient of tissue owing to imprecise assumptions regarding photon energies. Furthermore, CT numbers cannot always help differentiate between different types of tissue: A tissue composed of higher atomic number elements may have the same CT number as a tissue composed of lower atomic number elements if the former tissue is not very dense and the latter tissue is sufficiently dense.
Finally, energy-integrating detectors add electronic and Swank noise (38) to the measured signal. Swank noise occurs due to variations in a scintillation detector’s ability to convert x-rays to visible light photons, variations in the depth of this conversion, and variations in the ability of the created photon to escape the crystal. At the low photon counts associated with reduced dose levels or highly attenuating patients, these sources of noise severely degrade image quality.
Detectors that can count individual photons and discriminate their individual energies (39–41) have the potential to overcome these limitations. These detectors are referred to as PCDs or energy-discriminating detectors and are described hereafter by the acronym PCD.
PCD Design
To detect individual photons and resolve their energies into multiple windows, a 2–3-mm-thick crystal (typically cadmium telluride) is attached to a positively charged anode that is divided into pixels of 200–1000 µm (42,43). The crystal and anode are connected to application-specific integrated circuits. The number of energy windows currently varies from two to six, depending on the PCD manufacturer.
PCDs count the number of photons within each of the energy windows. The energy deposited by each x-ray photon generates an electrical charge. The charge travels within the detector crystal toward the anode and creates a pulse that is processed by the application-specific integrated circuit. The height of the pulse is compared with specified energy thresholds. A count is registered in the counter associated with an energy threshold if the pulse height exceeds the threshold value; thus, all photons above a threshold will be counted. To determine the number of photons detected within a specific energy window, the counts measured by using two different energy thresholds are subtracted to yield the number of counts occurring in the energy window defined by the two threshold values.
PCD for Dose Reduction
PCDs decrease image noise and increase tissue contrast relative to energy-integrating detectors. These properties can be used to improve the quality of CT images relative to what is currently attainable. Alternatively, these properties can be exploited to decrease patient radiation dose or to decrease the amount of contrast material given to patients.
PCDs perform energy discrimination on the basis of an analysis of the height of each measured signal (41–45). Electronic and Swank noise affect the measured energy for each photon but do not change photon counts. Thus, PCDs produce data that are minimally affected by detector noise, which is highly desirable for submillisievert CT.
Unlike energy-integrating detectors, PCDs apply equal weights to all photons, including the lower-energy photons that carry the greatest amount of tissue contrast. This allows for optimal weighting of the data from each energy window, which can occur during or after the image reconstruction process (46–48) and can be tailored to the imaging task. A computer simulation (31) estimated that the CNR of bone against water and contrast-enhanced blood against water could be improved by 18% and 28%, respectively, by using a PCD. This implies that current CNR values can be achieved with radiation doses that are reduced by 29% and 39%, respectively. CT systems equipped with PCDs are not, however, commercially available because a number of technical challenges remain to be addressed.
Technical Challenges
For various reasons, the counts measured by PCDs can be lower or higher than the true counts, distorting the recorded spectrum. For example, if an x-ray photon arrives at the detector near the edge of a detector pixel, it may be counted by multiple adjacent pixels, each at lower energies. This is referred to as “charge sharing” and results in an increase in counts and incorrect energy data. Furthermore, when a detector’s response time is not sufficiently fast, multiple pulses generated by nearly coincident photons may be added and recorded as one pulse. This is referred to as “pulse pile up” and results in a loss of counts and incorrect energy data (Fig 3). If the x-ray intensity is too high, new photons constantly arrive at the detector and saturate its response.
Figure 3:

When a detector’s response time is not sufficiently fast, the two pulses generated by detection of two nearly coincident photons may be added and recorded as one pulse. This is referred to as pulse pile up and results in loss of counts and incorrect energy data. In this example, five true photons are counted as three observed pulses. The energies assigned to the second and third pulses overestimate the true photon energies. E1, E2, and E3 are energy thresholds.
The unattenuated x-ray flux reaching the detectors of current clinical CT systems is very high—as large as 109 counts per second per square millimeter at 1 m from the x-ray focal spot, which is typical for clinical CT systems. The current state of the art in PCD technology can operate only up to 0.6 × 10⁶ counts per second per square millimeter with 95% detection efficiency, a factor of 103 lower than that with current clinical systems. Thus, we anticipate that several issues will need to be addressed in parallel to make submillisievert PCD CT a clinical reality. Specifically, four key areas must be addressed: beam-shaping filters, PCD technology, calibration and compensation methods, and image reconstruction.
Beam-shaping filters.—CT systems use an attenuating filter to “shape” the intensity of the x-ray beam across the field of view. This is often referred to as a bow-tie filter because it is thick at each end and thin in the middle. The purposes of the shaping filter are to equalize the x-ray intensity to the detector and to reduce dose to the patient periphery. For PCDs, it is essential to manage the intensity near the edges of objects. This is especially crucial for ray paths outside the object, where the unattenuated x-ray intensity will be very high. Furthermore, because the projection of the object’s edge will constantly change positions along the arc of the detector as the tube rotates around the object, a single filter shape will not suffice. Rather, dynamic filtration or collimation of the beam across the field of view will be required to reduce the high x-ray intensity outside of the object. This should reduce the maximum count rate that needs to be measured by the PCD by a factor of 10–100.
PCD technology.—Improvements in crystals, application-specific integrated circuits, and other hardware components are needed to address pulse pile up and charge-sharing issues. Considering the attenuation achieved by using dynamic beam-shaping filters, the operational count rate will need to be as large as 107–108 counts per second per square millimeter (this assumes a 95% detection efficiency because 5% is a typical upper limit of pile-up errors that would be generally acceptable without correction).
Calibration and compensation methods.—Current designs and prototype systems suffer from temporal and pixel-to-pixel variations in detector response, which will lead to substantial ring artifacts on reconstructed images if not adequately addressed. Thus, the third crucial need for the development of PCD CT is the development of algorithms to compensate for spatial and temporal variations in detector response. Such algorithmic approaches will be required even with hardware improvements.
Image reconstruction.—The fourth area where technologic improvement is needed is in image reconstruction. Existing algorithms will need to be adapted to the unique characteristics of PCD CT and new techniques may need to be developed. Continued investigation of the optimal weighting factors to be applied to specific energy windows will also be required (47,49).
In summary, there are at least four key areas of investigation that should be supported to enable clinical PCD CT. These are (a) filters to shape the intensity of the x-ray beam, (b) improvements in PCD technology to accept a 100-fold increase in count rates, (c) methods to calibrate PCDs to compensate for detector imperfections, and (d) new PCD-adapted image reconstruction algorithms. The benefits of these technical advances will include improved contrast between similar soft-tissue types, improved utilization of iodinated contrast material, and decreased image noise at low doses. Improved quantitative accuracy, particularly in the assessment of material elemental composition, and molecularly targeted, nanoparticle-based imaging are additional benefits that PCD CT will provide.
Algorithms and Computing Power: Innovations Required in Image Reconstruction, Data Collection Schemes, and Postprocessing
Image reconstruction and postprocessing can be used to reduce dose or provide new or more accurate clinical information. Contemporary challenges in this field are primarily related to problems associated with low photon counts and incomplete projection data. (A projection is defined as all the x-ray transmission measurements made at one position of the x-ray tube as it rotates around the patient; ie, it is all data for one angular position.) The ability to reconstruct satisfactory CT images from projection data with low photon counts or incomplete data will define how much we can reduce radiation dose without compromising diagnostic performance.
Low photon counts in the measured projection data can be voluntarily produced by reducing the x-ray intensity and/or number of projections, which proportionally decreases the radiation dose. Low photon counts can also be the result of large patient size or the presence of metallic implants, the prevalence of which continues to increase in the U.S. population. With current commercial CT systems, reducing the x-ray intensity per projection is straightforward and can be accomplished by reducing the tube current–time product or tube potential. The ability to reduce the number of projections, however, is not currently available with conventional CT systems, although it can be accomplished in special cases like C-arm–based CT.
Reconstruction of projection data into an accurate representation of the scanned object by using filtered backprojection techniques requires that the projection data include complete information about the entire cross section of the imaging object. If a patient is wider than the irradiated VOI, attenuation measured in some projections will be missing from other projections. This inconsistency in the projection data causes bright artifacts at the lateral aspects of the image (Fig 4). These artifacts are referred to as truncation artifacts because some portions of the transmission profile of the object are missing, or truncated, in the measured projection.
Figure 4:
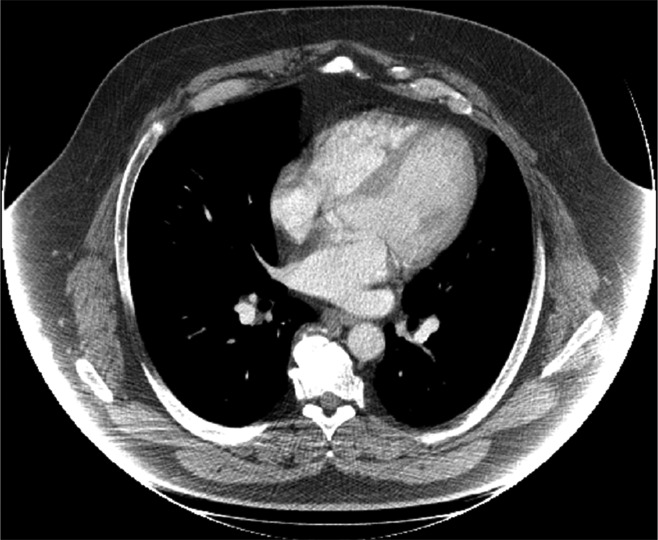
Axial CT image of thorax. Truncation artifacts, which appear as areas of very high attenuation at left and right edges of patient, are caused by missing projection data. This occurs when portions of the patient lie outside the irradiated VOI.
CT image reconstruction techniques, data collection schemes, and postprocessing algorithms have advanced considerably in recent years. Iterative reconstruction and algorithms such as projection- or image-based noise reduction are currently being introduced into many practices to reduce CT doses. Methods requiring unique data collection schemes, such as compressed sensing, VOI scanning, and interior tomography, require additional technical developments before they can be used clinically. For example, techniques to pulse the x-ray beam as the tube rotates are needed to take advantage of compressed sensing methods that require fewer projections, and collimators that move within the x-ray beam plane are needed to take advantage of VOI and interior tomography methods. To adopt any of these methods clinically, the optimal trade-off between accuracy (fidelity) of the reconstructed image and image noise levels, and the degree to which techniques can be combined, must be also determined. The following sections describe several of the most promising methods for reducing CT dose requirements by means of image reconstruction, modified data collection schemes, and postprocessing.
Iterative Reconstruction Methods
To enable a significant reduction in dose, diagnostic-quality images must be able to be produced from measurements made by using low photon intensities. The statistical noise associated with the detection of a discrete number of photons can be modeled as a Poisson process. In addition, noise sources in other parts of the imaging chain can be statistically modeled. Thus, mathematic methods that attempt to determine the most likely true signal from a set of noisy (uncertain) projection data can be applied to reduce image noise. These techniques require the use of iterative reconstruction methods.
In iterative reconstruction, an initial estimate of the “truth” (ie, the object being imaged) is generated from the acquired projection data. This is typically done by using conventional filtered backprojection reconstruction methods, which are very fast. From this initial estimate, the system simulates x-ray projection data. This simulation step can include a detailed model of the scanner geometry (eg, focal spot size, detector spacing). It also includes a model of the quantum noise, such as a Poisson model. In essence, the algorithm performs “virtual CT scanning” on the initial filtered backprojection image to acquire a new set of projections. These simulated projections are compared with the actually measured projections and the differences used to update the initial estimate of the truth. This process is repeated until the differences between the actual and simulated projections are acceptably small (Fig 5).This technique can produce images that more closely resemble the scanned object. Noise and artifacts can be reduced and spatial detail improved. When statistical models of noise are included in this process, the technique is referred to as statistical iterative reconstruction.
Figure 5:

Diagram illustrates iterative reconstruction process (see text for detailed explanation).
In addition to their usefulness when photon counts are low, iterative reconstruction algorithms are of considerable value when projection data are inconsistent or incomplete, as occurs with view truncation, or when data are corrupted, as occurs with metallic implants. Another important advantage of iterative reconstruction is the ability to account for nonuniformities in detector response as well as beam hardening and scatter. When the physics of the CT system (eg, the system geometry model or noise model) is taken into account, the technique is often referred to as model-based iterative reconstruction (21,50). For example, noise levels in the projection data can be modeled and projections with high noise levels given a lower weight in the reconstruction than low noise levels. CNRs can be improved with these types of methods, even at extremely low radiation dose levels (21). A final strength of iterative reconstruction is the avoidance of data filtration before the backprojection process, which can lower spatial resolution.
Noise Reduction Techniques
In contrast to iterative reconstruction methods, which form an image from the projection data, noise reduction techniques only reduce noise levels, either in the projection data (17–19,23,51–53) or on the reconstructed image (22,54). If the noise reduction is performed on projection data, image reconstruction must still be performed. A typical scenario is to apply noise reduction to the projection data and then use filtered backprojection to reconstruct the image. Such images, however, do not benefit from the other strengths of iterative reconstruction, such as decreasing artifacts or improving spatial resolution. Rather, spatial resolution may be degraded owing to the filtering (noise reduction) performed on the projection data before image reconstruction.
Postprocessing Techniques
Postprocessing algorithms are also used to accomplish a range of tasks that are highly relevant to enabling routine submillisievert CT. These algorithms include those that automatically segment specific image features or perform automated quantitative measurements. Fundamentally, there is nothing wrong with noisy images as long as features of interest can be extracted by means of postprocessing and expert interpretation. An example of this is CT perfusion imaging, where images measured at multiple points in time can individually be quite noisy. The mathematic processes used to extract the time-attenuation curves from these images are rather immune to noise, particularly when they average signal over reasonably large regions. Thus, improvements in postprocessing algorithms may further the ability to extract accurate and reproducible measures from relatively noisy data sets, decreasing the radiation dose requirements.
Compressed Sensing
An additional advantage of iterative image reconstruction is that the required number of projection angles can be drastically reduced (55–58). One such technique, referred to as compressed sensing, can be used to reconstruct images from far fewer projections (eg, 20–30) than the number currently used (approximately 1000). If all other scanning parameters remain the same, the dose is reduced in proportion to the reduction in the number of projections. Compressed sensing techniques are used in other disciplines, such as photography, and seek to recover a full-quality image (eg, a 7-megabyte digital photograph) by using a greatly reduced input data set (eg, only a few hundred kilobytes of data). In the world of CT imaging, this would translate to achieving the full level of image quality with many fewer projections. If the x-ray beam could be shut off or blocked for small periods of time as the tube rotates around the patient, the dose to the patient could be reduced. This capability, however, is not available in current CT systems. Still, the combination of statistical iterative reconstruction methods with compressed sensing holds great potential for providing routine submillisievert clinical CT imaging (59–62).
VOI Imaging and Interior Tomography
One type of CT image reconstruction, known as interior tomography, purposely avoids irradiating the complete patient, reducing dose to regions outside the VOI. For example, to reduce dose for cardiac CT, the x-ray beam could be collimated to irradiate only the central region of the patient. In this situation, all projections are highly truncated. Attenuation from peripheral structures is measured in some views and not in others, creating an impossible task for traditional filtered backprojection reconstruction algorithms. Various algorithms (using either noniterative or iterative methods) have been proposed for reconstructing CT images from highly truncated data sets (30,63–67). These are referred to as interior tomography reconstruction algorithms. Alternatively, the peripheral regions of the patient cross section can be irradiated with greatly reduced dose levels, avoiding the severe truncation of the projection data (65,66). Reconstructed images have decreased quality outside the VOI but full image quality within the VOI (Fig 6). This is referred to as VOI imaging. An important distinction between interior tomography and VOI imaging is that filtered backprojection reconstruction can be used with VOI data sets.
Figure 6a:
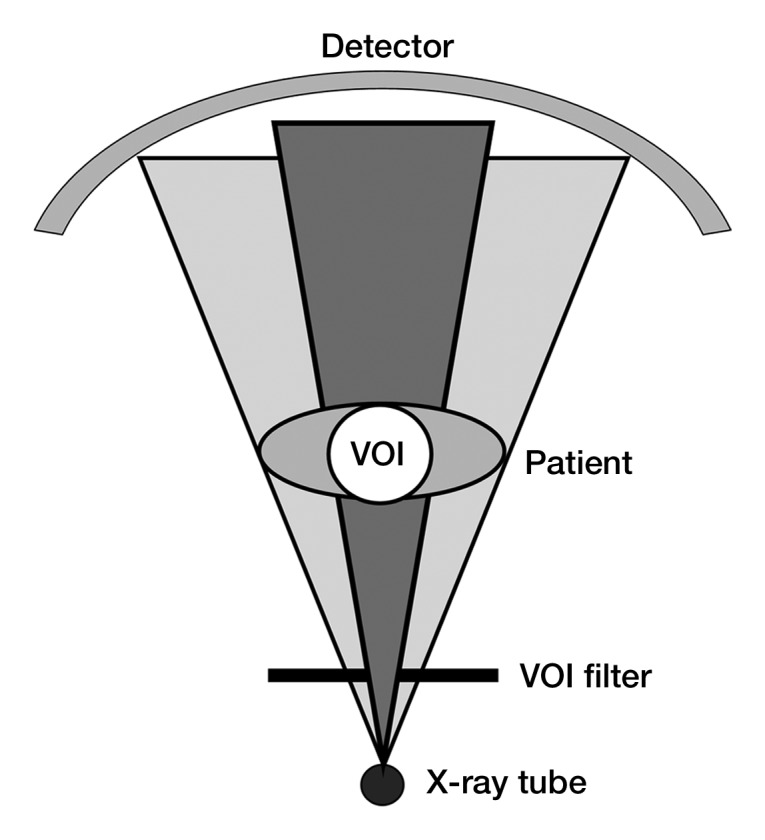
(a) Illustration of VOI imaging. A physical filter reduces photon intensity to regions outside the VOI. (b) Axial CT images of abdomen. VOI image was obtained with simulation, where noise was inserted into original data set (left image) at portions of the projections associated with regions outside the VOI (right image). Dose reductions outside the VOI of 50%–65% and within the VOI of 25%–30% were able to be simulated while preserving image quality within the VOI.
Figure 6b:

(a) Illustration of VOI imaging. A physical filter reduces photon intensity to regions outside the VOI. (b) Axial CT images of abdomen. VOI image was obtained with simulation, where noise was inserted into original data set (left image) at portions of the projections associated with regions outside the VOI (right image). Dose reductions outside the VOI of 50%–65% and within the VOI of 25%–30% were able to be simulated while preserving image quality within the VOI.
Improvements in Computing Power Required for Clinical Implementation of Iterative Reconstruction, Noise Reduction, and Postprocessing Techniques
Regardless of whether iterative reconstruction, noise reduction, or post processing approaches are used, the ability to decrease image noise is what fundamentally enables reductions in patient dose. Knowing that these algorithms can use relatively noisy projection measurements or images to achieve acceptable noise levels and accurate quantitative parameters, users can decrease the radiation output of the scanner, confident that the diagnostic value of the obtained information is retained.
Currently, clinical CT systems can produce thousands of images from a single data set and reconstruction speeds of approximately 40 images per second are typical. For iterative reconstruction, noise reduction, or other postprocessing techniques to be adopted into routine clinical practice, the processing times will need to be similar. Graphic processor unit–based platforms may provide the needed computational speed for such processing-intensive techniques to be used clinically to reduce CT dose.
In summary, several image reconstruction, data collection, and postprocessing techniques may help reduce the dose in CT. Techniques to address the problems associated with reduced photon intensities include iterative reconstruction, noise reduction applied to either projection data or reconstructed images, and compressed sensing. Alternatively, by using current levels of photon intensity, dose can be reduced by irradiating less of the patient—either by acquiring fewer projection measurements and using compressed sensing or by irradiating only a selected VOI and using interior tomography.
Reference Data: Innovations Required for Access to Clinical Raw Projection Data
Owing to the linearity of filtered backprojection reconstruction algorithms, the validation of results from a simple phantom can be generalized to human anatomy. However, iterative reconstruction algorithms are nonlinear and results from phantom measurements will not predict performance in humans. Therefore, projection data from actual patient scans are required for researchers to compare and optimize the performance of iterative reconstruction. The availability of standardized data sets would allow researchers from any discipline to evaluate their algorithms against the results of competing methods, helping them to more rapidly determine which methods are superior. Without access to such data, algorithm researchers cannot address clinically relevant problems, making the translation from laboratory development to clinical practice very difficult, if not impossible.
A solution to this issue is to require all CT manufacturers to participate in a process whereby the proprietary information is stripped from data files and projection data are provided to researchers, leveraging the tremendous knowledge in nonmedical image processing disciplines toward achieving submillisievert CT. A national CT data resource center should be created to oversee these operations, under confidentiality agreements with the manufacturers. Different levels of raw data may be prepared by the center on the basis of users’ requests, such as data before or after the logarithm is performed or with or without beam-hardening correction. Although such a center would not in itself reduce dose, the capabilities that it would provide are fundamental to routinely achieving submillisievert effective doses. The user and research community would have access to the data needed to validate and optimize new algorithms, and the manufacturers’ proprietary information contained in the original raw data would be protected.
In summary, there is a distinct need to provide raw projection data to a variety of users. Collaboration with manufacturers will be essential for this to occur.
Image Quality Metrics and Processes: Innovations Required to Perform Clinically Relevant Protocol Optimization
Dose optimization is used to determine the minimum dose level that will maintain the required diagnostic performance for each specific patient and diagnostic task. This can be approached in two steps. The first step is to appropriately define the target image quality for each specific diagnostic task while not requiring image quality higher than necessary to make the diagnosis. The second step is to improve the dose efficiency with which the system can achieve this target image quality.
Specific methods to improve dose efficiency in CT include those described in the previous sections. However, no matter how dose efficient a system may be, setting the target noise level too low (ie, target image quality is set too high) will deliver a radiation dose higher than necessary. Therefore, appropriately defining the target image quality for each diagnostic task is essential. Owing to the complexity of the clinical indications for CT, the wide range of CT examination types, variations in observer performance and preferences, and differences in performance among scanners, finding the appropriate target image quality for each diagnostic task is very challenging.
The standard of reference for determining the target image quality that can yield an acceptable imaging outcome is the performance of trained human observers for a clinically relevant task. Metrics of image quality that are derived from phantom measurements are likely correlated with such observer performance, but the absolute image quality requirements for adequate diagnostic performance are difficult to quantify. With this lack of absolute image quality targets, users go about the tasks of protocol selection and optimization using various qualitative or semiquantitative approaches.
The effect of various postacquisition parameters can be evaluated retrospectively. The same patient data are reconstructed with a range of image thicknesses and reconstruction algorithms (kernels). Any parameter that can be retrospectively adjusted can be evaluated without the need to repeatedly expose the patient. Semiquantitative scoring by a team of users can assist in determining which combination of postreconstruction settings is most desirable. However, the substantial interplay between postacquisition settings and actual acquisition settings, such as detector collimations, x-ray tube potential, and scanner output levels, limits the ability of this approach to find the most dose-efficient protocol for a specific diagnostic task.
Optimizing CT Protocols by Using Simulation of Reduced-Dose Images
One extremely valuable approach to protocol optimization is to use a noise insertion tool to simulate images at reduced dose levels from existing “standard dose” clinical data. A range of simulated dose levels can be generated and the diagnostic quality comparisons performed by using the same patient data, thus removing patient-specific variables. This approach enables radiologists to determine the lowest acceptable dose level without risk of compromising a patient scan (13,68–73).
Two types of evaluation are often used by interpreting physicians to determine the lowest acceptable dose. One type of evaluation uses “diagnostic acceptability” as the criterion, without considering the diagnostic accuracy. During the evaluation, interpreting physicians decide based solely on their previous experience whether the image is clinically acceptable at each dose level. Because of the lack of truth (eg, results from pathologic examination) for each case, the optimal dose determined in this type of evaluation relies heavily on the experience level and preference of the physician.
The other type of evaluation involves patient databases with reference standards (eg, results from pathologic examination). The true diagnostic performance of interpreting physicians can be determined at each dose level. On the basis of the relationship between the diagnostic outcome (in terms of sensitivity and specificity) and the radiation dose level, one can determine the lowest acceptable dose level that can yield the minimally acceptable diagnostic performance. This is a scientifically more rigorous approach for dose optimization. However, because databases with reference standards are difficult to obtain, this type of evaluation is relatively difficult in practice.
One of the biggest obstacles to the widespread use of reduced-dose simulation tools is that they require access to the raw projection data. Because of the proprietary nature of the raw CT data, the noise insertion tools used in most dose-optimization studies have been developed by manufacturers. These tools have been available only for a few scanner models and distributed to very few users under research agreements. The technical details and performance information (eg, accuracy) are not publicly available. Noise insertion tools could be made available to users by the national CT data center described earlier, which could similarly develop and make available software tools to simulate changes in other scanning parameters, such as tube potential.
Quantitative and Objective Dose Optimization
Clinical evaluation by interpreting physicians using either existing or simulated patient cases with various combinations of scanning and reconstruction techniques is the reference standard for establishing the target image quality and required minimum radiation dose. However, this approach is very time consuming and expensive. There are simply too many combinations of acquisition and reconstruction parameters (eg, milliampere second, collimation, tube potential, reconstruction kernels, section thickness) and a growing list of dose-reduction techniques (iterative reconstruction and noise reduction algorithms). Each of these parameter settings could affect the image quality and thereby the optimal dose level for achieving the target image quality. Therefore, the parameter space to be optimized is huge. In addition, the time frame for such studies is often impractical because the pace at which new technologies are introduced is often faster than our ability to rigorously evaluate and optimize them. Software tools to facilitate efficient reader review of cases are desperately needed, so that the time commitments of the reader are reduced. Even with such tools, intra- and interreader variability are a considerable problem, requiring that many readers participate in any study to achieve meaningful results. Thus, the number of parameters that can be rigorously optimized with human observer performance evaluation will be very limited.
A more efficient and quantitative method is therefore needed to perform radiation dose and protocol optimization in CT. One potential approach is to identify the set of image quality surrogates, or metrics, that can be easily measured but that are highly correlated with human diagnostic performance for a specific diagnostic task (Fig 7). With such metrics, the absolute level of image quality that is determined to provide sufficient diagnostic performance can be established as the target image quality for the specific diagnostic task. Users of any scanner model or any software version could then perform phantom measurements, adjusting their scanning protocols until the required target image quality is achieved with the lowest possible dose. The time-consuming and expensive human observer performance studies are then only needed initially to determine the target image quality for each diagnostic task and possibly as a final confirmation of the predictive ability of the image quality surrogates.
Figure 7:

Diagnostic performance of human or model (mathematic) observers can be quantified by using receiver operating characteristic curves, which plot sensitivity versus 1 – specificity as the observers’ detection threshold is varied. The figure of merit used to represent the quality of an imaging system or technique is the area under the receiver operating characteristic curve (AUC). Graphs show area under the receiver operating characteristic curve plotted against the applied dose for the task of detecting a large or small object. The performances of three different image reconstruction methods are compared as a function of radiation dose for standard filtered backprojection (FBP) and two different iterative reconstruction algorithms (IR1 and IR2).
Task-based Image Quality Metrics in CT
The key to quantitative methods for dose optimization is to determine image quality metrics that can be accurately measured in phantoms and that are highly correlated with radiologists’ performance for a specific diagnostic task. Currently, many physical metrics, including modulation transfer function, section-sensitivity profile, noise level, and noise power spectrum, are used to quantify or monitor various aspects of CT image quality (74–77). However, these metrics are not complete descriptors of image quality and do not directly reflect the diagnostic performance of radiologists for a given task, which is the ultimate measure of image quality. Improving image quality according to these measures will not necessarily increase diagnostic accuracy.
In addition, with iterative reconstruction methods, it will be difficult to adequately characterize image quality by using these traditional physical metrics. Owing to the nonlinearity of most iterative reconstruction algorithms, the spatial resolution varies with the object contrast and noise level. Traditional modulation transfer function measurements with high-contrast wires would yield incorrect information about the resolution in low-contrast situations. Modulation transfer function and noise power spectrum measurement techniques that accommodate the nonlinearities associated with iterative reconstructions are therefore needed.
Task-based image quality metrics that use mathematic model observers (algorithms that attempt to simulate the performance of human readers) have been studied extensively during the past 3 decades (78,79). These model observers have been applied to many different imaging modalities to narrow the range of acceptable imaging conditions and to improve the efficiency of system optimization (80), including nuclear medicine imaging (81–83), mammography (84–87), dual-energy radiography (88), tomosynthesis and flat-panel cone-beam CT (89–91), and magnetic resonance imaging (92). However, relatively few studies have been performed with clinical CT (93,94). Many model observers, especially those used in ramp-filtered reconstructions such as single photon emission CT (SPECT) or positron emission tomography (PET), may be straightforwardly extended to CT. However, the noise characteristics in CT are fundamentally different from those in SPECT or PET owing to much higher photon counts and the logarithmic operation before reconstruction.
In summary, the development of task-based image quality metrics is needed. These studies should (a) use realistic signal and/or background directly measured from CT scans, (b) test and evaluate various model observers and detection and/or classification tasks, (c) investigate how the performance of model observers correlates with the performance of human observers (ie, radiologists) using clinical CT data, and (d) use the model observers in clinical CT to optimize radiation dose and scanning protocols (95). This should be a major focus of research resources in the coming years (96–98). Once a set of task-based image quality metrics is determined, they can be used clinically to efficiently and accurately optimize scanning protocols and radiation dose levels in CT.
Advances in Knowledge.
• At a summit on the management of radiation dose from CT, strategies and technical advancements were identified that could reduce the dose from routine CT examination by approximately a factor of 10; for a routine single-phase CT scan of the abdomen and pelvis, this would reduce the effective dose from approximately 10 mSv to less than 1 mSv (submillisievert levels), which is only one-third of the average annual dose from background radiation sources such as radon and cosmic rays.
• Use of existing dose optimization and dose reduction strategies and techniques can reduce the dose from CT by a factor of two to four relative to typical doses from 64-row (and higher) CT systems.
• Novel algorithms (eg, interior tomographic reconstruction) and technologies (eg, photon-counting detectors) have the potential to reduce dose by another factor of two to three.
• Access to raw projection data, standardized test data sets, and noise insertion software tools is needed and advised to accelerate the development and validation of novel reconstruction or noise reduction algorithms and to facilitate determination of minimally acceptable dose levels for a range of diagnostic tasks.
Implications for Patient Care.
• Several methods are currently commercially available for reducing radiation dose from CT; in addition to implementing these methods, users can manage radiation doses from CT through protocol optimization and by adjusting for patient size and diagnostic task.
• If implemented in conjunction with these current approaches, the advances proposed at the summit should further reduce the radiation dose from routine CT examinations to well below background levels.
Disclosures of Potential Conflicts of Interest: C.H.M. Financial activities related to the present article: none to disclose. Financial activities not related to the present article: institution has a grant or grant pending from Siemens Healthcare. Other relationships: none to disclose. G.H.C. Financial activities related to the present article: none to disclose. Financial activities not related to the present article: institution received a grant or has a grant pending from GE Healthcare, Siemens AX, Varian Medical Systems, and Hologic. Other relationships: none to disclose. W.K. Financial activities related to the present article: none to disclose. Financial activities not related to the present article: is a paid consultant for Siemens Healthcare. Other relationships: none to disclose. S.L. No potential conflicts of interest to disclose. E.S. Financial activities related to the present article: none to disclose. Financial activities not related to the present article: is a paid consultant for Carestream; institution has a grant or grant pending from Carestream, GE Healthcare, and Siemens. Other relationships: none to disclose. K.T. No potential conflicts of interest to disclose. G.W. Financial activities related to the present article: none to disclose. Financial activities not related to the present article: institution has a patent pending. Other relationships: none to disclose. L.Y. No potential conflicts of interest to disclose. R.I.P. No potential conflicts of interest to disclose.
Acknowledgments
The authors thank Norbert J. Pelc, ScD, for his insightful discussions and suggestions during the preparation of this manuscript.
Received October 24, 2011; revision requested December 7; revision received February 24, 2012; final version accepted March 12
Funding: This research was supported by the National Institutes of Health (grants EB002667, EB004287, and EB007288).
See also the editorial by Thrall in this issue.
Abbreviations:
- CNR
- contrast-to-noise ratio
- PCD
- photon-counting detector
- VOI
- volume of interest
References
- 1.International Commission on Radiological Protection Recommendations of the International Commission on Radiological Protection (ICRP report no. 26). Oxford, England: International Commission on Radiological Protection, 1977 [Google Scholar]
- 2.McCollough CH, Schueler BA. Calculation of effective dose. Med Phys 2000;27(5):828–837 [DOI] [PubMed] [Google Scholar]
- 3.1990 Recommendations of the International Commission on Radiological Protection. Ann ICRP 1991;21(1-3):1–201 [PubMed] [Google Scholar]
- 4.The 2007 Recommendations of the International Commission on Radiological Protection ICRP publication 103. Ann ICRP 2007;37(2-4):1–332 [DOI] [PubMed] [Google Scholar]
- 5.Menzel HG, Clement C, DeLuca P. ICRP publication 110. Realistic reference phantoms: an ICRP/ICRU joint effort. A report of adult reference computational phantoms. Ann ICRP 2009;39(2):1–164 [Published correction appears in Ann ICRP 2009;39(2):165.] [DOI] [PubMed] [Google Scholar]
- 6.American Association of Physicists in Medicine The measurement, reporting and management of radiation dose in CT. AAPM Task Group 23 of the Diagnostic Imaging Council CT Committee. College Park, Md: American Association of Physicists in Medicine, 2008 [Google Scholar]
- 7.National Council on Radiation Protection and Measurements Ionizing radiation exposure of the population of the United States. Report no. 160. Bethesda, Md: National Council on Radiation Protection and Measurements, 2009 [Google Scholar]
- 8.Committee to Assess Health Risks from Exposure to Low Levels of Ionizing Radiation , National Research Council. Health risks from exposure to low levels of ionizing radiation: BEIR VII phase 2 Washington, DC: National Academies Press, 2006 [PubMed] [Google Scholar]
- 9.Health Physics Society Radiation risk in perspective. Position statement of the Health Physics Society: PS010–1 McLean, Va: Health Physics Society, 2004 [DOI] [PubMed] [Google Scholar]
- 10.Kalender WA, Wolf H, Suess C, Gies M, Hentschel D, Bautz W. Dose reduction in CT by anatomically adapted tube current modulation: experimental results and first patient studies (abstr). Radiology 1997;205(P):4719356631 [Google Scholar]
- 11.Kalra MK, Maher MM, Toth TL, et al. Techniques and applications of automatic tube current modulation for CT. Radiology 2004;233(3):649–657 [DOI] [PubMed] [Google Scholar]
- 12.McCollough CH, Bruesewitz MR, Kofler JM., Jr CT dose reduction and dose management tools: overview of available options. RadioGraphics 2006;26(2):503–512 [DOI] [PubMed] [Google Scholar]
- 13.Yu L, Bruesewitz MR, Thomas KB, Fletcher JG, Kofler JM, McCollough CH. Optimal tube potential for radiation dose reduction in pediatric CT: principles, clinical implementations, and pitfalls. RadioGraphics 2011;31(3):835–848 [DOI] [PubMed] [Google Scholar]
- 14.Deak PD, Langner O, Lell M, Kalender WA. Effects of adaptive section collimation on patient radiation dose in multisection spiral CT. Radiology 2009;252(1):140–147 [DOI] [PubMed] [Google Scholar]
- 15.Christner JA, Zavaletta VA, Eusemann CD, Walz-Flannigan AI, McCollough CH. Dose reduction in helical CT: dynamically adjustable z-axis x-ray beam collimation. AJR Am J Roentgenol 2010;194(1):W49–W55 [DOI] [PubMed] [Google Scholar]
- 16.Kachelriess M, Watzke O, Kalender WA. Generalized multi-dimensional adaptive filtering for conventional and spiral single-slice, multi-slice, and cone-beam CT. Med Phys 2001;28(4):475–490 [DOI] [PubMed] [Google Scholar]
- 17.Manduca A, Yu L, Trzasko JD, et al. Projection space denoising with bilateral filtering and CT noise modeling for dose reduction in CT. Med Phys 2009;36(11):4911–4919 [DOI] [PMC free article] [PubMed] [Google Scholar]
- 18.Li T, Li X, Wang J, et al. Nonlinear approach to sinogram smoothing for low-dose x-ray CT. IEEE Trans Nucl Sci 2004;51(5):2505–2513 [Google Scholar]
- 19.La Rivière PJ, Bian J, Vargas PA. Penalized-likelihood sinogram restoration for computed tomography. IEEE Trans Med Imaging 2006;25(8):1022–1036 [DOI] [PubMed] [Google Scholar]
- 20.Borsdorf A, Raupach R, Flohr T, Hornegger J. Wavelet based noise reduction in CT-images using correlation analysis. IEEE Trans Med Imaging 2008;27(12):1685–1703 [DOI] [PubMed] [Google Scholar]
- 21.Thibault JB, Sauer KD, Bouman CA, Hsieh J. A three-dimensional statistical approach to improved image quality for multislice helical CT. Med Phys 2007;34(11):4526–4544 [DOI] [PubMed] [Google Scholar]
- 22.Bittencourt MS, Schmidt B, Seltmann M, et al. Iterative reconstruction in image space (IRIS) in cardiac computed tomography: initial experience. Int J Cardiovasc Imaging 2011;27(7):1081–1087 [DOI] [PubMed] [Google Scholar]
- 23.Silva AC, Lawder HJ, Hara A, Kujak J, Pavlicek W. Innovations in CT dose reduction strategy: application of the adaptive statistical iterative reconstruction algorithm. AJR Am J Roentgenol 2010;194(1):191–199 [DOI] [PubMed] [Google Scholar]
- 24.Jakobs TF, Becker CR, Ohnesorge B, et al. Multislice helical CT of the heart with retrospective ECG gating: reduction of radiation exposure by ECG-controlled tube current modulation. Eur Radiol 2002;12(5):1081–1086 [DOI] [PubMed] [Google Scholar]
- 25.Yu L, Li H, Fletcher JG, McCollough CH. Automatic selection of tube potential for radiation dose reduction in CT: a general strategy. Med Phys 2010;37(1):234–243 [DOI] [PubMed] [Google Scholar]
- 26.Singh S, Kalra MK, Hsieh J, et al. Abdominal CT: comparison of adaptive statistical iterative and filtered back projection reconstruction techniques. Radiology 2010;257(2):373–383 [DOI] [PubMed] [Google Scholar]
- 27.May MS, Wüst W, Brand M, et al. Dose reduction in abdominal computed tomography: intraindividual comparison of image quality of full-dose standard and half-dose iterative reconstructions with dual-source computed tomography. Invest Radiol 2011;46(7):465–470 . [DOI] [PubMed] [Google Scholar]
- 28.Lubner MG, Pickhardt PJ, Tang J, Chen GH. Reduced image noise at low-dose multidetector CT of the abdomen with prior image constrained compressed sensing algorithm. Radiology 2011;260(1):248–256 [DOI] [PubMed] [Google Scholar]
- 29.Chen L, Yu L, Leng S, McCollough CH. CT volume-of-interest (VOI) scanning: determination of radiation reduction outside the VOI (abstr). In: Radiological Society of North America scientific assembly and annual meeting program. Oak Brook, Ill: Radiological Society of North America, 2011; 196 [Google Scholar]
- 30.Yu H, Wang G. Compressed sensing based interior tomography. Phys Med Biol 2009;54(9):2791–2805 [DOI] [PMC free article] [PubMed] [Google Scholar]
- 31.Srivastava S, Taguchi K. Sinogram restoration algorithm for photon counting clinical x-ray CT with pulse pileup compensation. Presented at the First International Meeting on Image Formation in X-Ray Computed Tomography. Salt Lake City, Utah, June 6–9, 2010 [Google Scholar]
- 32.Funama Y, Awai K, Nakayama Y, et al. Radiation dose reduction without degradation of low-contrast detectability at abdominal multisection CT with a low-tube voltage technique: phantom study. Radiology 2005;237(3):905–910 [DOI] [PubMed] [Google Scholar]
- 33.Siegel MJ, Schmidt B, Bradley D, Suess C, Hildebolt C. Radiation dose and image quality in pediatric CT: effect of technical factors and phantom size and shape. Radiology 2004;233(2):515–522 [DOI] [PubMed] [Google Scholar]
- 34.Schindera ST, Nelson RC, Mukundan S, Jr, et al. Hypervascular liver tumors: low tube voltage, high tube current multi-detector row CT for enhanced detection—phantom study. Radiology 2008;246(1):125–132 [DOI] [PubMed] [Google Scholar]
- 35.Kalender WA, Deak P, Kellermeier M, van Straten M, Vollmar SV. Application- and patient size–dependent optimization of x-ray spectra for CT. Med Phys 2009;36(3):993–1007 [DOI] [PubMed] [Google Scholar]
- 36.Primak AN, Ramirez Giraldo JC, Liu X, Yu L, McCollough CH. Improved dual-energy material discrimination for dual-source CT by means of additional spectral filtration. Med Phys 2009;36(4):1359–1369 [DOI] [PMC free article] [PubMed] [Google Scholar]
- 37.Novak T, Hupfer M, Brauweiler R, Eisa F, Kalender W. Potential of high-z contrast agents in clinical contrast-enhanced computed tomography. Med Phys 2011;38(12):6469–6482 [DOI] [PubMed] [Google Scholar]
- 38.Swank RK. Absorption and noise in x-ray phosphors. J Appl Phys 1973;44(9):4199–4203 [Google Scholar]
- 39.Barber WC, Nygard E, Iwanczyk JS, et al. Characterization of a novel photon counting detector for clinical CT: count rate, energy resolution, and noise performance. Proc SPIE 2009;7258:725824 [Google Scholar]
- 40.Feuerlein S, Roessl E, Proksa R, et al. Multienergy photon-counting k-edge imaging: potential for improved luminal depiction in vascular imaging. Radiology 2008;249(3):1010–1016 [DOI] [PubMed] [Google Scholar]
- 41.Roessl E, Proksa R. K-edge imaging in x-ray computed tomography using multi-bin photon counting detectors. Phys Med Biol 2007;52(15):4679–4696 [DOI] [PubMed] [Google Scholar]
- 42.Iwanczyk JS, Nygård E, Meirav O, et al. Photon counting energy dispersive detector arrays for x-ray imaging. IEEE Trans Nucl Sci 2009;56(3):535–542 [DOI] [PMC free article] [PubMed] [Google Scholar]
- 43.Taguchi K, Zhang M, Frey EC, et al. Modeling the performance of a photon counting x-ray detector for CT: energy response and pulse pileup effects. Med Phys 2011;38(2):1089–1102 [DOI] [PMC free article] [PubMed] [Google Scholar]
- 44.Schlomka JP, Roessl E, Dorscheid R, et al. Experimental feasibility of multi-energy photon-counting k-edge imaging in pre-clinical computed tomography. Phys Med Biol 2008;53(15):4031–4047 [DOI] [PubMed] [Google Scholar]
- 45.Shikhaliev PM. Computed tomography with energy-resolved detection: a feasibility study. Phys Med Biol 2008;53(5):1475–1495 [DOI] [PubMed] [Google Scholar]
- 46.Shikhaliev PM. Beam hardening artefacts in computed tomography with photon counting, charge integrating and energy weighting detectors: a simulation study. Phys Med Biol 2005;50(24):5813–5827 [DOI] [PubMed] [Google Scholar]
- 47.Schmidt TG. Optimal “image-based” weighting for energy-resolved CT. Med Phys 2009;36(7):3018–3027 [DOI] [PubMed] [Google Scholar]
- 48.Frey EC, Wang X, Du Y, Taguchi K, Xu J, Tsui BMW. Investigation of the use of photon counting detectors with energy discrimination capability for material decomposition in micro-computed tomography. In: Hsieh J, Flynn MJ, eds. Proceedings of SPIE: medical imaging 2007—physics of medical imaging. Vol 6510 Bellingham, Wash: International Society for Optical Engineering, 2007; 65100A-1–11 [Google Scholar]
- 49.Giersch J, Niederlöhner D, Anton G. The influence of energy weighting on x-ray imaging quality. Nucl Instrum Methods Phys Res A 2004;531(1-2):68–74 [Google Scholar]
- 50.Yu Z, Thibault JB, Bouman CA, Sauer KD, Hsieh J. Fast model-based x-ray CT reconstruction using spatially nonhomogeneous ICD optimization. IEEE Trans Image Process 2011;20(1):161–175 [DOI] [PubMed] [Google Scholar]
- 51.La Rivière PJ. Penalized-likelihood sinogram smoothing for low-dose CT. Med Phys 2005;32(6):1676–1683 [DOI] [PubMed] [Google Scholar]
- 52.Wang J, Li T, Lu H, Liang Z. Penalized weighted least-squares approach to sinogram noise reduction and image reconstruction for low-dose x-ray computed tomography. IEEE Trans Med Imaging 2006;25(10):1272–1283 [DOI] [PMC free article] [PubMed] [Google Scholar]
- 53.Funama Y, Taguchi K, Utsunomiya D, et al. Combination of a low-tube-voltage technique with hybrid iterative reconstruction (iDose) algorithm at coronary computed tomographic angiography. J Comput Assist Tomogr 2011;35(4):480–485 [DOI] [PMC free article] [PubMed] [Google Scholar]
- 54.Tipnis S, Ramachandra A, Huda W, et al. Iterative reconstruction in image space (IRIS) and lesion detection in abdominal CT. Proc SPIE 2010;7622:76222K [Google Scholar]
- 55.Donoho D. Compressed sensing. IEEE Trans Inf Theory 2006;52(4):1289–1306 [Google Scholar]
- 56.Candès EJ, Tao T. Near-optimal signal recovery from random projections: universal encoding strategies? IEEE Trans Inf Theory 2006;52(12):5406–5425 [Google Scholar]
- 57.Candès EJ, Romberg J, Tao T. Robust uncertainty principles: exact signal reconstruction from highly incomplete frequency information. IEEE Trans Inf Theory 2006;52(2):489–509 [Google Scholar]
- 58.Candès E, Romberg J. Sparsity and incoherence in compressive sampling. Inverse Probl 2007;23(3):969–985 [Google Scholar]
- 59.Sidky EY, Kao CM, Pan X. Accurate image reconstruction from few-views and limited-angle data in divergent-beam CT. J Xray Sci Technol 2006;14(2):119–139 [Google Scholar]
- 60.Chen GH, Tang J, Leng S. Prior image constrained compressed sensing (PICCS): a method to accurately reconstruct dynamic CT images from highly undersampled projection data sets. Med Phys 2008;35(2):660–663 [DOI] [PMC free article] [PubMed] [Google Scholar]
- 61.Sidky EY, Pan X. Image reconstruction in circular cone-beam computed tomography by constrained, total-variation minimization. Phys Med Biol 2008;53(17):4777–4807 [DOI] [PMC free article] [PubMed] [Google Scholar]
- 62.Tang J, Nett BE, Chen GH. Performance comparison between total variation (TV)–based compressed sensing and statistical iterative reconstruction algorithms. Phys Med Biol 2009;54(19):5781–5804 [DOI] [PMC free article] [PubMed] [Google Scholar]
- 63.Noo F, Clackdoyle R, Pack JD. A two-step Hilbert transform method for 2D image reconstruction. Phys Med Biol 2004;49(17):3903–3923 [DOI] [PubMed] [Google Scholar]
- 64.Yu L, Zou Y, Sidky EY, Pelizzari CA, Munro P, Pan X. Region of interest reconstruction from truncated data in circular cone-beam CT. IEEE Trans Med Imaging 2006;25(7):869–881 [DOI] [PubMed] [Google Scholar]
- 65.Kolditz D, Kyriakou Y, Kalender WA. Volume-of-interest (VOI) imaging in C-arm flat-detector CT for high image quality at reduced dose. Med Phys 2010;37(6):2719–2730 [DOI] [PubMed] [Google Scholar]
- 66.Chen L, Shaw CC, Altunbas MC, et al. Feasibility of volume-of-interest (VOI) scanning technique in cone beam breast CT—a preliminary study. Med Phys 2008;35(8):3482–3490 [DOI] [PMC free article] [PubMed] [Google Scholar]
- 67.Hsieh J, Chao E, Thibault J, et al. A novel reconstruction algorithm to extend the CT scan field-of-view. Med Phys 2004;31(9):2385–2391 [DOI] [PubMed] [Google Scholar]
- 68.Mayo JR, Whittall KP, Leung AN, et al. Simulated dose reduction in conventional chest CT: validation study. Radiology 1997;202(2):453–457 [DOI] [PubMed] [Google Scholar]
- 69.van Gelder RE, Venema HW, Serlie IWO, et al. CT colonography at different radiation dose levels: feasibility of dose reduction. Radiology 2002;224(1):25–33 [DOI] [PubMed] [Google Scholar]
- 70.Frush DP, Slack CC, Hollingsworth CL, et al. Computer-simulated radiation dose reduction for abdominal multidetector CT of pediatric patients. AJR Am J Roentgenol 2002;179(5):1107–1113 [DOI] [PubMed] [Google Scholar]
- 71.Karmazyn B, Frush DP, Applegate KE, Maxfield C, Cohen MD, Jones RP. CT with a computer-simulated dose reduction technique for detection of pediatric nephroureterolithiasis: comparison of standard and reduced radiation doses. AJR Am J Roentgenol 2009;192(1):143–149 [DOI] [PubMed] [Google Scholar]
- 72.Ciaschini MW, Remer EM, Baker ME, Lieber M, Herts BR. Urinary calculi: radiation dose reduction of 50% and 75% at CT—effect on sensitivity. Radiology 2009;251(1):105–111 [DOI] [PubMed] [Google Scholar]
- 73.Leng S, Atwell TD, Yu L, et al. Radiation dose reduction for CT-guided renal tumor cryoablation. AJR Am J Roentgenol 2011;196(5):W586–W591 [DOI] [PubMed] [Google Scholar]
- 74.CT accreditation program requirements. American College of Radiology Web site. http://www.acr.org/accreditation/computed/ct_reqs.aspx. Accessed January 9, 2012. [Google Scholar]
- 75.Boone JM. Determination of the presampled MTF in computed tomography. Med Phys 2001;28(3):356–360 [DOI] [PubMed] [Google Scholar]
- 76.Hsieh J. Computed tomography: principles, design, artifacts, and recent advances. Bellingham, Wash: SPIE Press, 2003; 348–357 [Google Scholar]
- 77.Siewerdsen JH, Cunningham IA, Jaffray DA. A framework for noise-power spectrum analysis of multidimensional images. Med Phys 2002;29(11):2655–2671 [DOI] [PubMed] [Google Scholar]
- 78.International Commission on Radiation Units and Measurements Medical imaging: the assessment of image quality. ICRU report 54. Bethesda, Md: International Commission on Radiation Units and Measurements, 1995 [Google Scholar]
- 79.Barrett HH, Yao J, Rolland JP, Myers KJ. Model observers for assessment of image quality. Proc Natl Acad Sci U S A 1993;90(21): 9758–9765 [DOI] [PMC free article] [PubMed] [Google Scholar]
- 80.Krupinski EA, Berbaum KS. The Medical Image Perception Society update on key issues for image perception research. Radiology 2009;253(1):230–233 [DOI] [PMC free article] [PubMed] [Google Scholar]
- 81.Gifford HC, King MA, de Vries DJ, Soares EJ. Channelized hotelling and human observer correlation for lesion detection in hepatic SPECT imaging. J Nucl Med 2000;41(3):514–521 [PubMed] [Google Scholar]
- 82.Sain JD, Barrett HH. Performance evaluation of a modular gamma camera using a detectability index. J Nucl Med 2003;44(1):58–66 [PubMed] [Google Scholar]
- 83.Barrett HH, Furenlid LR, Freed M, et al. Adaptive SPECT. IEEE Trans Med Imaging 2008;27(6):775–788 [DOI] [PMC free article] [PubMed] [Google Scholar]
- 84.Chawla AS, Samei E, Saunders R, Abbey C, Delong D. Effect of dose reduction on the detection of mammographic lesions: a mathematical observer model analysis. Med Phys 2007;34(8):3385–3398 [DOI] [PubMed] [Google Scholar]
- 85.Burgess AE, Jacobson FL, Judy PF. Human observer detection experiments with mammograms and power-law noise. Med Phys 2001;28(4):419–437 [DOI] [PubMed] [Google Scholar]
- 86.Chen LY, Barrett HH. Task-based lens design with application to digital mammography. J Opt Soc Am A Opt Image Sci Vis 2005;22(1):148–167 [DOI] [PMC free article] [PubMed] [Google Scholar]
- 87.Hill ML, Mainprize JG, Yaffe MJ. An observer model for lesion detectability in contrast-enhanced digital mammography. Lect Notes Comput Sci 2010;6136:720–727 [Google Scholar]
- 88.Richard S, Siewerdsen JH. Comparison of model and human observer performance for detection and discrimination tasks using dual-energy x-ray images. Med Phys 2008;35(11):5043–5053 [DOI] [PMC free article] [PubMed] [Google Scholar]
- 89.Reiser I, Nishikawa RM. Task-based assessment of breast tomosynthesis: effect of acquisition parameters and quantum noise. Med Phys 2010;37(4):1591–1600 [DOI] [PMC free article] [PubMed] [Google Scholar]
- 90.Richard S, Samei E. Quantitative imaging in breast tomosynthesis and CT: comparison of detection and estimation task performance. Med Phys 2010;37(6):2627–2637 [DOI] [PubMed] [Google Scholar]
- 91.Gang GJ, Tward DJ, Lee J, Siewerdsen JH. Anatomical background and generalized detectability in tomosynthesis and cone-beam CT. Med Phys 2010;37(5):1948–1965 [DOI] [PMC free article] [PubMed] [Google Scholar]
- 92.Tisdall MD, Atkins MS. Using human and model performance to compare MRI reconstructions. IEEE Trans Med Imaging 2006;25(11):1510–1517 [DOI] [PubMed] [Google Scholar]
- 93.Judy PF, Swensson RG, Szulc M. Lesion detection and signal-to-noise ratio in CT images. Med Phys 1981;8(1):13–23 [DOI] [PubMed] [Google Scholar]
- 94.Boedeker KL, Cooper VN, McNitt-Gray MF. Application of the noise power spectrum in modern diagnostic MDCT. I. Measurement of noise power spectra and noise equivalent quanta. Phys Med Biol 2007;52(14):4027–4046 [DOI] [PubMed] [Google Scholar]
- 95.Wunderlich A, Noo F. Image covariance and lesion detectability in direct fan-beam x-ray computed tomography. Phys Med Biol 2008;53(10):2471–2493 [DOI] [PMC free article] [PubMed] [Google Scholar]
- 96.Richard S, Yadava G, Li X, Samei E. Predictive models for observer performance in CT: applications in protocol optimization. Proc SPIE 2011;7961:79610H [Google Scholar]
- 97.Yu L, Leng S, Chen L, Kofler JM, Jr, McCollough CH. Prediction of human observer performance on a lesion-detection task in CT using channelized hotelling observer (abstr). In: Radiological Society of North America scientific assembly and annual meeting program. Oak Brook, Ill: Radiological Society of North America, 2011; 197 [Google Scholar]
- 98.Leng S, Yu L, Chen L, Ramirez Giraldo JC, McCollough CH. Correlation between model observer and human observer performance in CT imaging when lesion location is uncertain. Proc SPIE 2012;8313:83131M. [DOI] [PMC free article] [PubMed] [Google Scholar]