Abstract
The angiogenic inhibitor TNP-470 attenuates high fat diet induced obesity; however, it is not clear how the compound alters energy balance to prevent weight gain. Five week old C57Bl/6J mice were fed high-fat diet (45% energy from fat) for 6.5 weeks and treated with TNP-470 (20 mg/kg body weight; n=7) or vehicle (saline; n=7). Control mice (n=8) received standard chow and sham injection. TNP-470 mice initially gained weight, but by day 5 body weight was significantly less than high fat fed (HFF) mice and not different from that of chow fed mice, an effect maintained to the end of the study (28.6±0.6 vs. 22.4±0.6 and 22.2±0.5g). Percent body fat was reduced in TNP-470 compared to HFF mice, but was greater than that of chow mice (34.0±1.5, 23.9±1.5, and 17.0±1.4%, P<0.05). Food intake in TNP-470 treated mice was less (P<0.05) than that in HFF mice by day 5 of treatment (2.5±0.1 vs 2.8±0.1 g/mouse/day) and remained so to the end of the study. 24 h energy expenditure was greater (P<0.05) in TNP-470 than HFF or chow mice (7.05±0.07 vs. 6.69±0.08 vs 6.79±0.09 kcal/kg/h), an effect not explained by a difference in energy expended in locomotion. Despite normalization of body weight, TNP-470 mice exhibited impaired glucose tolerance (AUC 30556±1918 and 29290±1584 vs. 24421±903 for TNP, HFF, and chow fed, P<0.05). In summary, the angiogenic inhibitor TNP-470 attenuates weight gain in high fat fed mice via a reduction in caloric intake and an increase in energy expenditure.
Keywords: obesity, angiogenesis, high fat diet, TNP-470
INTRODUCTION
Adipose tissue is a highly vascularized endocrine organ in which each adipocyte is surrounded by an extensive network of capillaries (1,2). Angiogenesis is required to support the substantial growth potential retained by adipose tissue during the lifetime of an animal, and angiogenesis plays a critical role in the development of obesity (3–5). Due to the central role of angiogenesis in expansion of adipose tissue, there continues to be an active interest in targeting the adipose tissue vasculature as a means of treating and/or preventing excess adiposity (6,7). However, the mechanisms through which antiangiogenic compounds promote loss of adipose tissue, and the metabolic consequences of preventing adipose tissue expansion during consumption of a high fat diet, are incompletely understood.
Two studies have focused on the effect of TNP-470, a synthetic analog of the fungal metabolite fumagillin, to reverse or prevent obesity in mice. TNP-470 inhibits angiogenesis via selective suppression of methionine aminopeptidase type II in endothelial cells, preventing cell proliferation (8). In a pioneering study from Folkman’s group (9) daily injection of TNP-470 resulted in significant reductions in fat mass and weight loss in obese ob/ob mice. Brakenheilm et al (10) subsequently demonstrated that TNP-470 slowed weight gain in ob/ob mice when treatment was started in young animals. An important mechanistic observation in both studies was that TNP-470 reduced food intake in ob/ob mice, although decreased food intake in young ob/ob mice was not detected until week 4–5 of treatment. TNP-470 also increased metabolic rate in hypometabolic adult ob/ob mice (9).
In addition to effects in ob/ob mice, Brakenheilm et al (10) found that TNP-470 was effective in diet-induced obesity, significantly attenuating weight gain when given to 5 week old C57Bl/6J mice fed high fat diet. Intriguingly, these investigators observed no effect of TNP-470 on food intake or metabolic rate in high fat fed mice; although a slight but transient decrease in food intake was observed in lean chow fed mice treated with the compound. Thus the mechanism(s) through which TNP-470 altered adiposity in diet induced obesity was not established.
We hypothesized that prevention of diet-induced weight gain with TNP-470 treatment must be mediated through altered energy balance, either a decrease in energy intake or an increase in energy expenditure. Given recent evaluations of indirect calorimetry methods suggesting that acclimation, data collection period, and data normalization are critical to the proper measurement of energy expenditure in mice (11), we speculated that an effect of TNP-470 to increase energy expenditure was possibly missed in previous studies. Therefore, the objectives of this study were to thoroughly assess the effect of TNP-470 on caloric intake and energy expenditure in high fat fed C57 mice. We also examined hepatic lipid content and glucose sensitivity to assess possible detrimental side effects to inhibition of adipose tissue expansion with angiogenic inhibition.
RESEARCH DESIGN AND METHODS
Animal Handling and Treatment
All animal handling and treatment procedures were approved by the Indiana University School of Medicine Institutional Animal Care and Use Committee. Individually housed, 4-wk old male C57BL/6 mice were used in this study. After a 1-wk acclimation period, mice were randomly allocated to receive either standard chow diet (2018SX, Harlan, Madison, WI) or high-fat diet (D12451, 45% calories from fat; Research Diets, New Brunswick, NJ) for 6.5 wk. Throughout the high-fat feeding period the mice were treated with TNP-470 at a dose of 20 mg/kg body weight, injected subcutaneously every other day (TNP; n=7) or a vehicle injection of an equivalent volume (HFF controls; n=7). TNP-470 (Sigma-Aldrich, St. Louis, MO) was reconstituted in ethanol and diluted in phosphate-buffered saline to a final ethanol concentration of 3%. Vehicle injections also contained 3% ethanol in phosphate-buffered saline. Chow-fed control mice (chow; n=8) were sham injected.
Mice were fed ad libitum with food replaced every 2 or 3 days. Food consumed was quantitated by difference in weight of fresh food added to the cage minus old food taken out of the cage at the next feeding day. Body weights were collected three times per week. After 6.5 wk of feeding, animals were fasted for 16-h and sacrificed. Final body, liver, and epididymal adipose tissue weights were measured. Liver and adipose tissue samples were frozen in liquid nitrogen and stored at −80°C for subsequent analysis.
Dual Energy X-ray Absorptiometry
Whole body dual energy X-ray Absorptiometry (PIXImus, GE Lunar, Madison, WI) was utilized to quantitate percent body fat, with mice under temporary isofluorane anesthesia. Scans were conducted during wk 1 and 6 of treatment.
Intraperitoneal Glucose Tolerance Testing
Five days prior to the end of the study, mice fasted for 16 h underwent an intraperitoneal glucose tolerance test. A sample of fasted blood was collected from the tail, and animals were subsequently given an intraperitoneal injection of glucose (2 g/kg body wt). Blood samples were collected at 15, 30, 60, 90, and 120 min post-injection and glucose quantitated using OneTouch Ultra glucometer (Lifescan, Milpitas, CA).
Indirect Calorimetry
A TSE systems PhenoMaster LabMaster indirect calorimeter (Chesterfield, MO) equipped with calorimeter, feeding, and activity system was used for indirect calorimetry measures. Mice were acclimated to chambers for 24-h and constancy of RQ, VO2, and VCO2 verified before the data collection period began. Consumption of oxygen, respiratory quotient, and locomotor activity were collected for 24-h. Oxygen and carbon dioxide values were corrected to lean body mass by the calorimetry software. Percent lipid and carbohydrate oxidation and energy expenditure were calculated as described previously (12,13). Energy expenditure was analyzed by hour and data presented as 3-h incremental means.
Biochemical Measures
Fasting serum triglycerides and glucose were measured using a Roche COBAS Mira S analyzer (Indianapolis, IN). Fasting serum free fatty acids were quantitated via colorimetric assay (Roche, Indianapolis, IN). Liver lipid content was determined by colorimetric assay (Triglyceride Determination Kit, Sigma-Aldrich, St. Louis, MO) following chloroform/methanol (2:1, v/v) extraction, evaporation and reconstitution with 5% fatty acid-free bovine serum albumin in water.
RNA Isolation and Transcript Quantification
Total RNA was isolated using Trizol reagent (Invitrogen, Carlsbad, CA) and quantitated by absorbance at 260 nm using a ND-1000 (NanoDrop Technologies, Inc., Wilmington, DE). Synthesis of cDNA was from 0.5 μg of total RNA using random hexamers (Applied Biosystems, Foster City, CA) in a 100-μl reaction. Real-time RT-PCR was utilized to quantitate mRNA expression using iTaq SYBR Green Supermix with ROX (Bio-Rad Laboratories, Hercules, CA) in an ABI Prism 7300 Sequence Detection System (Applied Biosystems). Five microliters of cDNA (~25 ng total RNA) was amplified in a reaction volume of 25 μl with cycling conditions: one cycle for 2 min at 50°C and one cycle for 3 min at 95°C, followed by 40 cycles of 15 s of denaturation at 95°C and 1 min of annealing/extension at 60°C. Primer sets (Invitrogen, Carlsbad, CA), shown in Table 1 were used at a concentration of 200 nM. Expression of all transcripts was normalized to 36B4 (mouse acidic ribosomal phosphoprotein) expression using the ΔCT method. There was no difference in 36B4 expression between treatment groups.
Table 1.
Primers utilized for quantitative PCR.
| Transcript1 | Forward (5′ → 3′) | Reverse (5′ → 3′) |
|---|---|---|
| CPT1-a | CAGCACCTGTACCGCCTCGC | GCCGTCATCAGCAACCGGCC |
| CPT1-b | GCTTTGGTCCCGTGGCGGAT | AGGGAGCACTGCCTCCTCCG |
| FAS | TGCTCCCAGCTGCAGGC | GCCCGGTAGCTCTGGGTGTA |
| LPL | TTCTCCTCCTACTCCTCCTC | TGTCCTCAGCTGTGTCTTCA |
| PPARα | GGCCAACGGCGTCGAAGACA | GCCAGGCCGATCTCCACAGC |
| PPARγ | CCAGAGCATGGTGCCTTCGCT | CAGCAACCATTGGGTCAGCTC |
| SREBP1c | GGAGCCATGGATTGCACATT | GCTTCCAGAGAGGAGGCCAG |
| 36B4 | AAGCGCGTCCTGGCATTGTCT | CCGCAGGGGCAGCAGTGGT |
CPT1, carnitine palmitoyltransferase 1; FAS, fatty acid synthase; LpL, lipoprotein lipase; PPAR, peroxisome proliferator-activated receptor; SREBP1c, sterol regulatory element-binding protein 1c; 36B4, acidic ribosomal phosphoprotein
Statistical Analysis
Data were analyzed with the MIXED procedure of SAS 9.2 (SAS Inst. Inc., Cary, NC). Data were interrogated for normality of error variances and all data met the assumptions of normal, independent, and random distribution. Data were analyzed with a model that accounted for the fixed effects of treatment and the random effect of mouse. Means were considered different when P < 0.05. Tukey-Kramer studentized adjustments were used to separate treatment means when main effects were significant. Values reported are least squares means with associated standard errors.
RESULTS
TNP-470 attenuates diet-induced weight gain
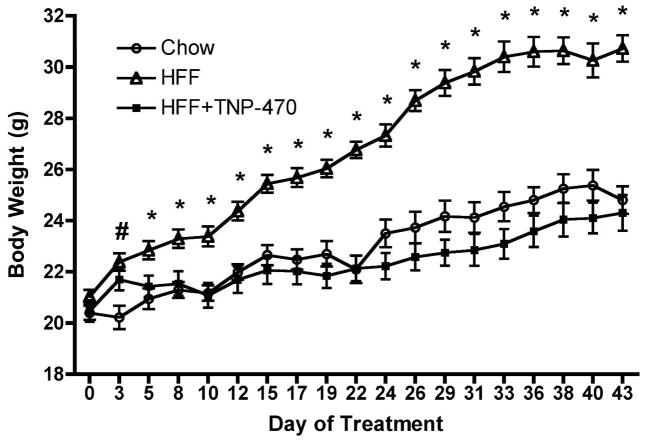
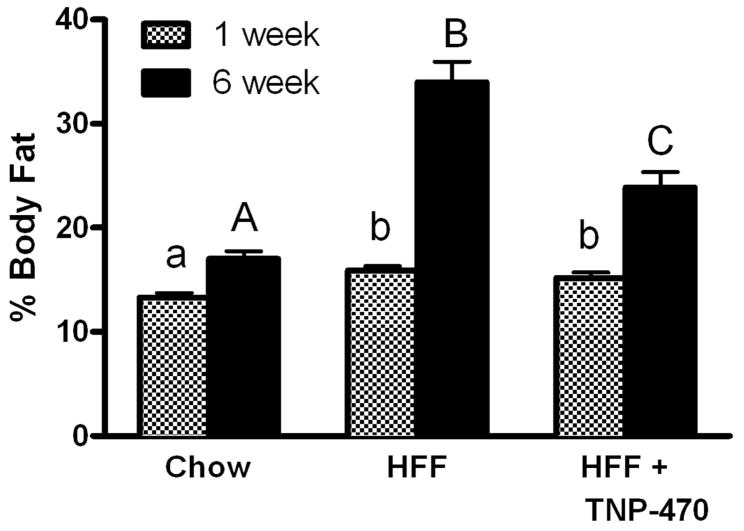
C57Bl/6J male mice were switched to high fat diet and received the first injection of TNP-470 (TNP; 20 mg/kg BW) on day 1 of the study. TNP mice initially gained weight on high-fat diet as did high fat fed (HFF) mice; however, by day 5 body weight of TNP mice was less (P < 0.05) than HFF and not different from that of chow fed controls, an effect that was maintained to the end of the study (Figure 1). Percent body fat was greater (P < 0.05) in both TNP and HFF mice compared with chow-fed after 1 wk of treatment (Figure 2). At 6 wk HFF and TNP mice had greater (P < 0.05) percent body fat than chow-fed; however, TNP mice had lower (P < 0.05) percent body fat than HFF mice. Percent lean mass at 6 wk in TNP mice (76.1±1.5%) was significantly less than that in chow mice (83.0±0.7%; P<0.05) but greater than that in HFF mice (66.0±2.0%; P<0.05).
Figure 1.
TNP-470 inhibits diet-induced weight gain. Five wk old, male C57Bl/6J mice fed high-fat diet were treated with TNP-470 (20 mg/kg BW) or vehicle every other day. At day 3, HFF and HFF+TNP-470 mice weighed more than chow fed mice but from day 5 on HFF+TNP-470 mice weighed the same as chow fed mice. Data represent mean±SE for 8 chow, 7 HFF and 7 HFF+TNP-470 mice per group.
#P<0.05 for HFF and HFF+TNP-470 different from chow
*P<0.05 for HFF different from chow
Figure 2.
TNP-470 attenuated diet-induced adiposity following 6 weeks treatment. Data shown as mean±SEM. Different letters within timepoint denote differences (P < 0.05).
Final body weight and epididymal adipose tissue weight was greater (P < 0.05) in HFF mice than TNP or chow controls (Table 2). Epididymal fat weight normalized to body weight was greater (P < 0.05) in TNP mice than chow fed mice, but less than in HFF mice (P < 0.05). Absolute liver weight was not different between any treatment, however, liver as percent of body weight was less (P < 0.05) in HFF mice than in TNP and chow-fed mice. There was no effect of treatment on fasting serum free fatty acids. Serum triglycerides and glucose were elevated (P < 0.05) in HFF mice but not different between chow-fed and TNP mice. Treatment with TNP-470 attenuated (P < 0.05) liver lipid accumulation compared to HFF mice (Table 2).
Table 2.
Body weight, tissue weight, and fasted serum metabolites in chow-fed, HFF, and TNP-470 treated mice at end of study.
| Chow-fed | SE | HFF | SE | TNP-470 | SE | P-value | |
|---|---|---|---|---|---|---|---|
| Body weight (g) | 22.19a | 0.51 | 28.60b | 0.62 | 22.42a | 0.62 | 0.0001 |
| Liver weight (g) | 0.93 | 0.04 | 0.95 | 0.03 | 0.90 | 0.03 | 0.59 |
| Liver weight (% of body weight) | 4.2a | 0.14 | 3.31b | 0.13 | 3.99a | 0.10 | 0.0003 |
| Epididymal adipose tissue (g) | 0.38a | 0.03 | 1.44b | 0.16 | 0.58a | 0.06 | 0.0001 |
| Epididymal adipose tissue (% of body weight) | 1.71a | 0.12 | 5.00 | 0.50 | 2.54c | 0.27 | 0.0001 |
| Serum free fatty acids (mmol/L) | 0.32 | 0.02 | 0.24 | 0.04 | 0.23 | 0.03 | 0.14 |
| Serum triglyceride (mmol/L) | 1.42a | 0.10 | 1.75b | 0.12 | 1.42a | 0.03 | 0.03 |
| Serum glucose (mmol/L) | 7.97a | 0.56 | 11.07b | 0.93 | 8.99a | 0.52 | 0.005 |
| Liver lipid content, mg/g tissue | 2.48a | 0.10 | 2.74b | 0.07 | 2.39a | 0.11 | 0.05 |
Values represent the mean±standard error (SE) for 8 chow, 7 HFF and 7 TNP-470 mice
Different letters within measurement denote differences P < 0.05.
TNP-470 decreased energy intake and increased energy expenditure
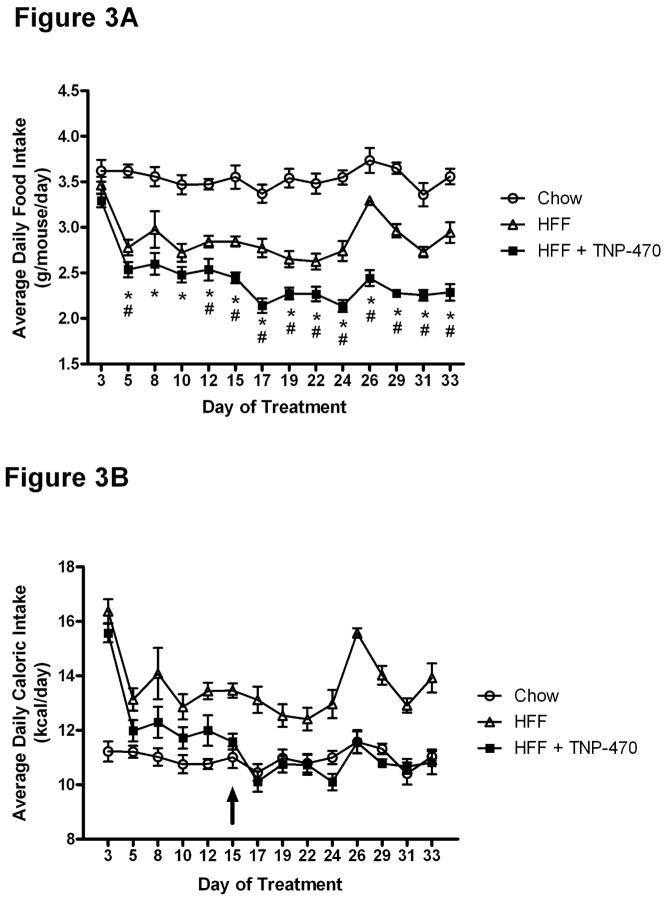
Feeding a high fat diet reduced food intake compared to that of chow fed mice when measured as grams consumed per mouse (Figure 3A). By day 5, TNP-470 treated mice consumed significantly less grams of high fat food than vehicle treated HFF mice. By day 15 of treatment, TNP-470 mice were consuming an equivalent number of calories to that of chow fed mice, despite the provision of high fat diet.
Figure 3.
TNP-470 reduced food intake. Panel A: HFF+TNP-470 treated mice consumed less grams of food than chow fed or HFF mice beginning with day 5 of treatment. Panel B: Calories ingested by HFF+TNP-470 treated mice were less than HFF mice beginning at day 5. As indicated by the arrow, caloric intake of HFF+TNP-470 mice was not different from chow fed mice beginning at day 15. Data shown as mean±SE for the 5 wk period prior to metabolic testing and associated fasts.
*P<0.05; comparing HFF+TNP-470 to chow fed mice
#P<0.05; comparing HFF+TNP-470 to HFF mice
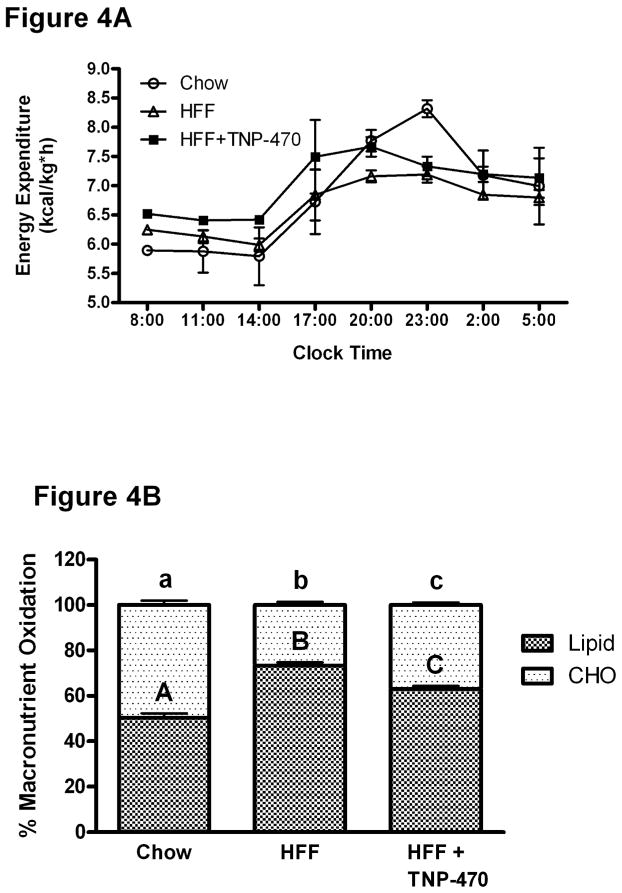
Energy expenditure was quantitated over a 24-hour period in mice acclimated to metabolic cages. As shown in Figure 4A, energy expenditure during the 12 h dark period (20:00-05:00) was increased (P < 0.05) compared to that during the lights on period in all mice; with chow fed mice exhibiting the greatest (P < 0.05) dark period energy expenditure (dark period mean: 7.79 ± 0.20, 7.06 ± 0.13, 7.42 ± 0.10 kcal/(kg*h); light period mean: 6.13 ± 0.19, 6.36 ± 0.13, 6.74 ± 0.17 kcal/(kg*h); chow-fed, high-fat fed, and TNP-470, respectively). Over the entire 24 h period, energy expenditure in TNP-470 mice was (P < 0.05) greater than in both HFF and chow-fed mice (7.05 ± 0.07 vs. 6.69 ± 0.08 and 6.79 ± 0.09 kcal/(kg*h); TNP-470 vs. HFF and chow, respectively). Locomotion did not differ (P ≥ 0.05) between TNP, HFF, or chow-fed (90.0 ± 21.3, 130.82 ± 25.2, and 196.4 ± 19.9, arbitrary units of locomotion).
Figure 4.
TNP-470 increased 24-h energy expenditure. Panel A: HFF+TNP-470 treated mice had greater energy expenditure over 24 h compared to chow-fed and HFF mice (values represent 3 h averages, P < 0.05). Panel B: HFF mice oxidized more fat than chow fed mice over 24 h. HFF+TNP-470 treated mice oxidized less fat than HFF mice. Data shown as mean±SE. Different letters denote differences (P < 0.05).
Mean RQ over 24 h was reduced in both TNP and HFF mice (0.81±0.003 and 0.79±0.004) compared to chow-fed mice due to greater lipid oxidation (0.85±0.004, P< 0.05). TNP mice oxidized less lipid and more carbohydrate than HFF (Figure 4 Panel B), resulting in a greater mean RQ (P < 0.05). During the dark period RQ was greater (P < 0.05) than during the light period for all three treatment groups (dark period: 0.90 ± 0.01, 0.80 ± 0.01, 0.83 ± 0.01; light period: 0.80 ± 0.01, 0.77 ± 0.01, 0.80 ± 0.01; chow-fed, high-fat fed, and TNP-470, respectively).
TNP-470 did not prevent diet-induced glucose intolerance
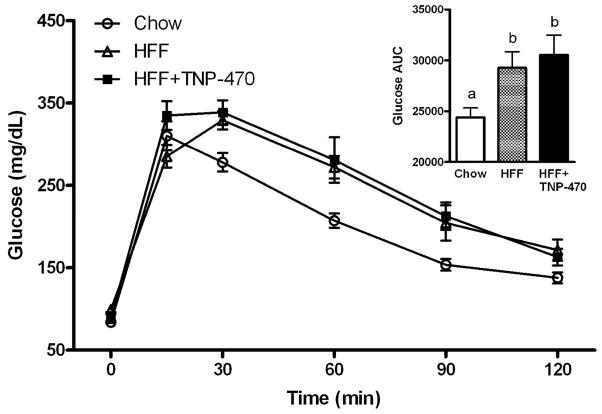
Blood glucose was greater (P < 0.05) in TNP and HFF mice at 30, 60, and 90 min post-injection, compared with chow-fed mice (Figure 5). Glucose area under the curve (AUC) was greater (P < 0.05) for TNP and HFF mice than for chow-fed. However, there was no difference in glucose intolerance between TNP and HFF mice.
Figure 5.
Treatment with TNP-470 did not improve the high fat diet-induced impairment in glucose tolerance. Intraperitoneal glucose tolerance test performed after 6 wk of high-fat feeding. Inset: glucose area under the curve (AUC). Data shown as mean±SE. Different letters denote significant difference (P < 0.05).
TNP-470 alters expression of genes regulating fatty acid oxidation and synthesis
Hepatic expression of carnitine palmitoyltransferase-1 (CPT-1a), the rate limiting enzyme in fatty acid oxidation, was reduced (P < 0.05) with high fat feeding, but this decrease was partially attenuated by TNP treatment (Table 3). PPARα was also decreased by high fat feeding but TNP had no effect on this change. Hepatic SREBP1c, which activates genes involved in fatty acid synthesis, was increased by high fat feeding and TNP partially blocked this increase. There was no effect of high fat feeding or TNP treatment on hepatic FAS expression.
Table 3.
Relative gene expression in liver and epididymal adipose tissue of chow-fed, HFF, and TNP-470 treated mice at end of study.
| Chow | SE | HFF | SE | TNP-470 | SE | P-value | |
|---|---|---|---|---|---|---|---|
|
|
|||||||
| Liver | |||||||
| CPT-1a | 126.1a | 14.3 | 87.5b | 9.3 | 96.8ab | 8.0 | 0.05 |
| PPARα | 323.7a | 60.0 | 169.6b | 19.5 | 155.9b | 20.6 | 0.01 |
| SREBP1c | 51.1c | 5.8 | 189.4a | 15.2 | 131.9b | 24.6 | 0.0001 |
| FAS | 75.8 | 6.4 | 63.3 | 13.5 | 79.1 | 16.55 | 0.65 |
| Epididymal Adipose | |||||||
| CPT-1b | 0.17 | 0.03 | 0.22 | 0.05 | 0.19 | 0.03 | 0.67 |
| PPARγ | 4.6b | 1.4 | 19.2a | 7.6 | 21.6a | 6.4 | 0.05 |
| LPL | 322.3b | 178.2 | 454.6b | 151.2 | 806.0a | 289.0 | 0.05 |
Values represent the mean±SE for 8 chow, 7 HFF and 7 TNP-470 mice
Different letters within measurement denote differences P < 0.05
In adipose tissue, expression of CPT-1b was not changed by high fat feeding or TNP treatment. PPARγ was induced (P < 0.05) in both HFF and TNP mice. Treatment with TNP-470 increased (P < 0.05) expression of adipose tissue LPL mRNA, compared to chow-fed and high-fat fed controls.
DISCUSSION
In this study we investigated the effect of the angiogenic inhibitor TNP-470 on energy intake and energy expenditure in high fat fed C57 mice. We found, as previously observed, that TNP-470 at 20 mg/kg attenuated the development of obesity by reducing accumulation of body fat. New findings in this study are that TNP-470 decreased energy intake, and increased energy expenditure, to attenuate weight gain. This study is the first to unambiguously demonstrate that the angiogenic inhibitor TNP-470 prevents weight gain in normal mice fed high fat diet through effects on energy balance.
Previous studies had documented a decrease in food intake in ob/ob mice treated with TNP-470 (9,10), but not in normal mice fed high fat diet (10). Ob/ob mice are hyperphagic due to the lack of leptin synthesis in adipose tissue (14); thus it may have been relatively easier to detect a decrease in food intake in TNP treated ob/ob mice. An effect of TNP-470 on food intake in high fat fed normal mice may not have been detected in previous studies due to the assessment of food intake only once per week. We measured food intake and provided fresh food every 2 or 3 days, which we have found results in greater high fat diet consumption than once per week provision of fresh food. Thus more frequent measures of food consumption and fresh food likely made it easier to detect the effect of TNP-470 to decrease food intake in our study.
Despite a reduction in grams of food eaten, HFF mice consumed more calories per day than did chow-fed mice due to the greater caloric content of the high fat diet. Thus increased caloric intake contributed to weight gain in HFF animals. TNP mice consumed approximately half the grams of food per day that chow fed mice ate; thus caloric intake in TNP mice was similar to that in chow-fed mice despite the greater calorie content of the high fat diet. By day 15 of treatment caloric intake of TNP mice was statistically equivalent to that of chow fed mice. Grams of food eaten over the 3 days following the first injection of TNP-470 were not significantly different from that of HFF or chow fed animals, suggesting that the compound did not cause acute illness resulting in reduced appetite.
TNP mice exhibited increased 24-h energy expenditure compared to both HFF and chow-fed mice, and this was not due to a difference in locomotion between the groups. As has been recently discussed (11) there is potential for error in indirect calorimetry if data are not collected or normalized correctly. Adipose tissue contributes relatively little to oxygen utilization compared to lean tissue, thus normalization of oxygen consumption to body weight underestimates use, leading to erroneous conclusions. In our study, oxygen consumption is normalized to lean body mass following published protocols (12,13). The data were also collected over a 24 hour period following 24 hours of acclimation of the mice to the respiratory chambers. Brakenhielm et al. did not detect an effect of TNP treatment on energy expenditure in high fat fed mice, however, calorimetry data were only collected for 3 h following a minimal acclimation period. Thus the effect of TNP-470 on energy expenditure was possibly missed for methodological reasons. Our finding that TNP-470 increased energy expenditure in high fat fed mice is in agreement with observations that the compound increased metabolic rate in hypometaboic ob/ob mice (9), although data were only collected over a 4 h period in that study.
Through what mechanism does TNP-470 inhibition of angiogenesis in adipose tissue alter energy balance? One possibility is that the compound is actually acting directly in the central nervous system, although experiments to test this hypothesis have not been done. However, using a synthetic derivative of TNP-470 with greater antiangiogenic efficacy (CKD-732), Kim et al (15) found that a single intracerebroventricular administration did not alter food intake or body weight in C57Bl/6J mice. Intracerebroventricular CKD-732 did reduce food intake in hyperphagic, arcuate nucleus lesioned mice, but there was no change in expression of hypothalamic POMC, NPY, AgRP or MCH. Thus the interpretation of these studies is not straightforward. Kim et al (16) recently evaluated the central nervous system effects of an adipose tissue endothelium specific, proapoptotic peptide (16). The proapoptotic peptide reduced food intake and body weight when administered peripherally to high fat fed mice, but intracerebroventricular administration had no effect on energy intake. These investigators propose that a novel signal from the adipose tissue vasculature acts centrally to regulate energy balance. A similar mechanism of action may exist for TNP-470; although at the concentration used in our study TNP-470 should only have inhibited endothelial cell proliferation rather than cause endothelial cell death as in the study of Kim et al (16).
In our study TNP-470 treated mice exhibited glucose intolerance that was equivalent to that in obese HFF mice, despite significant reductions in body fat. Danforth noted that any manipulation that destroyed adipocytes or prevented adipocyte differentiation and expansion of adipose tissue in the face of excess caloric intake would exchange obesity for type 2 diabetes due to deposition of lipid in liver and muscle (17). Hepatic lipids were not elevated in TNP-470 treated mice. This was likely due to attenuation of high fat diet induced expression of SREBP1c, which promotes transcription of lipid synthesis and storage enzymes, and greater expression of CPT-1a compared to HFF mice, which would support greater fatty acid oxidation. These findings suggest that glucose intolerance might reside in muscle due to fat deposition in that tissue rather than in liver. Hyperinsulinemic euglycemic clamps and measures of muscle lipid content and metabolism will be needed to more fully evaluate this possibility, and to understand why inhibition of angiogenesis did not prevent glucose intolerance.
Interestingly, adipose tissue expression of LPL was significantly increased with TNP-470 treatment over that in both chow-fed controls and HFF mice. Weight loss has been shown to be associated with greater LPL expression (18). Alternatively, this could reflect macrophage infiltration into the adipose tissue in response to death of adipocytes resulting from the absence of a functional, expanding vasculature. Future experiments can address the role of macrophages in adipose tissue that cannot expand due to angiogenic inhibition.
In summary, our data suggest that TNP-470 treatment prevents weight gain by decreasing energy intake and increasing energy expenditure. Although angiogenic inhibition did not increase circulating lipids or hepatic fatty acid content, glucose homeostasis was still impaired. Additional studies will be needed to fully understand the mechanisms through which antiangiogenic compounds alter energy balance to prevent weight gain.
Acknowledgments
This research was funded by NIH grant R01 DK081574-01.
References
- 1.Crandall DL, Hausman GJ, Kral JG. A review of the microcirculation of adipose tissue: anatomic, metabolic, and angiogenic perspectives. Microcirculation. 1997;4:211–32. doi: 10.3109/10739689709146786. [DOI] [PubMed] [Google Scholar]
- 2.Hausman GJ, Richardson RL. Adipose tissue angiogenesis. J Anim Sci. 2004;82:925–34. doi: 10.2527/2004.823925x. [DOI] [PubMed] [Google Scholar]
- 3.Rutkowski JM, Davis KE, Scherer PE. Mechanisms of obesity and related pathologies: the macro- and microcirculation of adipose tissue. FEBS J. 2009;276:5738–46. doi: 10.1111/j.1742-4658.2009.07303.x. [DOI] [PMC free article] [PubMed] [Google Scholar]
- 4.Lee MJ, Wu Y, Fried SK. Adipose tissue remodeling in pathophysiology of obesity. Curr Opin Clin Nutr Metab Care. 2010;13:371–6. doi: 10.1097/MCO.0b013e32833aabef. [DOI] [PMC free article] [PubMed] [Google Scholar]
- 5.Christiaens V, Lijnen HR. Angiogenesis and development of adipose tissue. Mol Cell Endocrinol. 2010;318:2–9. doi: 10.1016/j.mce.2009.08.006. [DOI] [PubMed] [Google Scholar]
- 6.Cao Y. Adipose tissue angiogenesis as a therapeutic target for obesity and metabolic diseases. Nat Rev Drug Discov. 2010;9:107–15. doi: 10.1038/nrd3055. [DOI] [PubMed] [Google Scholar]
- 7.Daquinag AC, Zhang Y, Kolonin MG. Vascular targeting of adipose tissue as an anti-obesity approach. Trends Pharmacol Sci. 2011;32:300–7. doi: 10.1016/j.tips.2011.01.004. [DOI] [PubMed] [Google Scholar]
- 8.Garrabrant T, Tuman RW, Ludovici D, Tominovich R, Simoneaux RL, Galemmo RA, Jr, Johnson DL. Small molecule inhibitors of methionine aminopeptidase type 2 (MetAP-2) Angiogenesis. 2004;7:91–6. doi: 10.1007/s10456-004-6089-7. [DOI] [PubMed] [Google Scholar]
- 9.Rupnick MA, Panigrahy D, Zhang CY, Dallabrida SM, Lowell BB, Langer R, Folkman MJ. Adipose tissue mass can be regulated through the vasculature. Proc Natl Acad Sci. 2002;99:10730–5. doi: 10.1073/pnas.162349799. [DOI] [PMC free article] [PubMed] [Google Scholar]
- 10.Brakenhielm E, Cao R, Gao B, Angelin B, Cannon B, Parini P, Cao Y. Angiogenesis inhibitor, TNP-470, prevents diet-induced and genetic obesity in mice. Circ Res. 2004;94:1579–88. doi: 10.1161/01.RES.0000132745.76882.70. [DOI] [PubMed] [Google Scholar]
- 11.Butler AA, Kozack LP. A recurring problem with the analysis of energy expenditure in genetic models expressing lean and obese phenotypes. Diabetes 59:323–329, 2010. Cao Y. Angiogenesis modulates adipogenesis and obesity. J Clin Invest. 2007;117:2362–8. doi: 10.2337/db09-1471. [DOI] [PMC free article] [PubMed] [Google Scholar]
- 12.Hofmann SM, Zhou L, Perez-Tilve D, Greer T, Grant E, Wancata L, Thomas A, Pfluger PT, Basford JE, Gilham D, Herz J, Tschöp MH, Hui DY. Adipocyte LDL receptor-related protein-1 expression modulates postprandial lipid transport and glucose homeostasis in mice. J Clin Invest. 2007;117:3271–3282. doi: 10.1172/JCI31929. [DOI] [PMC free article] [PubMed] [Google Scholar]
- 13.Strassburg S, Anker SD, Castaneda TR, Burget L, Perez-Tilve D, Pfluger PT, Nogueiras R, Halem H, Dong JZ, Culler MD, Datta R, Tschöp MH. Long-term effects of ghrelin and ghrelin receptor agonists on energy balance in rats. Am J Physiol Endocrinol Metab. 2008;295:78–84. doi: 10.1152/ajpendo.00040.2008. [DOI] [PMC free article] [PubMed] [Google Scholar]
- 14.Zhang Y, Proenca R, Maffei M, Barone M, Leopold L, Friedman JM. Positional cloning of the mouse obese gene and its human homologue. Nature. 1994;372:425–32. doi: 10.1038/372425a0. [DOI] [PubMed] [Google Scholar]
- 15.Kim YM, An JJ, Jin YJ, Rhee Y, Cha BS, Lee HC, Lim SK. Assessment of the anti-obesity effects of the TNP-470 analog, CKD-732. J Mol Endocrinol. 2007;38:455–65. doi: 10.1677/jme.1.02165. [DOI] [PubMed] [Google Scholar]
- 16.Kim DH, Woods SC, Seeley RJ. Peptide designed to elicit apoptosis in adipose tissue endothelium reduces food intake and body weight. Diabetes. 2010;59:907–15. doi: 10.2337/db09-1141. [DOI] [PMC free article] [PubMed] [Google Scholar]
- 17.Danforth E. Failure of adipocyte differentiation causes type II diabetes mellitus? Nat Genet. 2000;26:13. doi: 10.1038/79111. [DOI] [PubMed] [Google Scholar]
- 18.Kern PA. Potential role of TNFalpha and lipoprotein lipase as candidate genes for obesity. J Nutr. 1997;127:1917S–1922S. doi: 10.1093/jn/127.9.1917S. [DOI] [PubMed] [Google Scholar]


