

Abstract
Objective
To explore whether health care utilization changed among enrollees in Alabama's CHIP program, ALL Kids, following copayment increases at the beginning of fiscal year 2004.
Data Sources
Data on all ALL Kids enrollees over 1999–2009 are obtained from claims files and the state's administrative database.
Study Design
We use pooled month-level data for all enrollees and conduct covariate-adjusted segmented regression models. Health services considered are inpatient care, emergency department (ED) visits, brand-name prescription drugs, generic prescription drugs, physician office visits and outpatient-services, ambulance services, allergy treatments, and non-preventive dental services. Physician well-visits, preventive dental services, and service use by Native-Americans—which saw no copayment increases—serve as counterfactuals.
Principal Findings
There are significant declines in utilization for inpatient care, physician visits, brand-name medications, and ED visits following the copayment increases. By and large, utilization did not decline, or declined only temporarily, for those services and for those enrollees that who not subject to increased copayments.
Conclusions
Copayment increases reduced utilization of many health services among ALL Kids enrollees. Concerns remain regarding the long-term health consequences to low-income children of copayment-induced reductions in health care utilization.
Keywords: CHIP, copayment, cost-sharing, children, health care utilization
Introduction
The Children's Health Insurance Program (CHIP) is a federal government program created in 1997 to provide health insurance for uninsured children in families with incomes that are modest but too high to qualify for Medicaid coverage. In February 2009, the Congress passed the Children's Health Insurance Program Reauthorization Act (CHIPRA), thus ensuring the continuation of the program. CHIP is jointly financed by the federal and state governments, and administered by the states. States are given flexibility, within broad federal guidelines, in designing their eligibility requirements, payment levels for coverage, benefit packages, and policies. As the initial implementation of CHIP, a number of states have expanded beneficiary cost-sharing by increasing premiums and copayments (Coughlin and Zuckerman 2005). These changes have been motivated by state budgetary shortfalls, concerns about “unnecessary” utilization, crowd-out of employer-sponsored insurance coverage, and demands for increased personal responsibility among public program enrollees (Artiga and O'Malley 2005). However, some have expressed concerns that increased premiums and copayments might impose a substantial financial burden on low-income families (Selden et al. 1986), increase uninsured rates, and reduce utilization of necessary and beneficial health services or adherence to recommended treatments among children.
The purpose of this study was to explore how increases in copayments affected health service utilization among enrollees in the state of Alabama's CHIP program, ALL Kids. The research on price sensitivity of service utilization among enrollees in public health insurance has focused primarily on adult Medicaid beneficiaries (Artiga and O'Malley 2005; Ku and Wachino 2007), perhaps because, prior to 2005, cost-sharing for child enrollees was severely limited. After the 2005 Deficit Reduction Act, states had somewhat greater flexibility to impose cost-sharing on Medicaid beneficiaries, but the limits on such cost-sharing continue to be more stringent, in general, than those permitted under CHIP (Center for Children and Families [CCF] 2008). However, although 17 states increased cost-sharing both in terms of higher premiums and higher copayments in their CHIP programs in 2003, and another 20 did so in 2004, extant research has largely focused on the effects of premium increases on CHIP program enrollments. Thus, there is a relative paucity of research on how copayment increases affect health service utilization among enrollees in CHIP. This is one of the first studies to focus on the impact of copayment increases on health service utilization among children enrolled in a state CHIP program.
Background
The landmark RAND Health Insurance Experiment (HIE) conducted in the late 1970s randomized families to different health insurance plans that varied in their cost-sharing (Leibowitz et al. 1985; Lohr et al. 1986; Newhouse and The Insurance Experiment Group 1985; Newhouse 2004). It was found that families subjected to higher cost-sharing reduced the use of health services virtually across the board, including fewer physician visits and fewer adult inpatient hospital stays, less preventive and non-preventive care, and less use of both effective and non-effective care. Families subject to cost-sharing primarily reduced their use of health services by not initiating care. Cost-sharing had at best modest effects on health outcomes, but the poorest and sickest participants in the experiment demonstrated improved health outcomes under the free plan for selected outcomes (such as hypertension, dental care, and vision). Cost-sharing did not reduce people's own risky health behaviors such as smoking.
While the literature on cost-sharing within public insurance is fairly limited, the findings are generally consistent with those from the RAND HIE (Wong et al. 2001; Artiga and O'Malley 2005; Ku and Wachino 2007). For example, when Oregon implemented increased cost-sharing in its OHP Standard Medicaid program that covers poor parents and other adults, physicians reported an increased number of patients not initiating care and reducing use of prescribed medications because of cost concerns; a survey of adults subject to increased cost-sharing who reported unmet need found that over a third reported they could not obtain needed care due to cost. Utah imposed new copayments on previously eligible parents and other adults in its Medicaid waiver program, which it calls “Non-Traditional Medicaid”; in a subsequent state survey, over 40 percent of respondents agreed that copayments “seem small, but are actually a huge problem,” and nearly as many agreed that they cause “serious financial difficulties.” The copayment increases were also found to lead to decreased utilization of services, including hospitalizations, physician visits, prescription drugs, and outpatient clinic visits. Reduced use of prescription drugs in response to higher copayments by low-income adults on public assistance have also been reported in Canada (Tamblyn et al. 2001).
Less is known about how cost-sharing affects use of health services among children on public insurance programs. This study aims to fill this gap by exploring how increased cost-sharing in the state of Alabama's CHIP program, ALL Kids, impacted health service utilization among enrollees in that program.
Data and Methods
We use longitudinal data on all ALL Kids enrollees from fiscal year 1999 to fiscal year 2009. ALL Kids is a freestanding CHIP program, distinct from the state's Medicaid program, utilizes the large Blue Cross Blue Shield of Alabama (BCBSAL) network of providers, and pays rates negotiated by BCBSAL. In addition, BCBSAL handles claims management for the program. During the years of this study, it provided coverage for uninsured children under age 19 years who are Alabama residents, not eligible for Medicaid or for dependant coverage under the state employees' health insurance plan, and with family income up to 200 percent of the Federal Poverty Level (FPL) (the income eligibility has been expanded since the last period covered in this study). Families with income between 101 and 150 percent of the FPL are referred to in the ALL Kids program as the in the “low-fee group,” whereas those with incomes between 151 and 200 percent of the FPL are referred to as the “fee group.” Copayments for a number of services differ for the two groups. Copayment amounts remained unchanged in nominal terms from the start of the program through the end of fiscal year 2003. Thereafter, both premiums for program enrollment and copayments for a number of services were raised at the beginning of fiscal year 2004, with the changes becoming effective from the first contract renewal following start of fiscal year 2004. The magnitudes of copayment increases differed across the low-fee and fee groups for many services, and in some cases, copayments only increased for one of the groups (see Table 1).
Table 1.
Mean Use of Health Services per Month, before and after Copayment Changes
| Pre-Oct 2003 | Post-Oct 2003 | Total | |||
|---|---|---|---|---|---|
| Copayment Amount Low Fee/Fee | Mean Use/Month (SD) | Copayment Amount Low Fee/Fee | Mean Use/Month (SD) | Mean Use/Month (SD) | |
| Allergy treatment | $0/$0 | 0.0042 (0.065) | $3/$5 | 0.0047 (0.068) | 0.0045 (0.067) |
| Ambulance | $0/$0 | 0.0009 (0.03) | $5/$10 | 0.0011 (0.033) | 0.001 (0.032) |
| Inpatient | $0/$5 | 0.0045 (0.067) | $5/$10 | 0.004 (0.063) | 0.0041 (0.064) |
| Preventive dental | $0/$0 | 0.0799 (0.27) | $0/$0 | 0.0858 (0.28) | 0.0841 (0.278) |
| Well-child visits | $0/$0 | 0.0135 (0.115) | $0/$0 | 0.0183 (0.134) | 0.0169 (0.129) |
| Emergency department | $0/$10 | 0.0293 (0.168) | $5/$15 | 0.0292 (0.168) | 0.0292 (0.168) |
| Physician/outpatient | $0/$5 | 0.2985 (0.458) | $3/$5 | 0.2973 (0.457) | 0.2976 (0.457) |
| Dental treatment | $0/$5 | 0.0465 (0.21) | $3/$5 | 0.0449 (0.207) | 0.0453 (0.208) |
| Brand-name drugs | $0/$3 | 0.1414 (0.348) | $3/$5 | 0.1442 (0.351) | 0.1434 (0.35) |
| Generic drugs | $0/$1 | 0.1698 (0.375) | $1/$2 | 0.1774 (0.382) | 0.1752 (0.38) |
We obtained data on health service utilization from the ALL Kids claims files, which are managed by BCBSAL. We consider service use for the exhaustive range of health services for which information is available on the ALL Kids claims files, and categorize them based on the categories used by BCBSAL: (1) allergy treatments, (2) ambulance services, (3) non-preventative dental services (dental treatment), (4) emergency department (ED), (5) inpatient services, (6) physician office or other outpatient visits other than well-child visits, (7) use of brand-name prescription drugs, and (8) use of generic prescription drugs. Further details of the specific services included in each of these categories are given in Table S1 in the Appendix.
Our key hypothesis is that an increase in copayments for a health service will reduce utilization of that service. However, the extent of reduction is likely to vary by service. By including the exhaustive range of services in our data, we are able to explore the impact of cost-sharing on services that previous studies (e.g., Leibowitz et al., 1985) find to be price sensitive—such as physician visits and outpatient care, versus less price sensitive—such as inpatient care. We can also explore the price sensitivity of brand-name versus generic pharmaceutical drugs, given that the latter is a lower cost substitute for the former. Furthermore, based on earlier findings for adults, we hypothesize that there will be no decline in the use of preventive services that were exempt from cost-sharing (Busch et al., 2006).
We are aware of specific changes to the coverage of one health service within the ALL Kids program during this period—which could impact its use. Dental treatment was expanded to include more services (such as resin surfacing), and maximum allowable expenditure per enrollee per contract year was increased. However, there may be several other extraneous, unmeasured factors during this period that could also affect health service utilization. Hence, we utilize several options to check whether any changes in service utilization found in our study are simply the artifacts of such unmeasured factors. First, we include two other services for which there were no increases in copayments—(9) physician office well-child visits and (10) preventive dental services, as useful comparators for testing the validity of our empirical approach. We also look at service utilization by Native-American enrollees, who pay no copayments in the ALL Kids program. While an unknown number of Native-Americans may also obtain some health services from the Indian Health Service, the fact that they were not subject to copayment changes in the ALL Kids program makes them a plausible control group to investigate whether our results are artifacts of unmeasured factors affecting health service utilization in this period. Finally, we consider differences in changes in service utilization between the low-fee and the fee group for physician visits and for dental treatment, because, for these services, copayments only increased for the low-fee group.
Information on enrollee characteristics, including age, gender, race, and area of residence, is collected from the BCBSAL enrollment files and the state's ALL Kids database, and is merged with the information from the claims files. In addition, we use the claims data to identify individuals who have any of the chronic health conditions (based on pre-defined specifications by ALL Kids). These are tracked on their enrollment application.
Empirical Model
The primary empirical approach taken is segmented regression modeling, which provides a powerful quasi-experimental method to analyze the longitudinal effects of time-delimited policy-changes (Wagner et al. 2002). While segmented regression models are frequently used with data that are aggregated over all users in a particular time period (for example, Hartung et al. 2008), the approach is similar to the regression discontinuity (RD) design, and like the latter may be extended to cases where the data are measured at the level of individual users. The general form of this model is as follows:
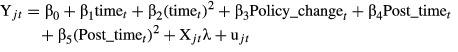 |
(1) |
where Yjt is the health care service utilization level measured at time period t for unit of observation j, ‘time' is a continuous variable, here measured in months, indicating the trend in mean use of Yjt since the initial study period. The ‘(time)2' variable accommodates the possibility that the trend in use may be non-linear. ‘Policy_change' is a binary indicator that is 0 in all time periods before the policy-change and 1 in all time periods after. Its coefficient, β3, estimates the level change in mean use of Yjt immediately following the policy-change (in this case the change in copayments). ‘Post_time' is a continuous measure of time that starts after the policy-change is implemented (it takes the value 0 in periods before the policy-change). The inclusion of ‘Post_time' and its square accommodates change in the trend of use after the policy-change. Xjt is a vector of other variables relevant to the jth unit of observation in time ‘t' that may potentially predict Yjt. We control for the enrollees' current age, gender, race, rural/urban status using rural urban commuting area (RUCA) categorization A (http://depts.washington.edu/uwruca/ruca-uses.php), whether the enrollee had a primary diagnosis for any chronic condition (during the entire study period), whether the enrollee's family income is above 150 percent of FPL, and a series of binary indicators for each month of the year, to account for potential variations in the demand for certain types of health services at different times of the year. The error term is denoted by ujt and is clustered to account for repeated observations from the jth unit.
It is conventional to use higher order polynomials such as quadratic trends in RD models both before and after a policy-change or intervention (for example, Zuckerman et al. 2006; Lee and Lemieux 2010), but the model may have less power in cases where a linear model is the better fit (Zuckerman et al. 2006). Also, as recent studies have shown, segmented regression models yielding quite different conclusions when linear (Boles et al. 2010) versus quadratic models (Ma and McClintock 2011) are used with the same data; we believe that it may be more helpful for readers to see the results from both. Thus, we also estimate a model that omits the quadratic terms both before and after the policy-change. This linear model is:
| (2) |
Of particular interest in such models is how the predicted value of Yjt immediately following the passage of the policy-change (hereafter ‘actual predicted utilization' or APU) differs from what the hypothetical predicted value would be in the same time period, had no policy-changes occurred (hereafter ‘hypothetical predicted utilization' or HPU). Note that, in that hypothetical situation, the value of the ‘Policy-change' variable stays at ‘0', and the ‘post time' variable is not relevant. Hence, it can be shown with simple algebraic calculations that the gap between HPU and APU in the month immediately after the policy-change (i.e., when the value of ‘Post_time' in equation (1) is equal to 1) in the linear model is:
| (3) |
and in the quadratic model, it is:
| (4) |
This formula may be generalized to calculate the gaps between HPU and APU at any time period after the implementation of the policy, by substituting the appropriate value of Post_timet in place of 1 in equations (3) or (4). We also calculate the magnitude of the gap 12 months after the policy-change. As enrollees may not be instantaneously aware of all of the changes in copayments, changes in service utilization may occur over time as they ‘learn' more. Also, some enrollees renew their contracts a few months after the start of fiscal year 2004, and only then become subject to the new cost-sharing. Thus, it is informative to see whether the gap between HPU and APU becomes larger or smaller as enrollees have more time to learn about and adapt to the new copayment regime.
Our unit of analysis is an “enrollee-month.” As the overwhelming majority of enrollees do not utilize any particular service in a given month, we focus instead on the probability that enrollee utilized a particular health service within a given month, t. As this outcome is binary—1 if the health service in question was utilized at all, 0 otherwise—we modify equation (1) and estimate a probabilistic regression model or “probit.” For simplicity of notation, the set of variables measuring the time trends and the intervention are together referred to as ‘Time_vars.' The formulation of the probit model is as follows:
| (5) |
where Pjt is the probability of the event and C is the standard normal cumulative distribution function. Thus, changes in the right-hand side covariates are now associated with changes in the probability of health care utilization of a particular type. Conventional coefficient estimates of β and λ in a probit model show the direction of the association between the covariate in question and Pjt, as well as the statistical significance, but they are not interpretable as estimates of the magnitude of the association. For this, it is routine to report “marginal effects,” which we estimate using the ‘margins' command in STATA (Version 11), calculated at the sample mean of variables. We also calculated marginal effects at specified values of ‘time' and ‘Post_time' following the policy-change. Furthermore, we also estimated all models using linear probability models instead of probits. Results are very similar to those reported and are available on request.
Results
Table 1 shows the monthly fraction of patients receiving each type of health service before and after the copayment change, and in the full study period. Table 2 presents descriptive statistics for the other model covariates, showing the mean and proportions for the population before and after the copayment change as well as the overall values. We find that the enrollee population before and after the policy-change is quite similar. Figure 1 illustrates the trends in monthly participation for each of the health services. The point of time where the copayment changes are implemented is clearly delineated, so that the trend in use before and after the changes can be seen. The following related services are shown on the same graphs: brand-name and generic prescription drugs, physician visits and well-child visits, ambulance services and inpatient services, and dental treatment and preventive dental services.
Table 2.
Descriptive Statistics for Model Covariates
| Variable | Pre-Copayment Change N = 1,942,349 person-months | Post-Copayment Change N = 4,876,238 person-months | Overall N = 6,818,587 person-months | p (post - pre) |
|---|---|---|---|---|
| Age in years at enrollment, mean (SD) | 10.2 (4.6) | 10.5 (4.7) | 10.4 (4.7) | <0.0001 |
| Male,%(n) | 50.9 (987,865) | 50.8 (2,478,875) | 58.8 (3,466,740) | 0.5798 |
| Rural/urban code,% (n) | ||||
| RUCA 1 | 63.6 (1,235,181) | 65.5 (3,193,212) | 65.0 (4,428,393) | <0.0001 |
| RUCA 2 | 13.0 (251,510) | 12.7 (617,772) | 12.7 (869,282) | |
| RUCA 3 | 13.0 (253,569) | 12.5 (611,531) | 12.7 (865,100) | |
| RUCA 4 | 10.4 (202,089) | 9.3 (453,723) | 9.6 (655,812) | |
| Federal poverty level,% (n) | ||||
| 101–150% | 63.9 (1,241,877) | 63.8 (3,111,817) | 63.9 (4,353,694) | 0.0030 |
| 200–250% | 36.1 (700,472) | 36.2 (1,764,421) | 36.2 (2,464,893) | |
| Race,% (n) | ||||
| Caucasian | 62.2 (1,207,680) | 59.4 (2,897,803) | 60.2 (4,105,483) | <0.0001 |
| African American | 32.9 (638,170) | 34.9 (1,701,098) | 34.3 (2,339,268) | |
| Other | 4.9 (964,99) | 5.7 (277,337) | 5.5 (373,836) | |
| Chronic disease,% (n) | 22.0 (426,254) | 22.1 (1,075,074) | 22.0 (1,501,328) | 0.0037 |
Figure 1.
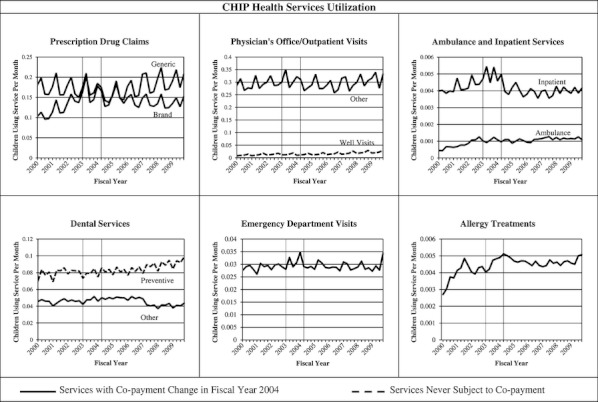
CHIP Health Services Utilization
Table 3 presents key results from the covariate-adjusted segmented probabilistic regression for the linear model (Model A), and the quadratic model (Model B), for all health services of interest. The table presents marginal effects corresponding to the set of coefficient estimates and the asymptotic t-statistics of the marginal effects. For the ease of exposition, we present the marginal effects in terms of percentage point changes rather than changes in probability. The gap between HPU and APU in the period immediately following the copayment changes, as well as 12 months after the policy-change, is presented as a difference in percentage points.
Table 3.
Results from Segmented Models on Health Service Utilization and Copayment Changes
| Service | Model | Timet | (Timet)2 | Policy-changet | Post timet | Post timet2 | Nov. 2003 | Nov. 2004 |
|---|---|---|---|---|---|---|---|---|
| Brand-name drugs | A | 0.19** (53.51) | 0.0003 (1.36) | −2.36** (25.58) | −0.22** (52.05) | 0.001** (4.19) | −2.57 | −5.17 |
| B | 0.17** (13.91) | −1.28** (12.05) | −0.32** (26.46) | −1.6 | −5.3 | |||
| Generic drugs | A | −0.04** (10.42) | −0.002** (7.65) | −1.814** (19.91) | 0.12** (30.63) | 0.002** (6.96) | −1.7 | −0.28 |
| B | 0.06** (4.83) | −1.37** (11.95) | 0.202** (16.37) | −1.16 | 1.53 | |||
| Physician/outpatient | A | 0.05** (14.42) | −0.0003 (1.15) | −2.45** (24.62) | −0.02** (3.78) | 0.001** (5.67) | −2.46 | −2.65 |
| B | 0.07** (5.31) | −1.29** (9.97) | −0.09** (6.88) | −1.38 | −2.25 | |||
| Inpatient | A | 0.002** (5.56) | 0.0001** (3.07) | −0.07** (7.80) | −0.002** (6.64) | −0.0001** (2.81) | −0.07 | −0.1 |
| B | −0.001 (0.70) | −0.08** (5.38) | −0.01** (5.29) | −0.09 | −0.19 | |||
| Ambulance | A | 0.001** (8.57) | −0.00004** (2.72) | −0.02** (4.70) | −0.001* (7.43) | 0.00003* (2.12) | −0.02 | −0.03 |
| B | 0.003** (4.50) | −0.02* (2.56) | 0.001 (1.31) | −0.02 | −0.001 | |||
| Emergency department | A | 0.003** (2.56) | 0.0001 (1.05) | −0.01 (0.24) | −0.01** (4.18) | −0.000001 (0.02) | −0.01† | −0.07† |
| B | −0.0002 (0.04) | 0.03 (0.65) | −0.02* (3.80) * | 0.01† | −0.17† | |||
| Allergy treatment | A | 0.002** (2.85) | −0.0001 (1.26) | −0.01 (0.5) | −0.002** (2.18) | 0.001# (1.95) | −0.01† | −0.04† |
| B | 0.01* (1.97) | 0.05* (2.04) | −0.002 (0.72) | 0.04 | 0.04 | |||
| Dental treatment | A | 0.01** (3.88) | 0.0004** (4.26) | 0.43** (11.11) | −0.02** (14.84) | −0.001** (5.70) | 0.4 | 0.14 |
| B | −0.02** (3.41) | 0.14** (2.64) | −0.03** (5.55) | 0.11 | −0.34 | |||
| Well-child visits | A | 0.01** (13.51) | −0.0004** (7.54) | −0.15 (9.35)** | 0.003 (5.32)** | 0.0003** (6.40) | −0.15 | −0.11 |
| B | 0.03** (10.82) | −0.12** (4.99) | 0.02** (9.15) | −0.1 | 0.21 | |||
| Preventive dental | A | 0.01** (4.27) | −0.001** (5.94) | 0.01 (1.29) | 0.01** (8.17) | 0.001** (6.18) | 0.02† | 0.09† |
| B | 0.04** (5.95) | 0.2** (3.40) | 0.04** (7.47) | 0.25 | 0.88 |
Notes. N = 6,818,587. Estimates are presented in the form of Marginal effects (multiplied by 100 to convert from change in probabilities to percentage changes). Absolute values of t-statistics in parenthesis.
All models adjusted for age, sex, race, month of service, RUCA categorization A, and presence of chronic disease. Standard errors clustered on individuals' repeated months of enrollment. Shaded columns indicate services that have never been subjected to copayments. Percentage point gaps between actual mean predicted utilization (APU) and hypothetical mean predicted utilization (HPU) are presented for Nov. 2003 and Nov. 2004.
Gap was calculated using statistically insignificant estimates of the marginal effect of policy-change.
p < 0.01;
p < 0.05;
p < 0.10.
Our estimation results show that all linear and quadratic terms before and after the policy-change are statistically significant for four classes of services: generic drugs, preventive dental services, dental treatment, and well-child visits. This indicates that the quadratic model provides a more appropriate fit for these services. In general, however, results from both models are qualitatively very similar for almost all services. In the quadratic models, trends in utilization are positive from the beginning of our study to the time of the policy-change for brand-name drugs, physician visits, inpatient care, allergy treatments, preventive dental care, and well-child visits. For generic drugs, the trend is initially positive and then starts decreasing, whereas for dental treatment, the trend is initially negative and then starts increasing. The only qualitative difference in results in the linear models are that the trend in ED use also appears significant and positive till the policy-change, and the trends in use of generic drugs and dental treatments, respectively, appear to be steadily decreasing and steadily increasing over the period prior to the policy change.
Immediately following the copayment increases, we find statistically significant declines in levels of utilization in both the quadratic and linear models for the following: brand-name drugs, generic drugs, physician services, inpatient services, and ambulance services. In addition, for brand-name drugs, physician visits, and inpatient care, the changes in trends after the copayment increases are also negative and significant, thus over time further exacerbating the decline in use. For generic drugs, the change in trend is positive and significant, and thus over time, the initial drop in levels of usage is offset. For ambulance services, the direction of change in trend is sensitive to model specification, and thus, we cannot comment on how utilization of this service changes over the long-run after the copayment increase.
There is no significant change in levels of use for ED after the copayment increase, but the change in trend is negative. This suggests that ED use may not be responsive to higher cost-sharing in the short run, but there is a gradual response over time. For dental treatment, the levels of use appear to increase immediately after the copayment increase, but the change in trend is negative and significant, and hence, over time, the initial increase is counterbalanced.
Finally, for the counterfactual of well-child visits, the level of use appears to decrease immediately after the policy-change. However, the change in trend is positive and significant, and hence, the decrease in utilization of well-child visits is only temporary. For the counterfactual of preventive dental services, the level of use appears to increase after the policy-change, and the change in trend is also positive, which indicate that use of preventive dental services continues to increase after the policy-change.
Next, we present the gaps between HPU and APU both immediately after the copayment changes were implemented and 12 months after they have been in effect. Immediately after copayments increased, APU is lower compared with HPU for all health services except for allergy visits and dental treatment. APU is even further lower than HPU, 12 months after the policy-change for brand-name drugs, physician office visits, inpatient services, and ED visits. These findings suggest that the increase in copayments had the effect of reducing utilization immediately, and reducing it more in the longer run. For generic drugs, however, the gap between HPU and APU has shrunk noticeably after 12 months in the linear model, whereas in the quadratic model, APU is higher than HPU after 12 months, suggesting an immediate reduction in utilization that is eventually reversed in the long run. Conversely, in the case of dental treatment, APU is higher than HPU immediately after the copayment change, but after 12 months, the gap has shrunk substantially in the linear model, whereas in the quadratic model, APU has fallen below HPU.
Two services saw no copayment changes—preventive dental care and well-child visits. In case of preventive dental care, we see that APU is in fact higher than HPU immediately as well as 12 months after the policy-changes. For well-child visits, there is an initial drop in levels of utilization, which leads to APU being lower than HPU immediately after the policy-change. However, the drop in levels is counterbalanced by a positive change in trends, and after 12 months, APU has exceeded HPU in the quadratic model, whereas the gap between APU and HPU has narrowed in the linear model. The results from the quadratic model may arguably be more accurate, given the statistical significance of both quadratic terms in this model. Hence, it appears that services with no changes in copayments saw no declines or only temporary declines in utilization, lending assurance that the long-run declines found for services where copayments did increase are not spurious.
We next turn to the results for Native-American enrollees, presented in Appendix S2. For most services, we neither find evidence of statistically significant declines in levels of service use coinciding with the policy-change, nor evidence that the trend in use decreases significantly following the policy-change. In fact, the levels or trend in use for some services appear to increase for Native-Americans in the period after the policy-change—such as physician visits, allergy treatments, and dental treatments. For generic drugs, there appears to be a significant decline in levels of use in the quadratic model, but the result is highly sensitive to model specification. The only service for which Native-Americans do show significant decreases in trends in use after the policy-change in both the linear and quadratic models is brand-name drugs. The service for which both the main sample and Native-Americans show increase in use is preventive dental services. These results lend assurance that the declines in levels and trends of service utilization in our main sample following copayment increases are not artifacts of other unmeasured factors. The possible exception is brand-name drugs, where factors other than the copayment increase may have contributed to declining usage. Overall, the Native-American counterfactuals support our hypothesis that higher copayments are reducing service utilization, although one potential limitation is the relatively small sample of Native-Americans compared with the main sample of enrollees.
Finally, as stated earlier, for physician visits/outpatient and dental treatment, copayments increased for the low-fee group only (from zero to $3) but remained unchanged for the fee group. Thus, as a final validation check, we estimated models where levels of utilization as well as trends were allowed to differ for the two groups (the full results from these models are available upon request). In both cases, we observed statistically significant declines in levels of use that are specific to the low-fee group, both in the linear and quadratic model specification. For the fee group, there is a small and statistically insignificant decline in levels of use of physician services. In the case of dental treatment, the fee group actually shows an increase in use, which possibly reflects the increase in services covered and the increase in the insurance cap for dental treatments in the ALL Kids program. This provides further assurance that it is the copayment increases that drive declines in service utilization.
Discussion
This study of ALL Kids enrollees is one of the first studies to investigate the impact of increased copayments on CHIP enrollees using claims data. The findings indicate that copayment increases are linked with declines in utilization for a range of health services, including inpatient services, ED visits, and physician office visits. It should also be noted that while the marginal effects of the policy changes, and hence the gaps between the actual predicted utilization versus the hypothetical (i.e., if the policy had not changed) predicted utilization may sometimes appear small in magnitude, they are non-trivial when translated into actual reductions in the number of children using that service in a month. For example, there were 63,918 enrollees in ALL Kids in November 2003 (63,299 in November 2004). Hence, for example, the 0.07–0.09 percentage point gap between the hypothetical and actual predicted probabilities of use of inpatient services that was found immediately after the increase in copayments translates to approximately 44–57 fewer inpatient visits by child enrollees in that month.
We used a number of counterfactuals to investigate whether the apparent decline in service utilization associated with the copayment increases could be an artifact of other unmeasured factors. By and large, this is not the case. We found evidence that use either did not decline, or did so only temporarily, for services such as preventive dental care and well-child visits, where copayments did not increase. For services like physician office visit/outpatient and dental treatment, where copayments increased only for the low-fee group, we find evidence that it was that group that saw the significant declines in service utilization. Finally, there is relatively little evidence of any significant decline in service utilization among Native-American enrollees, who serve as a useful counterfactual group as their copayments did not increase. The one service where Native-Americans do demonstrate a significant decline in trends in use after the policy-change is brand-name drug use. Notably, this time period saw several educational campaigns and other efforts aimed at consumers and prescribers to promote substitution of generic drugs in place of brand-name drugs to promote cost-savings (an overview is provided in American Association of Retired Persons [AARP] Public Policy Institute 2008).
Hence, the decline in use of brand-name drugs, and the increase in trends of use for generic drugs that we find for the main sample may be driven or augmented by various extraneous factors encouraging a substitution away from brand-name and toward generic drugs over this period.
Overall, our findings lend support to the hypothesis that copayment increases reduce service utilization among CHIP enrollees. Given that the ALL Kids copayment increases were mostly $3–$5, this shows that even small increases in copayments may have non-trivial effects on service utilization. Hence, even small changes in cost-sharing in CHIP programs must be implemented with caution, to minimize the risk that enrollees will reduce essential health service utilization. At the same time, there is evidence of increasing trend in well-child visits, preventive dental care, and generic drug use following the increases in cost-sharing. Although we cannot fully dismiss the possibility that these increases are partly driven by other extraneous factors, it is feasible that families shifted to greater use of preventive services (for which copayments did not increase) and generic drugs (for which copayment increases were smaller than brand-name drugs) at least in part to avoid needing services that saw (larger) copayment increases. This raises the possibility that state CHIP programs may be able to manipulate the structure of copayments for different services to shift enrollees toward using more preventive services. This could, arguably, reduce program costs without having noticeable adverse effects on enrollee health outcomes.
We acknowledge two important limitations to this study. First, like all studies that use claims data, this one is unable to assess whether the health quality for enrollees changed following the copayment policy-change. Thus, we can neither support nor assuage concerns that the copayment increases in CHIP programs result in unmet health care needs and therefore poorer health among low-income children. Second, because we only observe utilization services conditional on enrollment, we cannot account for the fact that the increase in premiums combined with increase in copayments may have deterred enrollment itself. Thus, the full impact of cost-sharing on health service utilization for all low-income CHIP eligible children in Alabama is probably underestimated in this study. These topics should be further explored in future research.
Acknowledgments
Joint Acknowledgment/Disclosure Statement: This project was funded by the Alabama Department of Public Health, Bureau of Children's Health Insurance.
Disclosures: None.
Disclaimers: None.
SUPPORTING INFORMATION
Additional supporting information may be found in the online version of this article:
Appendix SA1: Author Matrix.
Appendix S1: Did Copayment Changes Reduce Health-Service Utilization among CHIP Enrollees? Evidence from Alabama.
Please note: Wiley-Blackwell is not responsible for the content or functionality of any supporting materials supplied by the authors. Any queries (other than missing material) should be directed to the corresponding author for the article.
References
- American Association of Retired Persons (AARP) Public Policy Institute. 2008. “Strategies to Increase Generic Drug Utilization and Associated Savings” [accessed on September 30, 2011]. Available at http://assets.aarp.org/rgcenter/health/i16_generics.pdf.
- Artiga S, O'Malley M. Washington, DC: Kaiser Commission on Medicaid and the Uninsured; 2005. “Increasing Premiums and Cost Sharing in Medicaid and SCHIP: Recent State Experiences”. [accessed January 25, 2012]. Available at http://www.kff.org/medicaid/upload/Increasing-Premiums-and-Cost-Sharingin-Medicaid-and-SCHIP-Recent-State-Experiences-Issue-Paper.pdf. [Google Scholar]
- Boles M, Dilley J, Maher JE, Boysun MJ, Reid T. “Smoke-Free Law Associated with Higher-Than-Expected Taxable Retail Sales for Bars and Taverns in Washington State”. Preventing Chronic Disease. 2010;7(4):A79. [PMC free article] [PubMed] [Google Scholar]
- Busch SH, Barry CL, Vegso SJ, Sindelar JL, Cullen MR. “Effects of a Cost-Sharing Exemption on Use of Preventive Services at One Large Employer”. Health Affairs. 2006;25(6):1529–36. doi: 10.1377/hlthaff.25.6.1529. [DOI] [PubMed] [Google Scholar]
- Center for Children and Families (CCF) Georgetown University Health Policy Institute; 2008. “Cost Sharing for Children and Families in Medicaid and SCHIP”. [accessed on September 28, 2011]. Available at http://www.rwjf.org/files/research/3559.cost.sharing.pdf. [Google Scholar]
- Coughlin TA, Zuckerman S. “Three Years of State Fiscal Struggles: How did Medicaid and SCHIP Fare?”. Health Affairs (Project Hope) 2005 doi: 10.1377/hlthaff.w5.385. Suppl Web Exclusives:W5-385-98. [DOI] [PubMed] [Google Scholar]
- Hartung DM, Carlson MJ, Kraemer DF, Haxby DG, Ketchum KL, Greenlick MR. “Impact of a Medicaid Copayment Policy on Prescription Drug and Health Services Utilization in a Fee-for-Service Medicaid Population”. Medical Care. 2008;46(6):565–72. doi: 10.1097/MLR.0b013e3181734a77. [DOI] [PubMed] [Google Scholar]
- Ku L, Wachino V. “The Effect of Increased Cost Sharing in Medicaid: A Summary of Research Findings”. 2007. Washington, DC: Center on Budget and Policy Priorities. [accessed January 25, 2012]. Available at http://www.cbpp.org/archiveSite/5-31-05health2.pdf.
- Lee DS, Lemieux T. “Regression Discontinuity Designs in Economics”. Journal of Economic Literature. 2010;48:281–355. [Google Scholar]
- Leibowitz AA Rand Corporation, U.S. Department of Health and Human Services, and Rand Health Insurance Experiment. The Effect of Cost-Sharing on the Use of Medical Services by Children: Interim Results from a Randomized Controlled Trial. Santa Monica, CA: Rand Corporation; 1985. [Google Scholar]
- Lohr KN, Brook RH, Kamberg C, Goldberg GA, Leibowitz A, Keesey J, Reboussin D, Newhouse JP. Use of Medical Care in the RAND Health Insurance Experiment: Diagnosis- and Service-specific Analyses in a Randomized Controlled Trial. Santa Monica, CA: RAND Corporation; 1986. [PubMed] [Google Scholar]
- Ma M, McClintock S. “Regression Model Fitting with Quadratic Term Leads to Different Conclusion in Economic Analysis of Washington State Smoking Ban [letter]”. Preventing Chronic Disease. 2011;8(1):A26. [PMC free article] [PubMed] [Google Scholar]
- Newhouse JP. “Consumer-Directed Health Plans and The RAND Health Insurance Experiment”. Health Affairs. 2004;23(6):107–13. doi: 10.1377/hlthaff.23.6.107. [DOI] [PubMed] [Google Scholar]
- Newhouse JP, The Insurance Experiment Group . Cambridge, MA: Harvard University Press; 1993. “Free for All? Lessons from the Rand Health Experiment”. [Google Scholar]
- Selden TM, Kenney GM, Pantell MS, Ruhter J. “Cost Sharing in Medicaid and CHIP: How Does It Affect Out-of-Pocket Spending?”. Health Affairs (Project Hope) 2009;28(4):w607–19. doi: 10.1377/hlthaff.28.4.w607. [DOI] [PubMed] [Google Scholar]
- Tamblyn R, Laprise R, Hanley JA, Abrahamowicz M, Scott S, Mayo N, Hurley J, Grad R, Latimer E, Perreault R, McLeod P, Huang A, Larochelle P, Mallet L. “Adverse Events Associated with Prescription Drug Cost-Sharing among Poor and Elderly Persons”. JAMA: The Journal of the American Medical Association. 2001;285(4):421–9. doi: 10.1001/jama.285.4.421. [DOI] [PubMed] [Google Scholar]
- Wagner AK, Soumerai SB, Zhang F, Ross-Degnan D. “Segmented Regression Analysis of Interrupted Time Series Studies in Medication Use Research”. Journal of Clinical Pharmacy and Therapeutics. 2002;27(4):299–309. doi: 10.1046/j.1365-2710.2002.00430.x. [DOI] [PubMed] [Google Scholar]
- Wong MD, Andersen R, Sherbourne CD, Hays RD, Shapiro MF. “Effects of Cost Sharing on Care Seeking and Health Status: Results from the Medical Outcomes Study”. American Journal of Public Health. 2001;91(11):1889–94. doi: 10.2105/ajph.91.11.1889. [DOI] [PMC free article] [PubMed] [Google Scholar]
- Zuckerman IH, Lee E, Wutoh AK, Xue Z, Stuart B. “Application of Regression-Discontinuity Analysis in Pharmaceutical Health Services Research”. Health Services Research. 2006;41(2):550–63. doi: 10.1111/j.1475-6773.2005.00487.x. [DOI] [PMC free article] [PubMed] [Google Scholar]
Associated Data
This section collects any data citations, data availability statements, or supplementary materials included in this article.