

Abstract
Objective
To test whether two hospital-avoidance interventions altered rates of hospital use: “intermediate care” and “integrated care teams.”
Data Sources/Study Setting
Linked administrative data for England covering the period 2004 to 2009.
Study Design
This study was commissioned after the interventions had been in place for several years. We developed a method based on retrospective analysis of person-level data comparing health care use of participants with that of prognostically matched controls.
Data Collection/Extraction Methods
Individuals were linked to administrative datasets through a trusted intermediary and a unique patient identifier.
Principal Findings
Participants who received the intermediate care intervention showed higher rates of unscheduled hospital admission than matched controls, whereas recipients of the integrated care team intervention showed no difference. Both intervention groups showed higher rates of mortality than did their matched controls.
Conclusions
These are potentially powerful techniques for assessing impacts on hospital activity. Neither intervention reduced admission rates. Although our analysis of hospital utilization controlled for a wide range of observable characteristics, the difference in mortality rates suggests that some residual confounding is likely. Evaluation is constrained when performed retrospectively, and careful interpretation is needed.
Keywords: Program evaluation, administrative data uses, evaluation design and research, observational data/quasi-experiments
As in many developed countries, the number of older people in the United Kingdom with complex health and social care needs is expected to rise dramatically over the medium term (Wanless 2006). Efforts have been underway for several years to improve the efficiency and quality of care. By delivering more care in community settings, it is hoped that many admissions to hospitals may be prevented (Department of Health 2006). Unscheduled hospital admissions are both undesirable for the person concerned and expensive to the payer, costing over £1,000 ($1,600) on average. Preventing unplanned hospitalizations could therefore lead to large net savings (Billings and Mijanovich 2007).
It is widely assumed that many hospital admissions can be prevented if the right interventions are put in place. Many types of hospital-avoidance interventions have been proposed, ranging from case management for high-risk patients (Department of Health 2004) to the use of remote patient monitoring (Department of Health 2009), integrated care systems (Department of Health 2008), and changes to reimbursement mechanisms (Lansley 2010). Though evidence can be limited, health services across the world are already spending billions of dollars on hospital-avoidance schemes for chronic care (Ham 2009).
Although large randomized control trials provide valuable evidence, they are not always possible due to cost reasons, for example (Byar 1980) or because the decision to evaluate a program may only be made with hindsight. In practice, alternative approaches are required, but these approaches need to be robust to meet some significant challenges. For individual-based analyses, using questionnaires or surveys can be expensive and obtaining some information, for example, about medical conditions, can be difficult. An alternative approach is to analyze data structured at the area level and assume that changes observed within a larger population are the product of the intervention. This approach requires data to be available at the appropriate level, and it may be vulnerable to the ecological fallacy (Selvin 1958), especially as the number of patients involved in pilot programs is often quite small. In both cases, there is still the problem that people are often selected for inclusion in a program because of some factor linked to the outcomes of the evaluation. For example, people with current high levels of hospital use have a natural tendency to show reductions in use over time due to the statistical phenomenon known as “regression to the mean” (Roland et al. 2005). Not allowing for this effect can overstate the effect of an intervention. So, for example, a number of evaluations of hospital-avoidance interventions suffer from the limitation that they have focused primarily on comparisons of hospitalization rates before and after intervention, rather than comparing against what would have happened in the absence of intervention (Darkins et al. 2008; Mayhew 2009). Another challenge is that many interventions offered in the community are hard to define and evolve organically over time. Finally, preventive interventions can aim to have a long-term impact, and evaluations may need to follow up with participants for a protracted period.
One way to overcome the problem of recall bias is to use administrative data at the person level (Roos, Nicol, and Cageorge 1987). Such data are especially valuable where separate episodes of care across many providers can be linked to an individual over time. By using large amounts of administrative data, it is also possible to select matched controls retrospectively, and several techniques exist to do this. Propensity score methods collapse baseline variables to a single scalar quantity, which is the estimated probability that an individual will receive the intervention conditional on observed baseline variables (Rosenbaum and Rubin 1983). A control is then selected to have a similar propensity score to the individual receiving the intervention. More recently, prognostic score methods have been developed (Hansen 2008). These use a different scalar quantity, which is the estimated probability that an individual will experience the outcome (here, an unscheduled hospital admission) in the absence of the intervention conditional on observed baseline variables. These techniques have been applied in many evaluations of medical technologies such as pulmonary artery catheterization (Connors, Speroff, and Dawson 1996; Austin 2008; Sekhon and Grieve 2008). However, we are unaware of their use in any large-scale evaluations of complex community-based interventions.
In this article, we describe an evaluation approach in which we used person-level administrative data to create risk-adjusted, matched control groups. We then compared hospitalization rates for these controls with those of the study participants. We believe that this method addresses many of the challenges described above and we tested it by evaluating a hospital-avoidance program established by the Department of Health in England: the Partnerships for Older People Projects (POPPs).
Partnerships for Older People Projects were a range of schemes aimed at promoting health, well-being, and independence and preventing or delaying the need for hospital or institutional care. Twenty-nine projects were established. Between them, they ran 146 interventions, ranging from lunch clubs to hospital discharge interventions and rapid-response services. The POPPs program as a whole has been evaluated previously by Windle and colleagues (2009). Compared with other areas of England, they found considerable reductions in hospital use over time in areas of the country where POPPs had been established. Windle and colleagues concluded that for every £1 spent on the POPPs program, there was a net saving of approximately £1.20 from reductions in unscheduled hospital bed days. As a result of these findings, there has been interest in replicating these types of interventions more widely (Featherstone and Whitham 2010).
The current study was commissioned retrospectively, in 2009, after the program had been in place for several years. The purpose was to examine a carefully selected subset of interventions in more detail and to determine whether they had had an effect on rates of unscheduled hospital admission. In total, we evaluated eight interventions (Steventon et al. 2011), but here we focus only on two: an intermediate care service and integrated care teams:
The intermediate care service operated in a coastal town and aimed to support older people following discharge from the local general hospital. Multispecialty teams visited the wards of the hospital on a daily basis, coordinating the discharge of patients into the care of community-based generic health workers who performed health tasks such as monitoring blood pressure and testing blood and urine.
The integrated care teams operated in a large county and involved care management for older people. Twenty-three multidisciplinary teams were established throughout the county. Patients could be referred to the teams by general medical practitioners or after assessment by the local authority for support for social care needs. The teams included an advanced nursing practitioner, social care staff, pharmacists (in some teams), a voluntary sector coordinator, and a team coordinator. In addition, heart failure nurses and community psychiatric nurses worked across teams. The teams had access to a shared electronic medical record. Patients accepted onto the caseload could be discussed at weekly team meetings during which care was coordinated between the different team members.
Both of the interventions had complex aims that included reducing the number of unscheduled hospital admissions and hospital length of stay. They could conceivably have reduced hospital length of stay by facilitating faster discharge or increased planned activity as part of moving to a more managed system of care.
Methods
Analyses were based on retrospective linked datasets for hospital admissions.
Required Sample Size
We took the primary endpoint to be the number of unscheduled hospital admissions over 12 months. We thought it important to be able to detect relative changes in either direction of 15–20 percent should they occur, at power (1-Type II error) 90 percent and two-sided p-value (Type 1 error) < .05. Based on rates observed for people aged 75 and older, we assumed admission rates for patients receiving usual care of 0.3 per person per year. The standard deviation was also taken as 0.3. The calculations were performed in SAS 9.2 and assumed a correlation between the number of admissions for intervention and matched control patients of 0.15. Based on these assumptions, we would need 449 intervention patients to detect a change of 20 percent or 796 patients to detect a change of 15 percent.
Obtaining Pseudonymous Person-Level Data
We analyzed Hospital Episode Statistics (HES),1 a national database containing details of all hospital admissions and outpatient attendances paid for by the National Health Service at all acute hospitals in England. Access to person-level electronic data for health services research is protected by certain controls that arose in response to concerns for individuals’ rights, consent, and ownership (Bradley et al. 2010). In the United Kingdom, the requirements of the Data Protection Act typically have been interpreted as requiring that access to person-level data only be allowed where there is explicit consent or in situations where the data can be anonymized (Clark and Weale 2011).
The sites provided an intermediary with identifiable data in respect to patients who had received an intervention before December 2008 (9,491 records). The intermediary then sent the evaluation team pseudonymous data including the date on which individuals received the intervention and the HES ID, which can be used to link individuals to the HES database. We used the remainder of the HES database as the source of our controls (over 4 million people with a recent hospital admission). The approach was scrutinized by the Ethics and Confidentiality Committee of the National Information Governance Board, which confirmed that consent was not required from participants as no personally identifiable details would be made available to the evaluators.
Selecting Matched Controls
Our approach was to select, from a wider population of potential controls, a subgroup of matched controls that was sufficiently similar to the intervention group at baseline with respect to potential confounder variables.
Rather than draw controls from across the whole of the country, we limited the population of potential controls to people who lived in six other areas of England. These were selected for similar age structure, deprivation level, urban/rural nature, and ethnic mix in the intervention areas, leaving 152,208 potential controls. In other words, we used a two-stage matching approach: first matching at the area level and then at the person level. Our reasons for narrowing down the pool of potential controls in this way were threefold. First, hospital utilization rates vary nationally with area-level variables (Wennberg 1996). Second, limiting the datasets greatly improved the computational ease of finding controls. Third, although we could have selected controls from within the intervention areas, we considered that selecting controls from other areas would reduce the bias in our estimates. A common concern in matching studies is that, although intervention and control groups might be similar in every way that can be observed, it is possible that they differ systematically from each other according to some other unobserved factor. Known as residual confounding, this can lead to a hidden bias in the estimated treatment effect. We considered residual confounding to be a particular threat in our study because it was conducted retrospectively, and therefore, we had limited control over the range of data that were available. Note that if a particular characteristic of individuals is negatively associated with enrollment into the intervention, then that characteristic will be relatively concentrated in the set of people resident in the local area who did not receive the intervention. In comparison, the characteristic may be less prevalent among people residing in other areas. This type of bias is very difficult to assess because the variables cannot be observed. However, on the assumption that the unmatched prevalence rate of such variables was more similar among the general population of other areas than among residents of the intervention areas who did not receive the intervention, we concluded that we would be more likely to balance these unobserved variables by selecting controls from other areas.
From within these six comparison areas, we selected one control for each individual receiving the intervention. Matching on a variable that is related to assignment to the intervention, but not to the outcome, does not improve bias in the estimated effect, but it can worsen precision (Brookhart et al. 2006; Austin, Grootendorst, and Anderson 2007). We therefore aimed to select controls that were well matched on variables related to future hospital use. Predictors of unscheduled hospital admissions are well understood, with several case-finding predictive models in use in England (Billings et al. 2006). We matched on a set of variables similar to those used in such models, namely age, sex, categories of prior hospital utilization, total number of chronic health conditions, area-level deprivation score (Department of Communities and Local Government 2008), and 15 markers of specific health needs: anemia, angina, asthma, atrial fibrillation and flutter, cancer, cerebrovascular disease, congestive heart failure, chronic obstructive pulmonary disease, diabetes, history of falls, history of injury, hypertension, ischemic heart disease, mental health conditions, and kidney failure.
We chose to focus our analysis on people aged 70 and older to make the study population more homogenous. We only attempted to find controls for individuals receiving the interventions who had experienced a hospital admission in the 2 years before intervention (71 percent of patients). This was partly because inpatient data was our source of health needs variables, and so we could more fully characterize people with a recent inpatient admission. But secondly, we found that people who do not have an inpatient admission for 2 years typically have low rates of hospital utilization in the following year (just 0.1 admissions per person per year at age 80). Therefore, the scope for any intervention to reduce utilization in the short term for such people is very limited. We restricted our analysis to people receiving the intermediate care service between June 2006 and December 2007 and to people receiving care from the integrated care team between April 2008 and September 2008, to allow a sufficiently long follow-up period.
We chose the prognostic approach to the selection of controls because the mechanism by which individuals had been selected for the interventions was known to have varied over time and between districts. A propensity score would have therefore been difficult to estimate. In addition, the prognostic approach weights variables by how predictive they are of future hospital admissions. As we were most concerned with balancing variables that are strongly predictive of future hospital admissions, this helped us prioritize variables in the matching. We fitted prognostic models using logistic regression, using separate models for the two study areas and the month. The beta coefficients of the final models were then applied to the corresponding control areas.
Though individuals had been recruited into the intervention over several years, we wanted to select controls that were similar according to their characteristics at the start of intervention. We accomplished this in part by first narrowing the population of potential controls to those who had a similar prognostic score according to the model fitted at the end of the month of the intervention (within one-quarter of a standard deviation of the prognostic score from the score attached to the person receiving the intervention). The control we finally selected was the one that was most similar according to a set of baseline variables calculated at the precise date of the intervention, as assessed using a Mahalanobis distance (Mahalanobis 1936). Selecting controls one-to-one with replacement has been shown to minimize imbalance in average treatment effects (Abadie and Imbens 2006). We opted for matching without replacement so that there would be the same number of individuals in both groups.
We assessed the matching by the standardized difference (defined as the difference in sample means as a percentage of the square root of the average of sample variances). Some researchers have proposed that a standardized difference of greater than 10 percent denotes a meaningful imbalance (Normand et al. 2001). As the standardized difference only measures a difference in means, we used additional metrics to compare the distribution of covariates, including a comparison of variances.
Although we could not measure unobserved characteristics, we could quantify the susceptibility of our study to hidden bias using a Rosenbaum bound (Rosenbaum 2002). This is a form of sensitivity analysis that assumes that an unobserved variable exists that is perfectly correlated with the outcome (here, unscheduled hospital admissions). The bound is an estimate of how large an association between this unobserved variable and treatment group could be tolerated without altering the findings about the impact of the intervention. In other words, if such a variable exists and if the odds ratio of the prevalence of this variable between intervention and matched control groups was more than the bound, then findings would be altered.
Estimating the Effect of the Intervention
In our simplest analyses, we used a difference-in-difference analysis for the change in unscheduled hospital admissions from the year before to the year after the interventions. We assessed the significance of any differences we found between intervention and control patients using a paired t-test. We also made additional adjustments for residual imbalances in the characteristics of intervention and control patients after matching. This used mixed linear regression with the change in score as a dependent variable, and with intervention status and the characteristics controlled for in the matching as predictor variables (fixed effects). Random effects were included for the matched pair.
Although the rate of unscheduled hospital admission was our primary endpoint, we also tested for the impact on other forms of hospital utilization. Mortality was compared as part of a strategy to assess internal validity (West, Duan, and Pequegnat 2008). Only data on deaths in hospital were available. In 2008, such deaths constituted about 60 percent of all deaths in each area. Mixed logistic regression was used to assess the differences in mortality rates, controlling for those characteristics included in the matching.
Results
A total of 9,491 records listing people who had received an intervention before 31 December 2008 were sent by the sites to the intermediary; 5,710 of these received the intervention in the periods we specified. Of these, the intermediary was able to link 5,206 (91.2 percent) to the hospital data (Table 1). Over half (55 percent) of the records that did not link had incomplete linkage fields. We excluded all of the records that did not link from the subsequent analysis. After applying our exclusion rules, we were left with 556 people who received the intermediate care service and 2,557 people who received the input of the integrated care team.
Table 1.
Number of Records Included in Principal Analyses
| Breakdown of Study Cohort | ||||||
|---|---|---|---|---|---|---|
| Intervention | Number of Records in Study Cohort | Number in Study Cohort and Linked to HES | Under Age 70 | Older than 70 and No Inpatient Admission in Previous 2 years | Included in Analyses | Percent of Study Cohort Included in Analyses (%) |
| Intermediate care service | 722 | 673 | 27 | 90 | 556 | 77.0 |
| Integrated care team | 4,988 | 4,533 | 814 | 1,162 | 2,557 | 51.3 |
| Total | 5,710 | 5,206 | 841 | 1,252 | 3,113 | 54.5 |
Table 2 compares the characteristics of the people who received the interventions with the entire population of potential controls (i.e., individuals resident in the comparison areas who had had an inpatient admission in the last 2 years and were aged 70 or above) and with the matched controls. Before matching, there were very substantial differences, but after matching, standardized differences were below 1 percent for the prognostic score and below 10 percent for all but one of the variables related to demographics and service use. However, standardized differences were over 10 percent for some of the diagnosis markers.
Table 2.
Differences between Intervention and Control Groups before and after Matching
| Intermediate Care Service Intervention (N = 54,990 Potential Controls; 556 Matched Pairs) | Integrated Care Team Intervention (N = 97,218 Potential Controls; 2,557 Matched Pairs) | |||||||
|---|---|---|---|---|---|---|---|---|
| Potential Controls | Matched Controls | Intervention Group | Std. Difference | Potential Controls | Matched Controls | Intervention Group | Std. Difference | |
| Proportion aged 85+ | 21.6 | 46.2 | 46.2 | 0.0 | 23.9 | 48.0 | 48.0 | 0.0 |
| Proportion female | 56.5 | 65.3 | 65.3 | 0.0 | 54.5 | 65.0 | 65.0 | 0.0 |
| Area-level deprivation score | 16.3 | 16.4 | 17.0 | 6.2 | 16.8 | 17.1 | 17.7 | 7.9 |
| Mean unscheduled admissions (prior year) | 0.5 | 1.4 | 1.4 | 3.0 | 0.5 | 1.1 | 1.2 | 4.2 |
| Mean unscheduled admissions (prior 30 days) | 0.0 | 0.6 | 0.7 | 11.2 | 0.0 | 0.3 | 0.3 | 5.2 |
| Mean unscheduled length of stay (prior year) | 5.1 | 10.2 | 9.4 | 4.7 | 4.7 | 11.4 | 13.0 | 8.4 |
| Mean chronic conditions | 1.0 | 1.3 | 1.1 | 10.0 | 1.0 | 1.3 | 1.3 | 1.9 |
| Hypertension (%) | 34.9 | 43.2 | 30.4 | 26.7 | 37.0 | 41.0 | 34.0 | 13.6 |
| History of injury (%) | 14.9 | 25.4 | 24.5 | 2.1 | 16.6 | 27.0 | 35.0 | 16.3 |
| History of falls (%) | 8.1 | 16.0 | 11.3 | 13.6 | 8.2 | 16.0 | 21.0 | 12.6 |
| Atrial fibrillation and flutter (%) | 11.7 | 18.5 | 21.0 | 6.3 | 12.9 | 18.0 | 22.0 | 8.3 |
| Ischemic heart disease (%) | 13.8 | 15.5 | 20.9 | 14.0 | 15.0 | 18.0 | 16.0 | 5.8 |
| Cancer (%) | 14.6 | 10.6 | 14.4 | 11.4 | 16.0 | 15.0 | 16.0 | 1.4 |
| Diabetes (%) | 10.5 | 11.9 | 6.8 | 17.3 | 12.0 | 14.0 | 14.0 | 0.8 |
| Mental health (%) | 6.6 | 14.2 | 10.1 | 12.7 | 6.7 | 12.0 | 16.0 | 13.1 |
| Congestive heart failure (%) | 5.8 | 10.4 | 9.9 | 1.8 | 6.4 | 11.0 | 14.0 | 10.6 |
| Chronic obstructive pulmonary disease (%) | 5.5 | 10.6 | 8.3 | 8.0 | 6.0 | 9.0 | 10.0 | 2.7 |
| Asthma (%) | 5.4 | 5.8 | 5.6 | 0.8 | 5.8 | 6.0 | 5.0 | 4.3 |
| Cerebrovascular disease (%) | 6.1 | 9.0 | 7.6 | 5.2 | 5.8 | 9.0 | 14.0 | 14.3 |
| Angina (%) | 8.3 | 12.2 | 12.2 | 0.0 | 10.1 | 12.0 | 10.0 | 5.7 |
| Anemia (%) | 6.1 | 8.8 | 7.4 | 5.3 | 6.3 | 10.0 | 10.0 | 0.6 |
| Kidney failure (%) | 3.1 | 5.6 | 7.0 | 5.9 | 3.7 | 6.0 | 6.0 | 0.2 |
| Mean prognostic score | 22.3 | 33.5 | 33.6 | 0.4 | 13.6 | 20.0 | 20.0 | 0.7 |
The rate of unscheduled hospital admission was reduced for both intervention groups following the interventions (Table 3). However, when compared with the matched controls, there was no evidence of a relative reduction in unscheduled admissions in either case. For the intermediate care service, admissions fell more quickly for controls than for participants (Figure 1).
Table 3.
Rates of Unscheduled Hospital Admission per Head: Means (Standard Deviations)
| Intervention Group | Control Group | ||||||
|---|---|---|---|---|---|---|---|
| Intervention | Year before | Year after | Change | Year before | Year after | Change | Difference in Difference |
| Intermediate care service | 1.42 (1.40) | 1.06 (1.54) | −0.35** (1.78) | 1.38 (1.32) | 0.80 (1.30) | −0.58** (1.47) | 0.23** (1.95) |
| Integrated care team | 1.19 (1.38) | 0.74 (1.18) | −0.45** (1.65) | 1.14 (1.29) | 0.65 (1.15) | −0.49** (1.43) | 0.04 (1.64) |
Statistically significant at the 1% level.
Figure 1.
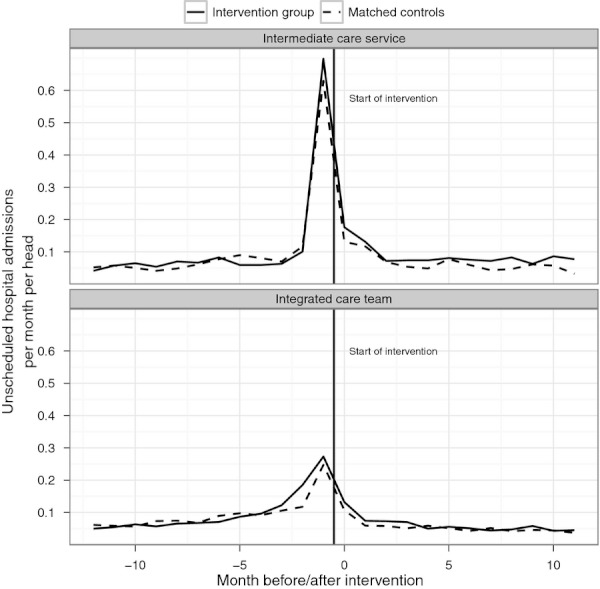
Number of Unscheduled Admissions per Head per Month
Compared with their matched control group, the number of bed days following unscheduled hospital admissions increased by 3.05 days per person for the integrated care team intervention and by 8.11 days per person for the intermediate care service (p < .001) (Table 4). We observed a reduction in outpatient attendances for both interventions compared with their controls, and a reduction in elective admissions for the integrated care team intervention only. Both intervention groups were more likely to die in the hospital following the intervention than the corresponding control group. Controlling for residual imbalances in characteristics between intervention and matched control patients within the mixed modeling framework did not change the significance of our estimates at the 5 percent level. Mixed logistic analysis confirmed the higher mortality observed in the intervention groups compared with the control groups, with an odds ratio of 1.75 (p < .01) for the intermediate care service, and 1.49 (p < .01) for the integrated care team. We calculated the Rosenbaum bound for unscheduled admissions to be 1.3 for the intermediate care service, at the 5 percent level.
Table 4.
Estimated Effect on Secondary Endpoints: Means (Standard Deviations)
| Intervention | Emergency Bed Days | Elective Admissions | Outpatient Attendances | Mortality Rate (%) |
|---|---|---|---|---|
| Intermediate care service | 8.11** (34.45) | −0.05 (1.41) | −0.62** (4.40) | 7.2** |
| Integrated care team | 3.05** (39.09) | −0.10** (1.78) | −0.54** (4.97) | 4.0** |
Statistically significant at the 1% level.
Discussion
Main Findings
The purpose of the study was to determine whether two community-based interventions had an effect on unscheduled hospital admission rates. We selected control groups that matched the intervention groups well in terms of age, sex, prior hospital utilization, 15 markers of specific health needs, total number of chronic health conditions, area-level deprivation score, and prognostic score. Although reducing unscheduled admissions was an explicit aim of both interventions, when compared with controls, we found no evidence of such reductions. Moreover, for the intermediate care service, we found that admission rates reduced more slowly for the intervention group than for the matched control group. Our findings are partly determined by the definition of “usual care” for the matched control group and are best interpreted as being relative to other measures being taken elsewhere for similar patients.
We were only able to analyze data from a certain proportion of the people who received the interventions. Certain individuals (8.8 percent) could not be linked to administrative data. Other individuals (36.7 percent) were not matched with a control, usually because they had no inpatient admission in the prior 2 years, but such individuals have limited scope for reduction in admission rates in the short term as their expected rates are so low in any case. Overall, we do not believe that our exclusions biased the results away from finding a reduction in admissions.
One difficulty associated with the limited amount of mortality data available to us relates to the selection of controls. A small proportion of controls may have died before the intervention began. We removed known deaths from the pool of potential controls, but we could not remove people who had died outside of a hospital. This may have made admission rates for the intervention group appear relatively high.
For both interventions, we found higher mortality rates for the intervention group than for their control group. As we only had data on deaths that occurred in a hospital, it is possible that this finding reflects differences in the location of death rather than in the total mortality rate. However, this possibility seems unlikely given that, at the aggregate area level, the proportion of deaths occurring in a hospital was similar to the intervention areas and their corresponding control areas. On the assumption that the interventions did not genuinely have an impact on mortality rates, it may be that these differences are indicative of some systematic, unobserved imbalance between the intervention and control groups. So a remaining question is whether any imbalances are likely to have been sufficiently large to alter the conclusions about unscheduled hospital admissions. The Rosenbaum bound for the intermediate care service was 1.3. A variable that differs in its prevalence between intervention and matched control groups with an odds ratio of more than 1.3 could therefore explain the observed association with unscheduled admissions. However, the Rosenbaum bound assumes that such a variable is perfectly correlated with the outcome, which is unlikely. In total, there were 40 more deaths in the intervention group than in the control group, but a relative increase of 126 admissions was observed. It seems unlikely that this number of admissions could be explained directly by 40 patients, given that patients experience around 2.1 unscheduled admissions in the last year of life nationally (Billings, Georghiou, and Bardsley unpublished data), though the characteristics of survivors may also have differed between groups in ways that were unobserved.
Although possible imbalances are a threat to internal validity, the ability to observe interventions that develop naturally, rather than in a trial setting, can increase the generalizability of findings. Furthermore, as we were able to analyze data for the vast majority of service users with a hospital history, the probability of examining a biased sample is low.
We conclude that we found no evidence for a reduction in unscheduled hospital admissions, even after controlling for a set of variables that is recognized as being predictive of such admissions. However, our findings are tempered by the difference we found in mortality rates, and a key question is whether there were any unobserved differences between the groups at baseline and, if so, whether these were large enough to alter our conclusions. We believe this is unlikely. A new study could be conducted on a prospective basis, and indeed the analysis presented here would be useful for establishing required sample sizes. However, as the interventions were some way from showing a reduction in unscheduled hospital use, there may be limited appetite for conducting such a trial.
Comparison to Previous Evaluation
The national evaluation by Windle and colleagues concluded that there was a net saving of approximately £1.20 for every £1 invested through reductions in unscheduled hospital bed days associated with the POPPs. In contrast, the current study found no reductions in the use of acute hospitals.
One of the main differences between the studies is the number of interventions covered. We studied person-level data rather than ecological data, and this reduces the risk of falsely attributing findings at the site level to the subset of individuals who received an intervention. However, there may be merits to ecological methods (Schwartz 1994). Three observations are relevant here: concerning exposure, independent variables, and dependent variables. First, the current person-level study examined the impact of exposure to a specific intervention, but the ecological study considered the combined impact of all of the strands operated by a particular project. In defense of our approach, knowledge about the impact of a specific intervention is of practical use to commissioners of services. Second, some ecological analyses might use aggregated dependent variables as proxies for factors that are hard to measure at the individual level, such as the broader cultural impact of the program. However, the national evaluation made clear conclusions about cost savings. Third, hospital utilization depends on area-level factors, such as deprivation. Although this observation can argue against using purely person-level data, in the current study we selected controls that were matched on both person-level and area-level variables. We conclude that differences in the unit of analysis could explain a portion of the differences in the results of the two studies, but that the person-level study may be of more practical value for commissioners considering whether to replicate one of these interventions.
Implications for Evaluation of Hospital-Avoidance Schemes
This study was conducted in a challenging context, where the evaluation was commissioned up to 3 years after the intervention had begun. Although this is not an ideal situation for research, the need to analyze historic data arises not infrequently because perceptions of evaluation requirements can change over time. We believe that this study has provided some lessons for retrospective evaluation of complex interventions in the community where change in hospital utilization is a key outcome measure. In particular, the use of person-level data and matched control groups meant it was possible to take into account some of the expected drop in admissions that occurs when high-risk cases are selected for an intervention. In the absence of a control group, a simple pre–post comparison of unscheduled admissions would have suggested that there were reductions in hospitalization rates associated with both interventions. We conclude that causal inference based only on a pre–post comparison for the intervention group is not generally defensible in this context.
Administrative data on hospital utilization have considerable practical advantages in that they are relatively inexpensive to collect, timely, and can be linked across time. However, the accuracy of the data must be considered (Cleary and Jette 1984; Bellón et al. 2000). We agree with the recommendation by West and colleagues (2008) that the analysis of multiple endpoints can provide information about the possibility of bias due to unobserved confounders.
Implications for Policy Making
We conclude that the two interventions did not appear to have reduced the use of acute hospitals. In this study, we only monitored hospital admissions in the 12 months after intervention, so it is possible that they had greater impact over longer timeframes or on other services. However, other evaluations of hospital-avoidance initiatives have reported no effect on hospital admissions, including the EverCare evaluation of case management in the United Kingdom (Gravelle et al. 2007). One hypothesis is that the process of “case finding” identifies new problems which end up requiring hospital admission.
If hospital-avoidance strategies are to be successful, more information will be needed about the effectiveness of different initiatives. As the required datasets and predictive models are widely in use, these techniques could be applied in a routine way from within the health service for ongoing evaluation and audit.
Acknowledgments
Joint Acknowledgment/Disclosure Statement: This study was sponsored by the Department of Health in England, which also funded the Partnership for Older People Projects (POPPs) program evaluated in the study. The authors are grateful for the assistance of staff in the POPPs sites for supplying the data analyzed. We would also like to acknowledge the invaluable assistance that we received with the data linkage from the NHS Information Centre for health and social care, and guidance received from our colleagues Ian Blunt and Jennifer Dixon.
Disclosures: None.
Disclaimers: None.
Note
http://www.hesonline.nhs.uk/Ease/servlet/ContentServer?siteID=1937 [accessed on February 16, 2011].
SUPPORTING INFORMATION
Additional supporting information may be found in the online version of this article:
Appendix SA1: Author Matrix.
Please note: Wiley-Blackwell is not responsible for the content or functionality of any supporting materials supplied by the authors. Any queries (other than missing material) should be directed to the corresponding author for the article.
References
- Abadie A, Imbens G. “Large Sample Properties of Matching Estimators for Average Treatment Effects”. Econometrica. 2006;74:235–67. [Google Scholar]
- Austin PC. “A Critical Appraisal of Propensity-Score Matching in the Medical Literature between 1996 and 2003”. Statistics in Medicine. 2008;27:2037–49. doi: 10.1002/sim.3150. [DOI] [PubMed] [Google Scholar]
- Austin PC, Grootendorst P, Anderson GM. “A Comparison of the Ability of Different Propensity Score Models to Balance Measured Variables between Treated and Untreated Subjects: A Monte Carlo Study”. Statistics in Medicine. 2007;26:734–53. doi: 10.1002/sim.2580. [DOI] [PubMed] [Google Scholar]
- Bellón JA, Lardelli P, de Dios LJ, Delgado A. “Validity of Self Reported Utilisation of Primary Health Care Services in an Urban Population in Spain”. Journal of Epidemiology and Community Health. 2000;54:544–51. doi: 10.1136/jech.54.7.544. [DOI] [PMC free article] [PubMed] [Google Scholar]
- Billings J, Mijanovich T. “Improving the Management of Care for High-Cost Medicaid Patients”. Health Affairs. 2007;26(6):1643–54. doi: 10.1377/hlthaff.26.6.1643. [DOI] [PubMed] [Google Scholar]
- Billings J, Dixon J, Mijanovich T, Wennberg D. “Case Finding for Patients at Risk of Readmission to Hospital: Development of Algorithm to Identify High Risk Patients”. British Medical Journal. 2006;333:327. doi: 10.1136/bmj.38870.657917.AE. [DOI] [PMC free article] [PubMed] [Google Scholar]
- Bradley CJ, Penberthy L, Devers KJ, Holden DJ. “Health Services Research and Data Linkages: Issues, Methods, and Directions for the Future”. Health Services Research. 2010;45(5p2):1468–88. doi: 10.1111/j.1475-6773.2010.01142.x. [DOI] [PMC free article] [PubMed] [Google Scholar]
- Brookhart M, Schneeweiss S, Rothman KJ, Glynn RJ, Avorn J, Stürmer T. “Variable Selection for Propensity Score Models”. American Journal of Epidemiology. 2006;173:1149–56. doi: 10.1093/aje/kwj149. [DOI] [PMC free article] [PubMed] [Google Scholar]
- Byar D. “Why Data Bases Should Not Replace Randomized Clinical Trials”. Biometrics. 1980;36:337–42. [PubMed] [Google Scholar]
- Clark S, Weale A. 2011. “Information Governance in Health: An Analysis of the Social Values Involved in Data Linkage Studies.” The Neufield Trust [accessed on December 12, 2011]. Available at: http://www.nuffieldtrust.org.uk/sites/files/nuffield/information_governance_in_health_-_research_report-_aug11.pdf.
- Cleary PD, Jette AM. “The Validity of Self-Reported Physician Utilization Measures”. Medical Care. 1984;22:796–803. doi: 10.1097/00005650-198409000-00003. [DOI] [PubMed] [Google Scholar]
- Connors AF, Speroff TS, Dawson NV, Wagner CThomas, FE, Harrell D, Desbiens N, Goldman L, Wu AW, Califf RM, Vidaillet WJ, Jr., Fulkerson, H, Broste S, Bellamy P, Lynn J, Knaus WA. “The Effectiveness of Right Heart Catheterization in the Initial Care of Critically Ill Patients”. Journal of the American Medical Association. 1996;276:889–97. doi: 10.1001/jama.276.11.889. [DOI] [PubMed] [Google Scholar]
- Darkins A, Ryan P, Kobb R, Foster L, Edmonson E, Wakefield B, Lancaster AE. “Care Coordination/Home Telehealth: The Systematic Implementation of Health Informatics, Home Telehealth, and Disease Management to Support the Care of Veteran Patients with Chronic Conditions”. Telemedicine and e-Health. 2008;14 (10):1118–26. doi: 10.1089/tmj.2008.0021. [DOI] [PubMed] [Google Scholar]
- Department of Communities and Local Government. 2008. “The English Indices of Deprivation 2007.” [accessed on December 12, 2011]. Available at: http://www.communities.gov.uk/publications/communities/indiciesdeprivation07.
- Department of Health. The NHS Improvement Plan: Putting People at the Heart of Community Services. Cm 6268. London: The Stationery Office; 2004. [Google Scholar]
- Department of Health. Our Health, Our Care, Our Say: A New Direction for Community Services. Cm 6737. London: The Stationery Office; 2006. [Google Scholar]
- Department of Health. High Quality Care for All: NHS Next Stage Review Final Report. Cm 7432. London: The Stationery Office; 2008. [Google Scholar]
- Department of Health. Whole System Demonstrators: An Overview of Telecare and Telehealth. London: The Department of Health; 2009. [Google Scholar]
- Featherstone H, Whitham L. Careless: Funding Long-Term Care for the Elderly. London: Policy Exchange; 2010. [Google Scholar]
- Gravelle H, Dusheiko M, Sheaff R, Roland M. “Impact of Case Management (Evercare) on Frail Elderly Patients: Controlled before and after Analysis of Quantitative Outcome Data”. British Medical Journal. 2007;334(7583):31. doi: 10.1136/bmj.39020.413310.55. [DOI] [PMC free article] [PubMed] [Google Scholar]
- Ham C. “Chronic Care in the English National Health Service: Progress and Challenges”. Health Affairs. 2009;28(1):190–201. doi: 10.1377/hlthaff.28.1.190. [DOI] [PubMed] [Google Scholar]
- Hansen B. “The Prognostic Analogue of the Propensity Score”. Biometrica. 2008;95:481–8. [Google Scholar]
- Lansley A. 2010. “Speech by the Rt Hon Andrew Lansley CBE MP, Secretary of State for Health, 8 June 2010: ‘My Ambition for Patient-Centred Care’” [accessed on January 5, 2010]. Available at http://www.dh.gov.uk/en/MediaCentre/Speeches/DH_116643.
- Mahalanobis PC. “On the Generalised Distance in Statistics”. Proceedings of the National Institute of Sciences in India. 1936;2(1):49–55. [Google Scholar]
- Mayhew L. “On the Effectiveness of Care Co-ordination Services Aimed at Preventing Hospital Admissions and Emergency Attendances”. Health Care Management Science. 2009;12:269–84. doi: 10.1007/s10729-008-9092-5. [DOI] [PMC free article] [PubMed] [Google Scholar]
- Normand ST, Landrum MB, Guadagnoli E, Ayanian JZ, Ryan TJ, Cleary PD, McNeil BJ. “Validating Recommendations for Coronary Angiography Following Acute Myocardial Infarction in the Elderly: A Matched Analysis Using Propensity Scores”. Journal of Clinical Epidemiology. 2001;54:387–98. doi: 10.1016/s0895-4356(00)00321-8. [DOI] [PubMed] [Google Scholar]
- Roland M, Dusheiko M, Gravelle H, Parker S. “Follow up of People Aged 65 and Over with a History of Emergency Admissions: Analysis of Routine Admission Data”. British Medical Journal. 2005;330:289–92. doi: 10.1136/bmj.330.7486.289. [DOI] [PMC free article] [PubMed] [Google Scholar]
- Roos LL, Nicol JP, Cageorge SM. “Using Administrative Data for Longitudinal Research: Comparisons with Primary Data Collection”. Journal of Chronic Diseases. 1987;40(1):41–9. doi: 10.1016/0021-9681(87)90095-6. [DOI] [PubMed] [Google Scholar]
- Rosenbaum P. Observational Studies. 2d Edition. New York: Springer-Verlag; 2002. [Google Scholar]
- Rosenbaum PR, Rubin DB. “The Central Role of the Propensity Score in Observational Studies for Causal Effects”. Biometrica. 1983;70:41–55. Health Research and Educational Trust. DOI: 10.1111/j.1475-6773.2008.00834.x. [Google Scholar]
- Schwartz S. “The Fallacy of the Ecological Fallacy: The Potential Misuse of a Concept and the Consequences”. American Journal of Public Health. 1994;84(5):819–24. doi: 10.2105/ajph.84.5.819. [DOI] [PMC free article] [PubMed] [Google Scholar]
- Sekhon JS, Grieve R. 2008. “A New Non-Parametric Matching Method for Bias Adjustment with Applications to Economic Evaluations.” iHEA 2007 6th World Congress: Explorations in Health Economics Paper [accessed January 5, 2011]. Available at SSRN: http://ssrn.com/abstract=1138926.
- Selvin H. “Durkheim's Suicide and Problems of Empirical Research”. American Journal of Sociology. 1958;63:607–19. [Google Scholar]
- Steventon A, Bardsley M, Billings J, Georghiou T, Lewis G. An Evaluation of the Impact of Community-Based Interventions on Hospital Use. London: Nuffield Trust; 2011. Available at http://www.nuffieldtrust.org.uk/sites/files/nuffield/an-evaluation-of-the-impact-of-community-based-interventions-on-hospital-use-full_report.pdf. [Google Scholar]
- Wanless D. Securing Good Care for Older People: Taking a Long-Term View. London: King's Fund; 2006. [Google Scholar]
- Wennberg JE. The Dartmouth Atlas of Health Care. Dartmouth, NH: Center for the Evaluative Clinical Sciences; 1996. [Google Scholar]
- West SG, Duan N, Pequegnat W, Des Jarlais PGaist, DC, Holtgrave D, Szapocznik J, Fishbein M, Rapkin B, Clatts M, Mullen PD. “Alternatives to the Randomised Controlled Trial”. American Journal of Public Health. 2008;98(8):1359–66. doi: 10.2105/AJPH.2007.124446. [DOI] [PMC free article] [PubMed] [Google Scholar]
- Windle K, Wagland R, Forder J, D'Amico F, Janssen D, Wistow G. National Evaluation of Partnerships for Older People Projects. London: The Department of Health; 2009. [Google Scholar]
Associated Data
This section collects any data citations, data availability statements, or supplementary materials included in this article.