


Abstract
Sequence elements, at all levels—DNA, RNA and protein, play a central role in mediating molecular recognition and thereby molecular regulation and signaling. Studies that focus on measuring and investigating sequence-based recognition make use of statistical and computational tools, including approaches to searching sequence motifs. State-of-the-art motif searching tools are limited in their coverage and ability to address large motif spaces. We develop and present statistical and algorithmic approaches that take as input ranked lists of sequences and return significant motifs. The efficiency of our approach, based on suffix trees, allows searches over motif spaces that are not covered by existing tools. This includes searching variable gap motifs—two half sites with a flexible length gap in between—and searching long motifs over large alphabets. We used our approach to analyze several high-throughput measurement data sets and report some validation results as well as novel suggested motifs and motif refinements. We suggest a refinement of the known estrogen receptor 1 motif in humans, where we observe gaps other than three nucleotides that also serve as significant recognition sites, as well as a variable length motif related to potential tyrosine phosphorylation.
INTRODUCTION
Transcription factor (TF) activity is important and central in regulating cellular processes. TFs recognize their specific targets using molecular pattern recognition mechanisms that are not completely understood. One challenge in improving this understanding is the discovery of sequence motifs that partake in this recognition and targeting mechanism. The discovery of sequence motifs helps in constructing models and in explaining sequence variation that may have functional effect.
The occurrence of recognition sequences in RNA molecules plays a central role in enabling controlled regulation by RNA-binding proteins (RBPs) and by microRNAs (miRNAs). For example, the Pumilio family (Puf) proteins constitute a highly conserved family of RBPs that regulate target messenger RNAs (mRNAs) via binding-specific RNA sequences in their 3′UTRs (1). PUF3, PUF4 and PUF5 in Saccharomyces cerevisiae, and PUM1 in humans, are known to bind sequences that contain a core ‘UGUR’ tetranucleotide followed by sequences that vary between members of this family (2–4). PUF1 and PUF2 in S. cerevisiae bind sequences containing the dual UAAU motif (5). In the case of miRNAs, it is known that they act by binding to the 3′UTR of mRNAs, forming hybrids that consist of the binding site in the 3′UTR and of the miRNA seed region (positions 2–8 in the miRNA). MiRNAs play important regulatory roles, and it is estimated that more than one-third of the human protein coding genes are regulated by miRNAs (6).
In addition, protein modification and protein–protein interactions are also potentially driven by mechanisms that involve specific protein-sequence recognition. Many ATP- and GTP-binding proteins have a phosphate-binding loop (P-loop), which typically consists of the sequence motif (A/G)X4GK(S/T), i.e. alanine or glycine followed by a spacer of length 4 that is followed by a glycine, then lysine and a serine or threonine (7,8).
The important role played by sequence elements in molecular regulation and signaling, as discussed above, is the motivation for significant scientific and technological development activity that focuses on measuring sequence-based recognition and on computational approaches and analysis tools designed to improve our understanding of regulation mechanisms involving sequence elements.
Techniques, such as ChIP-chip (9), ChIP-PET (10) and ChIP-seq (11) provide large volumes of genome-wide data on regions of transcription factor binding, measured in actual samples and in various conditions. Similarly, mRNA targets of RBPs are studied using techniques like RIP-chip (4) and CLIP (12). SILAC (13) and other proteomics techniques can be used to characterize the effect of amino acid sequences on protein function. Computational tools and approaches to motif discovery form part of the data analysis workflow that is used to extract knowledge and understanding from data generated through the above techniques as well as other measurement approaches.
Motif discovery has attracted much research interest in recent years, resulting in more than a hundred different tools for motif discovery (14). A large subset of motif finders, such as MEME (15), NMica (16), AlignACE (17) or MDscan (18), fit position weight matrices (PWMs) to the sequence data. Most techniques, including those mentioned above, approach motif finding by discovering sequence elements that occur more often than expected in a set of sequences. Some techniques compare a target set to a background set. It is often the case, however, in biological measurement data that results are given as a ranked list of quantities. For example, Gerber et al. (2) report on the set of targets for five RNA-binding proteins from the Pumilio family, including binding ratios for each S. cerevisiae gene. This is the also the case for expression profiling studies as well as for all the aforementioned ChIP techniques, whether based on microarrays or on sequencing. Statistical approaches, such as GSEA (19) and minimum hypergeometric (mHG) (20–22), address enrichment in ranked lists of elements. Based on the mHG statistics, DRIM is a motif-finding tool (20) that exploits the ranking derived from experimental measurements to discover motifs that are rank imbalanced in the input list.
While most motif-finding approaches consider continuous sequence elements, it is of interest to also consider gapped sequence elements. For example, GAL4 in S. cerevisiae binds DNA as a homodimer. Its binding site comprises 17 bp, containing palindromic CGG triplets at the ends that are separated by an 11 bp gap (23). Additionally, PUF2 in S. cerevisiae binds 3′UTR of mRNAs by recognizing a motif of two UAAU tetranucleotides separated by a three nucleotides linker sequence (5). Therefore, an interesting case, related to the role of gapped motifs, is of a protein that binds the DNA or RNA as a dimer. There are also cases where recognition is based on sequence elements with variable length gaps separating the half sites. An important example is the recognition site of the tumor protein p53 (TP53). In many organisms, this site is composed of two copies of the half-site RRRCWWGYYY separated by a spacer, usually of length 0–21 bp (24).
Computational models of dimers binding to two half-sites that feature certain spacing rules were suggested in a handful of recent studies. Several algorithms, including BioProspector (25), Gemoda (26), SPACER (27), SPACE (28) and GLAM2 (29) deal with the problem of discovering gapped motifs. van Helden et al. (30) consider a model of a spaced pair of trinucleotides, separated by a spacer of a fixed length (e.g. 0–16 nt). The algorithm exhaustively tests all 46 combinations of pairs of trinucleotides. This method is highly efficient in detecting sites bound by C6Zn2 binuclear cluster proteins. However, it allows no flexibility in the motif structure in the context of dyad size and spacer characterization. Carvalho et al. (31) proposed an algorithm named RISO to find structured motifs. The algorithm provides flexibility in the sense that it allows mismatches in the sites during search, and variable length spacing is supported. It also uses truncated suffix trees instead of an exhaustive search to efficiently enumerate candidate motifs. The main drawback of this method is its inability to deal with large amounts of sequence data since its complexity grows rapidly both in time and in space. Chen et al. (32) developed a method for discovering discontinuous patterns among input sequences by linking short motifs that are located at conserved regions with a flexible gap of length 0–15. One limitation of this algorithm is that it uses positive and negative sets to filter candidate motifs based on ChIP-chip P-value fixed thresholds. Furthermore, as gapped motifs may consist of half-sites that are not independently enriched, this method will potentially miss some significant results. Recently, a gapped PWM model was suggested for discovering variable length DNA-binding sites (33). This model extends the PWM model by introducing an optional gap character, which may appear once and at a certain position inside the motif, to simply model variable-length motifs. A main drawback of this model is that the gap can be one base only. To the best of our knowledge, none of the methods listed above can efficiently discover variable gapped motifs under a definition that allows full flexibility of the gap.
As evidenced in the work cited above, the search for variable gapped motifs (VGMs) poses a tremendous computational challenge, as the search space becomes huge, when considering parameters of biological relevance. Specifically, if we seek DNA motifs containing two-half sites, each of length 4, where the gap between the 4-mer half sites can be any subset of the numbers {0, … , 10}, then an exhaustive search will span 48 × 211 candidates, which is far too large to routinely address in reasonable time.
We mentioned the role of amino acid sequence motifs in mediating ATP and GTP binding. Another example of the role of protein motifs is the motif HRDLAARN which is conserved in the catalytic domain of protein-tyrosine kinases (34–36) and which we come back to in our ‘Results’ section. Protein alphabet is large and therefore protein motif search also poses a computational challenge.
Therefore, to address the discovery of VGMs, long motifs, or to deal with large alphabets, we cannot take a naïve approach that uses exhaustive search over the motif space. In this work, we developed an efficient statistical and algorithmic approach to searching motifs in ranked lists of sequences. Our method, implemented in DRIMUST, has several advantages over existing methods. First, unlike many other approaches, it does not exhaustively search over motif spaces and therefore can detect variable gapped motifs, long motifs and motifs over large alphabets. Furthermore, we search motifs in ranked lists and not in fixed sets of sequences as is the case for many other methods. And, most important, to the best of our knowledge, DRIMUST is unique in efficiently addressing variable gap motifs under a definition that allows full flexibility of the gap. Specifically, methods that fit PWMs to the sequence data are limited in addressing variable gap motif discovery under this broad definition. This intrinsic shortcoming of PWM representations is evidenced, for example, by the limitations (to a single character gap) of the model described in (33).
Our approach to overcoming the computational challenges associated with large motif search spaces is based on using suffix trees, to restrict our attention to motifs that actually occur in the input list of sequences. A suffix tree is a data structure that represents all the suffixes of a given string in a way that allows fast implementation of many string operations. Suffix trees are useful in many application contexts, including bioinformatics and computational biology (37,38). Perhaps the simplest application example comes from the context of text search. Consider the substring problem, whose input is text T of length M. After an O(M) preprocessing, one is required to determine, for any string S of length m, in O(m) time, whether S occurs in T or not. Using a suffix tree, these performance bounds can actually be achieved. Constructing a suffix tree for T can be done in O(M) time (39–41). Given a substring S of length m, all we now need to do is search for the path S in the tree, starting from the root, an O(m) operation. This O(M) preprocessing and O(m) search solution for the substring problem is very surprising and extremely useful, especially since M may be huge compared to m.
There are several algorithmic approaches to the construction of a suffix tree for a single string in linear time (39–41). These methods easily extend, with small modifications, to represent the suffixes of a collection  of strings. A generalized suffix tree is a data structure that contains all suffixes of a set of strings (see ‘Materials and Methods’ section) and can be built in O(M) time, where
  . A path from the root to a leaf in the tree represents a suffix. Each leaf of the tree holds information about the indices of strings that contain the suffix, and the starting positions of this suffix within each such string. Restoring all occurrences of a suffix is thus enabled. A natural application of generalized suffix trees is finding substrings that are common to a large number of distinct strings. This question can arise in many different contexts, for example in database search, in multiple sequence alignment and in motif search. Finding DNA, RNA or protein substrings that commonly occur in a set of biologically related sequences help to point out regions or patterns that may be functional. This problem can be efficiently solved using a generalized suffix tree (37,38,42).
A useful variant of this problem is finding rank imbalanced motifs, given a ranked list of sequences  . Rank imbalanced motifs are substrings that appear more often at the top of the list compared with the remainder of the list. This notion of rank imbalanced motifs was introduced by Zilberstein et al. (43) and by Eden et al. (20) who described the mHG statistics used for the assessment of such motifs. A unique feature of the mHG statistics is that the cutoff between the top and the rest of the list is determined in a data-driven manner so as to maximize the motif enrichment. This is done by computing the motif enrichment over all possible set partitions and identifying the cut-off at which maximal statistical significance is observed. Here, we present an algorithm that uses generalized suffix trees for an efficient enumeration of motif candidates, which are then assessed using the mHG statistics. The occurrences of each candidate motif in the list are extracted from the extra information stored in the leaves of the tree.
In summary, the contribution of this article is:
An efficient algorithm for searching motifs in ranked lists of sequences. The efficiency of our approach enables us to search motifs over large alphabets (such as amino acids) as well as motifs of length 20 or more, all in a reasonable time. Specifically, searching for DNA motifs of length 4–20 in S. cerevisiae, over 6000 sequences (each of length 500 bp), takes less than 3 min on a standard PC.
An extension of the above approach that enables searching for variable gap motifs efficiently. We are not aware of any other method that can efficiently search variable gap motifs while allowing full flexibility in the gap model. Specifically, searching, in S. cerevisiae, for VGMs comprising two 4-mer half sites separated by gaps that form any subset of the lengths {0, … ,10} (∼6000 DNA sequences, each of length 500 bp) takes less than 7 min on a standard PC.
An efficient implementation of the above approaches. Software is available at http://bioinfo.cs.technion.ac.il/people/zohar/DRIMUST-code-VGM/.
- Biological results:
- Validation of known DNA, RNA and protein motifs through the analysis of high-throughput measurement data sets. For example, we validated the binding motifs of the transcription factors REB1 (TTACCCG), ABF1 (ATCAN6ACGA) and GCN4 (TGACTCA) in S. cerevisiae.
- Suggested refinement and a potential better characterization of known motifs. For instance, we found a significant enrichment of the palindromic motif comprising the half sites GTCA and TGAC, which are separated by a gap of length 3, 6 or 9 bp, among human estrogen receptor 1 (ESR1) binding sequences.
- Hypothesized novel motifs. Interestingly, a variable gapped motif comprising the dual CGCG half site was predicted as the DNA-binding motif of SWI6 in S. cerevisiae. The gap in this case can be of any length in 1, 3, 5, 8, 9 and 10. Another significant prediction was the motif HRDLAARN-X12-DFGL-X33-39-SDVW, found among tyrosine phosphorylated peptides.
In the ‘Materials and Methods’ section, we start with describing algorithmics for finding fixed structure motifs in ranked lists. We then extend this framework to efficiently solve the problem of variable gapped motifs. These algorithms are further applied to biological data sets. More technical details related to statistics, algorithmics and to the actual data analysis are also included in the ‘Materials and Methods’ section. Short descriptions of the biological findings are presented in the ‘Results’ section. Finally, we address significance, advantages and limitations of our approach and biological results in the ‘Discussion’ section.
MATERIALS AND METHODS
Algorithmics
In this section, we describe our suffix tree approach to motif searching in the context of large alphabets and of ranked lists of sequences, based on the mHG statistical model (all definitions appear later on in this section). We start with the non-gapped version and then move to the more complicated-gapped version. We discuss performance in the context of biologically relevant properties of the input.
DRIMUST—algorithm for the case of a fixed structure motifs
The algorithm is described in Table 1.
Table 1.
DRIMUST – fixed-structure motifs algorithm
|
|


Time complexity
Given a path P of length k in the tree, to calculate P's enrichment one first needs to find C(P)—the list of P's occurrences. Assuming that P occurs at most once in a sequence, this takes time proportional to k + |C(P)|, because walking on the path P in the tree is proportional to k (P's length), and the size of the subtree rooted at P is proportional to the number of leaves in that subtree, which is equal to |C(P)|. Then, the mHG score is calculated by computing HGT for every member in C(P), such that each HGT calculation takes O(|C(P)|) time. In total, calculating P's enrichment is an O(|C(P)|2). Therefore, the total complexity of this algorithm is  , where P ranges over all paths of length k in the suffix tree (k1 ≤ k ≤ k2).
To evaluate this quantity, we generated 100 lists of sequences taken randomly from the S. cerevisiae genome, each sequence of length 500, and every list contained 1000–2000 sequences. We then estimated Ψ for motifs (k-mers) of lengths 7, 10 and 13 in all lists. We also tested actual running time for these data sets and observed a linear behavior in the total length of the sequences in the data set (Supplementary Figure S1). Additionally, practical performance results, for actual biological data sets, are reported in the ‘Results’ section.
DRIMUST—variable gapped motif search algorithm
The algorithm is described in Table 2.
Table 2.
DRIMUST – variable gapped motif search algorithm
The algorithm is schematically described in Figure 1.
| ||
| ||
|


DRIMUST implementation note regarding length combinations of the gap
Given a pair of half sites P and Q, recall the definition of 
 , representing all gaps for which a string P-Nλi-Q, where
  , occurs in the text. As described above, for each pair of half sites P and Q, all subsets
 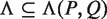 should be considered as candidates for the gap, representing all variable gap motifs P-NΛ-Q. Using the suffix tree approach,
  contains only lengths of gaps that actually connect P and Q in the text, and therefore we can avoid searching over all
  possible instantiations of Λ. In our implementation of DRIMUST, a single motif P–NΛ–Q is returned in the output. This is the most significant one among all motifs of the form P–NΦ–Q where
  .
.
Additionally, in order to speed up computations, as a first step, we test all pairs of half sites P and Q that occur in the text, but focus only on singletons of lengths for the gap between the half sites. As a second step, we narrow the search to the most significant 50 pairs of half sites P and Q, and only for them we test all 2Λ(P,Q) length combinations, finding the most significant motif for P,Q. These 50 motifs are then returned as output to the user, assuming they are sufficiently significant, as determined by the threshold. This heuristic is optional but is recommended for large data sets.
Enrichment analysis (using mHG statistics)
An approach has been previously described (20) to identify the enrichment of a set of genes, A, in a ranked list of genes, using mHG statistics. Given a total number of genes N, with B of these genes belonging to A, and n of these genes being in the target set (e.g. differentially expressed genes), the probability that b or more genes from the target set are also in A is given by the tail of a hypergeometric random variable (HGT):
 |
For a ranked genes list  , we define a label vector λ = λ1, …, λN∈{0,1}N according to the association of the ranked genes to A, that is, λi = 1 if and only if gi∈A. The mHG score is then defined as:
where  .
.
In other words, the mHG score is the optimal HGT probability that is found over all possible partitions induced by the ranking. As such, this score must be corrected for multiple testing. A dynamic programming algorithm for computing the exact p-value of a given mHG score is described in (20). More specifically, given a ranked list of genes, a subset A, and a corresponding mHG score s, the mHG P-value tells us the exact probability of observing an mHG score s' ≤ s under the null assumption that all occurrence configurations of A in the ranked list are equi-probable.
Comment: in practice, DRIMUST uses Stirling's approximation to compute all binomial coefficients needed to assess HGTs. Stirling's inequality says that:
which is tight for large factorials.
Suffix trees
We used Ukkonen's algorithm for our implementation of generalized suffix trees (41). An example of such a tree is shown in Figure 2. For more details on suffix trees see (37).
Figure 1.

Scheme of DRIMUST for VGMs. First, a generalized suffix tree for  is constructed. Then, for every path
  at depth
  we build a generalized suffix tree
  for all strings of length
  rooted below P. Finally, paths Q at depth
  in
in  are traversed, and all motifs
  , where
  , are evaluated.
Figure 2.

A generalized suffix tree for S1 = CAGCA and S2 = GA. The characters $1 and $2 are used for marking S1 and S2 ends, respectively. The edges are labeled with substrings of S1 or S2, and the information at each leaf indicates both the index of the string that contains the suffix represented by the path from the root to that leaf, and the starting position of the suffix within the string.
Technical details of the biological data analysis
Human TP53 ChIP-chip analysis
We used the list of TP53 high-confidence binding sites reported by (9), containing 1546 loci in the human genome, each of length 10 bp. We extracted the sequences around these loci, taking 200 bp upstream and 200 bp downstream for each reported locus. These sequences were located at the top of a ranked list, with additional 1546 random sequences taken arbitrarily from the human genome and having the same lengths appended to the end of this list. We then searched motifs in the list.
In order to test the significance of all possible substrings derived from CWWG, we compared the enrichment of all motifs having the structure CW1W2-gap-CW1W2, such that W1 and W2 can be A or T and the gap can be any subset of {0,1, … ,10}.
To test which half site obeying the pattern RRRCWWGYYY was the most enriched, we calculated the enrichment of all solid motifs that are derived from this consensus, restricted to WW = AT.
Human estrogen receptor ChIP-chip analysis
We downloaded ESR1 target sequences reported by (44). Using ChIP-on-chip technique, the authors identified regions at least 600 bp in length that were enriched in ChIP samples compared with the controls, in MCF-7 cells. A total of 10 599 regions were predicted at the P-value cut-off of 10−3. These regions were ranked according to ESR1 binding P-values. We noticed that sequences at the top of the list were longer compared to sequences at the rest of the list. To get over this length bias, that may affect motif search, we randomly picked 600 bp from each sequence and only then conducted motif search.
To compute the differential expression for the genes in the subset of ESR1 predicted targets, we used the threshold number of mis-classifications (TNoM) score and P-value previously described (45).
Transcription factor binding sites analysis in S. cerevisiae
Data was taken from (46). We used the data set containing binding ratios of 203 putative transcription factors in rich media (YPD) conditions for our analysis. In each of the experiments, the genes were ranked according to the TF-binding ratio, and their promoter sequences were analyzed. We extracted the promoter sequences of S. cerevisiae genes by taking 500 bases upstream the TSS. For each transcription factor, we created a ranked list of targets, considering only genes that had binding ratio measurement for that TF, and then conducted motif search.
We compared our two best predictions for each TF with other reports (20,46). We considered motifs as ‘similar’ if the optimal number of matches between them was 80% of the length of the shorter motif. Otherwise, they were considered as ‘different’.
Heat-shock data analysis in S. cerevisiae
We analyzed gene expression data in S. cerevisiae responding to heat shock (47). Changes in transcript levels over eight time points (5, 10, 15, 20, 30, 40, 60 and 80 min) after heat shock were measured for almost every gene. We defined two disjoint subsets of time points, one contained the four early time points and the other contained the four late time points. We calculated the differential expression between these subsets for every gene, using the TNoM statistics (45) and then ranked the genes according to this measurement (in both directions). When genes had the same TNoM score, we internally ranked them according to the difference of their average expression values. For each ranking, we analyzed both promoter sequences and 3′UTR sequences. Promoter sequences were extracted by taking 500 bases upstream the TSS. The lengths of 3′UTRs were defined according to (48). Although the 3′UTR sequences are of variable lengths, there was no significant length bias in any of the rankings. We analyzed 3627 promoter sequences and 3177 3′UTR sequences.
PUF4-binding data was taken from (2), and enrichment of the 62 sequences containing the motif was calculated using the mHG statistics.
RNA-binding motif analysis
We analyzed the data set published by (2). This data set contains target information for five members of the Puf family of RNA binding proteins in S. cerevisiae. Using DNA microarrays the authors identified associated mRNAs. In five different experiments, one for each RBP, we ranked the 3′UTR sequences of S. cerevisiae genes according to the mean binding ratio and then conducted motif search. The lengths of 3′UTRs were defined according to (48). Each of the five lists contained ∼5000 sequences (minimum 4997 and maximum 5041). Although the 3′UTR sequences are of variable lengths, there was no significant length bias in any of the experiments.
We also analyzed targets of PUM1, a human member of the Pumilio family. The list of PUM1 targets in HeLa S3 cells was obtained from (3) and contained 1336 sequences. The data set includes gene information and numerical data related to the measured affinity of PUM1 and its potential targets (SAM score). We ranked the 3′UTR sequences according to this quantity. Here also there was not a length bias problem.
Protein-motif analysis
We downloaded human phosphorylation data from Phospho.ELM database (49). In three different experiments, one for each phosphorylation type (serine, threonine or tyrosine), each protein sequence was considered once. From each sequence, we picked a substring starting at 50 amino acids upstream the minimal site and extending to 50 amino acids downstream the maximal site. These substrings were located at the top of a ranked list, and we appended to them a set of random sequences taken arbitrarily from the human proteome and having the same lengths. We then conducted motif search. Although the amino acid sequences are of variable lengths, there was no significant length bias in any of the experiments. The serine phosphorylation list contained 7752 sequences in total and the tyrosine phosphorylation list contained 2320 sequences.
As random control, we generated a list of sequences containing the same amino acid content while preserving the RS di-residual density as in the original list. Given a sequence S in the original list, we first counted the number of RS pairs in S, denoted as q. We then randomly placed q RS pairs in the shuffled sequence and dispersed the rest of the amino acids in S randomly in the remaining positions. In the last step, we eliminated randomizations that placed ‘S’ after ‘R’ as they would have changed the RS density.
Motif refinement as PWM
Motifs produced as output by DRIMUST are exact words. As a refinement, we implemented a procedure that returns PWMs for the two halves of a given variable gap motif. This extension to DRIMUST takes four parameters as input:
The ranked list of sequences
A variable gap motif produced as output by DRIMUST
n*—the cut-off in the list at which the motif enrichment is maximized. This parameter is part of the DRIMUST output (together with the motif).
d—a Hamming distance threshold
The procedure returns a PWM for each half of the motif by considering all occurrences of variants of the motif in the top n* sequences in the list, when allowing up to d mismatches in total in the motif halves.
Implementation and availability
We provide an efficient implementation of the algorithms described above in Java. Our application takes as input ranked lists of sequences and returns significant variable gap motifs. It can be freely downloaded from http://bioinfo.cs.technion.ac.il/people/zohar/DRIMUST-code-VGM/ (suitable for all operating systems). The implementation of the procedure that returns PWMs given variable gap motif is also available for download from the above location.
RESULTS
We applied DRIMUST to analyze various data sets by searching for variable gap motifs composed of two half-sites of length 4, and separated by gaps that form any subset of the lengths {0, … ,10}. We describe our findings in this section. For each result, we report an mHG P-value as well as a Bonferroni corrected P-value, addressing the size of the motif search space.
Motif discovery in human TP53 ChIP-chip data
To test the effectiveness of our algorithm, we used it for the identification of TP53 (also known as p53) binding motif in humans by applying it to the Smeenk et al. (9) data set. Using a genome-wide ChIP-on-chip approach, the authors have identified 1546 high-confidence binding sites of TP53. We placed these target sequences at the top of a ranked list, with additional 1546 random sequences (taken arbitrarily from the human genome and having the same length) appended to the end of this list. The complete list served as input to DRIMUST. The most enriched motif found in the output contained the two identical half-sites CATG, separated by a gap of length 6 or 7 (i.e. CATG-N6,7-CATG; P-value ≤ 1.15 × 10−67; Corrected P-value ≤ 1.54 × 10−59). Furthermore, evaluation of the fixed gap motifs from the pattern CATG-Nl-CATG, where 0 ≤ l ≤ 10, showed that CATG-N6-CATG was the most enriched among them (P-value ≤ 2.33 × 10−64; Figure 3A).
Figure 3.

TP53 and ESR1 motif analysis. (A) Eleven motifs having the pattern CATG-Nl-CATG, where 0 ≤ l ≤ 10, were tested (dark bars) and compared to the motif CATG-N6,7-CATG (rightmost bar), for TP53-binding data. (B) Eleven motifs having the pattern GTCA-Nl-TGAC, where 0 ≤ l ≤ 10, were tested (dark bars) and compared to the motif GTCA-N3,6,9-TGAC (rightmost bar), for ESR1-binding data.
The above is consistent with the literature consensus motif which consists of two copies of the half-site RRRCWWGYYY separated by a spacer of 0–13 bp (50). A gap of length 0 is equivalent to the motif RRRCWWGYYYRRRCWWGYYY which is consistent with a spacer of 6 bp between the two half sites CWWG. Among all possible half-sites derived from CWWG, CATG was found to be the most statistically enriched in the data we analyzed (P-value ≤ 1.15 × 10−67, versus P-value of CAAG ≤ 2.45 × 10⁻¹⁴; P-value of CTTG ≤ 5.25 × 10⁻⁹; P-value of CTAG ≤ 4.74 × 10⁻⁴). This is consistent with the observation that high-affinity sites contain the CATG sequence at the centre of both half-sites (51,52). Additionally, we observed that the most enriched half site derived from RRRCWWGYYY was GGGCATGTCT (P-value ≤ 2.89 × 10⁻⁸).
Due to the dichotomic nature of the data, the algorithm actually cuts at a fixed place, and a hypergeometric (HG) test at position 1546 would have yielded highly similar results, as would be expected. It should be noted that the TP53 analysis took 3 min on a standard PC.
Motif discovery in human estrogen receptor 1 ChIP-chip data
We further applied our algorithm on ESR1 target sequences, using data collected by Carroll et al. (44). The authors mapped ESR1-binding sites on a genome-wide scale in breast cancer MCF-7 cells, using ChIP-on-chip technology. The list given as input to our method contained the entire data set of sequences (N = 10 599), and they were ranked according to ESR1 binding P-values as defined by (44). This mode of analysis, searching motifs in ranked lists, is the preferred mode for DRIMUST. The most enriched motif found in the output was GTCA-N3,6,9-TGAC; P-value ≤ 1.13 × 10⁻²⁰; Corrected P-value ≤ 1.52 × 10⁻¹²). This motif is consistent with the known ESR1-binding motif AGGTCA-N3-TGACCT (44), and with the observation that the protein binds as a symmetrical dimer to its palindromic-binding site (53). Our findings, however, expand the known fixed spacer length, suggesting a stronger variable gap motif. We then evaluated the fixed gap motifs GTCA-Nl-TGAC, where 0 ≤ l ≤ 10, and observed that the most enriched variant was indeed GTCA-N3-TGAC (P-value ≤ 1.12 × 10⁻¹⁸; Figure 3B). Moreover, other variants of the variable gap motif were similarly as strong, such as GTCA-N0,3,6,9-TGAC (P-value ≤ 1.56 × 10⁻²⁰), GTCA-N3,9-TGAC (P-value ≤ 4.40 × 10⁻²⁰), and GTCA-N0,3,9-TGAC (P-value ≤ 8.58 × 10⁻²⁰).
The mHG statistics used by our method provides additional information about protein targets. For each motif, it returns as output a cut-off in the list such that the motif is enriched in the subset of sequences located above the cut-off compared to the subset of sequences located below it. This number is denoted as n* and can be utilized to predict the targets of the tested protein, by selecting the motif-containing sequences ranked higher than n*. Applying this approach to ESR1 yields n* = 5083 (out of 10 599). Amongst the top 5083 sequences, we find 577 that contain the motif GTCA-N3,6,9-TGAC. As validation for this approach, we used publicly available gene expression data (54) containing mRNA expression profiles from 100 primary human breast tumors. We ranked the mRNAs according to their differential expression in samples with high-ESR1 mRNA levels versus samples where ESR1 mRNA levels were low. We found that the subset of ESR1 predicted targets (577 genes defined as above) was enriched among the set of genes whose expression is positively correlated with ESR1 expression (P-value ≤ 4.33 × 10⁻⁶).
Motif discovery in S. cerevisiae transcription factor binding sites
We next applied our method to the Harbison ChIP-chip data set (46), reporting measurements in 203 transcription factor binding experiments. In each of the ChIP-chip experiments, promoter sequences were ranked according to the transcription factor binding signal. Each transcription factor thus had its unique ranked list of genes, containing 6029 sequences on average. Every ranked list was used as input to our method, which searched for fixed structure motifs of lengths 6–10, and for variable gapped motifs. The motifs found for the Harbison data set are summarized in Supplementary Table S1. We compared our predictions with those reported in (46). The results of this comparison are summarized in Figure 4 and in Supplementary Table S2.
Figure 4.

Comparison between DRIMUST predictions and other predictions (46). Overall, our method identified significant motifs for all 203 unique transcription factors tested with P-value ≤ 10−5. Comparing them to the motifs reported in (46) revealed that out of 203 transcription factors, DRIMUST and the other applications found similar motifs for 22 TFs. There were 80 TFs for which DRIMUST predicted different motifs, and 101 for which DRIMUST identified a motif where the other applications did not. Examples for each case are indicated in the figure. We note that in the green set and the red set our predictions for 12/80 and 11/101 TFs are consistent with (20), respectively. Motifs of TFs marked with asterisk are also identified by (20).
Notably, the most significant variable gap motif was found for the protein ABF1. We found two equally strong motifs for ABF1: TCGT-N6-TGAT (P-value ≤ 3.53 × 10−63; Corrected P-value ≤ 4.74 × 10−55) and ATCA-N6-ACGA (P-value ≤ 7.23 × 10−63; Corrected P-value ≤ 10−54), both are fixed gap motifs. Aligning these motifs may yield the consensus motif ATCRTN5AYGAT, which was also enriched (P-value ≤ 1.53 × 10⁻¹⁶). The second motif (ATCA-N6-ACGA) is consistent with the literature motif RTCRYN5ACG (55). We further tested the enrichment of all eight variants derived from the latter consensus and found that the motif ATCACN5ACG was the most significant one (P-value ≤ 2.58 × 10−75; the results are summarized in Figure 5A). Apparently, adenosine is preferred over guanine at the first and the second positions of purines in the motif.
Figure 5.

ABF1, GAT3 and SWI6 motif analysis. (A) Variants of the ABF1 consensus sequence RTCRYN5ACG were evaluated and their significance P-values are indicated. (B) Eleven motifs having the pattern GCGG-Nl-ACGA, where 0 ≤ l ≤ 10, were tested (dark bars) and compared to the motif GCGG-N7,10-ACGA (rightmost bar), for GAT3-binding data. (C) Eleven motifs having the pattern CGCG-Nl-CGCG, where 0 ≤ l ≤ 10, were tested (dark bars) and compared to the motif CGCG-N1,3,5,8,9,10-CGCG (rightmost bar), for SWI6-binding data.
Interestingly, there are transcription factors for which very similar motifs were found by DRIMUST. One example is GAT3, YAP5 and MSN4 that share a variable gap motif, composed of the half sites GCGG and ACGA separated with a gap of length 7 or 10 nucleotides (GAT3: P-value ≤ 2.49 × 10⁻³⁴; YAP5: P-value ≤ 5.48 × 10⁻³⁴; MSN4: P-value ≤ 8.63 × 10⁻¹⁷). Comparing the variable gap in this motif to fixed gaps for GAT3 is depicted in Figure 5B, demonstrating a significant preference for the variable gap. Another example is RGM1, TOS8, CRZ1 and MAL13 for which the most enriched motif was CCTCGACTAA (RGM1: P-value ≤ 6.3 × 10⁻²⁸; TOS8: P-value ≤ 1.6 × 10⁻¹⁶; CRZ1: P-value ≤ 3.7 × 10⁻¹⁶; MAL13: P-value ≤ 2.1 × 10⁻¹⁴). In addition to the above, very similar motifs were also predicted for PDC2, HAL9 and TEC1—TGTTGGAATA for PDC1 and TEC1 (P-values ≤ 3.5 × 10−38 and 1.6 × 10⁻¹⁶, respectively), and TGTTNGAAT for HAL9 (P-value ≤ 4.92 × 10⁻²¹). It should be noted that the predictions in (46) are different or do not exist.
Furthermore, a variable gap motif was found to be strongly enriched among SWI6 targets. This motif comprised two copies of CGCG, separated by the spacer length subset {1, 3, 5, 8, 9, 10} (P-value ≤ 2.76 × 10⁻²⁵; Corrected P-value ≤ 3.7 × 10⁻¹⁷). This motif differs from the motifs CGCGAAA and CNCGAAA reported in (46). Moreover, testing the fixed gap motifs from the pattern CGCG-Nl-CGCG, where 0 ≤ l ≤ 10, for SWI6, yielded significantly weaker enrichments, supporting a preference for a variable gap motif, in this case (Figure 5C).
Note that running the complete analysis, as described above, on the Harbison et al. data set, took 30 h on a standard PC.
Motif discovery in S. cerevisiae heat-shock data—DNA and RNA motifs
We analyzed gene expression data in S. cerevisiae responding to heat shock (47). The data includes information about changes in transcript levels over eight time points after heat shock for almost every S. cerevisiae gene, measured using DNA microarrays. For each gene, we calculated the differential expression when comparing the four early time points with the four late time points, using the TNoM statistics (45). We then ranked the genes accordingly, in both directions. For each ranking, we analyzed both promoter sequences and 3′UTR sequences and used DRIMUST to search for variable gap motifs.
The motif AAAATTTT was found to be enriched among promoter sequences of genes increasing after heat shock (P-value ≤ 3.40 × 10⁻³¹; Corrected P-value ≤ 4.56 × 10⁻²³). This motif has been previously suggested to bring regulatory elements close together, and thus enhance the interactions of transcription factors that bind DNA (56). Another motif, GCGA-N0,4-TGAG was also significantly enriched (P-value ≤ 3.22 × 10⁻²⁵; Corrected P-value ≤ 4.32 × 10⁻¹⁷).
Additionally, a motif which is similar to PUF4 recognition site was found to be enriched among 3′UTR sequences of genes increasing after heat shock. The motif UGUA-N1,2,5,6-AUUA was the most significant motif in the output (P-value ≤ 9.93 × 10⁻¹⁰; Corrected P-value ≤ 0.08). When testing fixed gap motifs from the pattern UGUA-Nl-AUUA, where 0 ≤ l ≤ 10, the most significant enrichment was attained at l = 1, with P-value = 7.5 × 10⁻⁶. This is also consistent with the literature consensus of l = 1 for PUF4. Our variable gap motif found here is significantly more enriched. Moreover, mHG cuts the ranked list after 415 sequences, out of which 62 contain the motif. We next found that these 62 genes are enriched among PUF4 high-affinity targets (2) (P-value ≤ 1.71 × 10⁻¹³). Additionally, PUF4 itself increases after heat shock according to data. This may point at a positive regulation of these genes by PUF4 triggered by heat shock. We also found another VGM, the motif UUCU-N3,4,5,7,9,10-UUUA, to be enriched among genes decreasing after heat shock (P-value ≤ 2.35 × 10⁻⁹; Corrected P-value ≤ 0.19).
It should be noted that the analysis of the heat-shock data took 5 min (for both the 3′UTRs and the promoters) on a standard PC.
RNA binding motifs
We next applied DRIMUST on mRNA sequences targeted by RNA binding proteins of the Pumilio family in S. cerevisiae (2), in five different experiments. Input consisted of the list of S. cerevisiae 3′UTRs ranked according to PUF1, PUF2, PUF3, PUF4 and PUF5 binding affinity, respectively. The results are summarized in Figure 6A.
Figure 6.

Motifs found to be enriched among high-affinity targets of Puf proteins. (A) The motifs found for PUF1, PUF2, PUF3, PUF4 and PUF5, together with their statistical significance, are shown. (B) A Shannon logo for the first half of the variable gap motif found for PUF3. (C) A Shannon logo for the second half of PUF3 motif (the logos are drawn using WebLogo).
We note that PUF1 and PUF2 have similar motifs, comprising the dual UAAU sequence, as has been previously shown (5). The half sites are separated with a variable gap spacer, including a gap of length 3. Though the most significant gap is not 3, the motif UAAU-N3-UAAU is almost as enriched as the motifs shown in Figure 6A (PUF1: P-value ≤ 3 × 10⁻¹⁴; PUF2: P-value ≤ 10−48), and therefore this may not be an instance of significant variable gap motif.
The motifs found for PUF3 and PUF4 are fixed gap (UGUAAAUA and UGUANAUUA, respectively), and they are consistent with the motifs found by Gerber et al. (2). As for PUF5, our results are less consistent with the literature and suggest UGUANUAUA as a potential-binding site for this RNA-binding protein.
An extension to DRIMUST, also available for download, enables refinement of the exact motif output obtained from DRIMUST. It takes as input an exact-word variable gap motif that was produced as output by DRIMUST, and returns two PWMs—one for the first half of the motif and one for its second half (see ‘Materials and Methods’ section). For example, applying this extension to the motif UGUAAAUA (which is equivalent to UGUA-N0-AAUA) found for PUF3 yields PWMs that correspond to the Shannon logos presented in Figure 6B and C.
To further demonstrate the power of the mHG statistics, we shuffled the ranking of PUF3 target sequences and then conducted motif search. In other words, as control, the target sequences were sorted randomly, with no association to PUF3 binding. We repeated this control for 100 times, and out of these 100 control experiments the most significant result was not better than 5.06 × 10⁻¹¹ (as opposed to 4.18 × 10−110 found for the original ranking).
Additionally, we applied DRIMUST to targets of PUM1, a human member of the Pumilio family [data was taken from (3)]. The targets were ranked according to PUM1-binding affinity and used as input to DRIMUST. We found that the motif UGUA-N0,3-AAUA was the most significant (P-value ≤ 5.14 × 10⁻¹⁰; Corrected P-value ≤ 0.07). It resembles the motif UGUAAAUA which was found for PUF3 targets, and as a matter of fact the latter string is highly enriched among PUM1 targets as well (P-value ≤ 3.5 × 10⁻⁹), consistent with the validated binding site for PUM1 (3,4).
The analysis of all Puf proteins took 15 min on a standard PC.
Protein motifs
We finally applied DRIMUST to protein sequences, studying amino acid motifs enriched among human kinase substrates. Phosphorylation sites were taken from Phospho.ELM database (49), which stores serine, threonine and tyrosine phosphorylation data in a large set of species. We placed sequences containing phosphorylation sites of a specific type (serine, threonine or tyrosine) at the top of a ranked list, and appended to them a set of random sequences taken at random from the human proteome and having the same lengths. The complete list was used as DRIMUST input, seeking variable gapped motifs.
The most enriched motif found among serine kinase substrates was RSRS-N0,2,3,6,8,9-RSRS (P-value ≤ 6.24 × 10⁻⁹; Corrected P-value ≤ 0.25). To eliminate artifacts that may lead to the enrichment of this motif, we further tested whether there was RS di-residual density bias in the data set. We found that phosphorylated sequences tend to have greater RS di-residual density than non-phosphorylated sequences. Specifically, we sorted the sequences according to RS di-residual densities in descending order (greater RS density values are at the top and lower values are further down). We then observed that among the higher 5000 values (out of 7752), 3195 were serine phosphorylated sequences and only 1805 were non-phosphorylated sequences (mHG P-value ≤ 6.2 × 10−244 and Supplementary Figure S2). To test whether the motif is a result of this bias, we generated sequences containing the same amino acid content while preserving the same RS di-residual density (for details, see ‘Materials and Methods’ section), and then conducted motif search. We did not observe any motif at P-value ≤ 10−5, and specifically did not find the above motif. Therefore, the motif composed of the dual sequence RSRS is not likely to result solely from the RS di-residual density bias. Furthermore, we also analyzed serine kinase substrates in Mus musculus, and did not find any motif at P-value ≤ 10−5. In mouse, we also found a significant RS di-residual density bias (mHG P-value ≤ 10−244), supporting that RS di-residual density bias itself cannot explain the enrichment of the motif RSRS-gap-RSRS among serine phosphorylated sequences in humans. Moreover, searching variable gapped motifs comprising half-sites of lengths 6 and 4 (and vice versa) in humans, where we found the above motif, did not yield any result at P-value ≤ 10−5. This means that the gap is not predominantly RS. We conclude that this motif is directly related to serine phosphorylation and not to RS di-residual density bias.
The motif is probably related to RS domains, which are rich in arginine-serine repeats and are known to be subjected to serine phosphorylation (57,58). For example, human SR proteins are known to contain RS domain at their carboxyl terminus that is involved in protein–protein interaction, and at least one amino-terminal RNA-binding domain that provides RNA-binding specificity (59). Since there are about nine known SR proteins in humans (59) and the motif above was found among 43 serine-phosphorylated proteins (out of 48 occurrences in the complete list), it is likely that not all of them are SR proteins. Therefore, we propose that the enrichment of the motif above points at a general mechanism rather than enrichment resulting from SR proteins influence on the analysis.
It is interesting to note that all motifs having the structure RSRS-Nl-RSRS, where 0 ≤ l ≤ 10, were not enriched at a threshold of 10−4 (the default in our software), and therefore taking a greedy approach that filters half-sites by testing only fixed gap motifs would have missed this variable gap motif (Figure 7A).
Figure 7.

Phosphorylation motif analysis. (A) Eleven motifs having the pattern RSRS-Nl-RSRS, where 0 ≤ l ≤ 10, were tested (blue bars) and compared to the motif RSRS-N0,2,3,6,8,9-RSRS (red bar), for serine phosphorylation data. (B) There are 32 sequences containing the motif HRDLAARN-X12-DFGL-X33-39-SDVW within tyrosine phosphorylated sequences in humans. The occurrences of HRDLAARN are marked in red, those of DFGL are marked in blue, and of SDVW in green.
As for threonine phosphorylated sequences, we did not observe any motif at P-value ≤ 10−5. On the other hand, we found several interesting motifs around tyrosine phosphorylation sites. A non-gapped motif, HRDLAARN, was significantly enriched in humans (P-value ≤ 3.17 × 10⁻¹³; Corrected P-value ≤ 2.55 × 10⁻⁶) and in M. musculus (P-value ≤ 1.5 × 10⁻⁶). Further search for 4-mers enriched around tyrosine phosphorylation sites yielded three highly significant motifs: DFGL (P-value ≤ 5.1 × 10⁻¹⁷), HRDL (P-value ≤ 7.7 × 10⁻¹⁷) and SDVW (P-value ≤ 2.5 × 10⁻¹⁶). Some of these motifs are known to be related to tyrosine kinase susceptibility. For example, the catalytic domains of protein-tyrosine kinases, such as EGFR, FGFR3, CSK, MATK (also known as CHK) and others contain the consensus sequence HRDLAARN. Interestingly, this sequence is also followed by the conserved sequence DFG (34–36) which is important for ATP coordination (35).
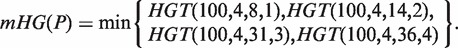
We tested the combination of the three motifs HRDLAARN, DFGL and SDVW that we found, and identified a strikingly evident pattern. Out of 41 phosphorylated sequences that contained HRDLAARN, 32 contained both DFGL and SDVW. Moreover, in all these 32 cases, DFGL appeared exactly 12 amino acids after HRDLAARN, and SDVW appeared between 33–39 amino acids after DFGL (Figure 7B). This motif was significantly enriched in humans (P-value ≤ 1.9 × 10⁻¹⁰) and also in M. musculus (P-value ≤ 1.1 × 10⁻⁴). This, to the best of our knowledge, is a novel discovery.
The above analysis took 4 min on a standard PC.
DISCUSSION
In this article, we describe an efficient statistical and algorithmic approach to searching motifs in ranked list of sequences. Our method, implemented in DRIMUST, has several advantages over existing methods. First, many other approaches exhaustively search over motif spaces and therefore, cannot handle gapped motifs and motifs over large alphabets. Furthermore, we search motifs in ranked lists and not in fixed sets of sequences as is the case for many other methods. To the best of our knowledge, DRIMUST is unique in combining an efficient search with a ranked list approach and rigorous P-value estimation. It is also unique in efficiently addressing variable gap motifs under a definition that allows full flexibility of the gap.
Our approach to overcoming the computational challenges associated with large motif search spaces is based on using suffix trees, to restrict our attention to motifs that actually occur in the input list of sequences. An alternative approach could be based on the use of a hash table. Taking this approach, however, will entail running the search for a fixed motif length k. To span a range of lengths k1 ≤ k ≤ k2, as is done by DRIMUST, one would need to generate a separate hash table for each k. Therefore, a suffix tree approach is far more efficient in this case. In addition, the hash table approach falls short of solving the variable gap motif problem which is enabled through the use of suffix trees in DRIMUST.
One of the standard motif search tools used by the community is MEME (15). As opposed to DRIMUST focus on discovering motifs in ranked lists, MEME uses a fixed set approach. Moreover, it limits the input to only 60 000 characters. When we ran the phosphorylation motif search analysis described in the ‘Results’ section on MEME's service (60), as the full input would have been too large (the tyrosine data set is 200 000 characters), we used 300 sequences as input. MEME took more than an hour to run the analysis. The results are depicted in Supplementary Figure S3 and are consistent with DRIMUST predictions, however, we note that the variable gap nature of the motifs we found to be associated with HRDLAARN is not discovered by MEME. Additionally, we ran MEME on ∼200 sequences of the serine data set, yielding no significant findings. Another advantage of DRIMUST over MEME is that it provides a tight upper bound on the P-value, based on the mHG model, while MEME's output includes an e-value which is not as rigorously associated with a statistical model.
In 2007, our group developed the first mHG approach to motifs in ranked lists. This was implemented as the DRIM algorithm (20). Building on the DRIM statistical approach, the current work represents significant progress over DRIM:
Improved computational efficiency enabled by using suffix trees
Thanks to this improvement, we can address large alphabets, long motifs and, most notably, a new class of variable gap motifs (VGMs)
One apparent limitation of the current implementation of DRIMUST is that the output half-sites are exact motifs. That is, they are words over the alphabet of the input sequences, allowing no flexibility or weighting. Our output can be viewed as the starting point for extending the motifs using more flexible motif representation approaches for selected top results. In practice, for this extension step, we currently employ ad hoc and manual analysis. In this article, we used a simple extension mechanism of a motif in the DRIMUST output by considering its variants that occur at the top of the ranked list for creating a PWM for the motif. The implementation of this extension is also available for download. In the future, we intend to further develop algorithmic approaches to this phase. For example, extend motifs using IUPAC or PWMs. The IUPAC extension task is amenable to modifications of the suffix tree approach.
We note that all P-values reported by DRIMUST are not corrected for the size of the motif search space, which should be handled by the user. Findings presented in this article remain significant after correction.
In addition to the computational contribution of this article, we present analysis results of biological importance:
We identify CATG as the strongest TP53 half-site. While the pair AT was shown to be the best instance of WW in the known consensus CWWG, this was done in controlled synthetic experiments. Our results which validate this recently established preference were obtained using high-throughput measurement data. Consistent with literature, we found a spacer of 6 bp to yield significant results.
We observe GTCA-N3,6,9-TGAC as the strongest binding site for ESR1. The existing literature consensus, to the best of our knowledge, is GTCA-N3-TGAC. This newly hypothesized refinement of the ESR1 binding site, inferred from high-throughput measurement data, demonstrates the utility of variable gap motif search. The data analyzed to yield this finding consisted over 10 000 human DNA sequences, each of length 600 bp—a size which is difficult to handle by most state of the art tools.
In analyzing Harbison et al. data, we validate some existing findings and also suggest some novel motifs. Specifically, we find CGCG-N1,3,5,8,9,10-CGCG to be the most significant variable gap motif for SWI6. Indeed, this motif is much stronger than all the underlying fixed gap motifs (Figure 5C).
We suggest PUF4 involvement in S. cerevisiae heat-shock response through motif search analysis in 3′UTRs.
We suggest HRDLAARN-X12-DFGL-X33-39-SDVW as a significant motif related to potential tyrosine phosphorylation in humans (and in mice). HRDLAARN, the first part of this motif, is known to be related to tyrosine phosphorylation. Our analysis gives rise to a significant refinement.
This work is the first to perform a systematic analysis of variable gapped motifs in biological data sets. We have found variable gapped motifs to be more significant in a handful of cases and therefore reach the preliminary conclusion, consistent with Reid et al. (33), that they are important but not extremely widespread.
In summary, we present efficient and effective algorithmics for motif search and demonstrate its utility in biological data sets. In the future, we hope to further expand findings driven by this approach, through usage by us as well as by others in the community.
SUPPLEMENTARY DATA
Supplementary Data are available at NAR Online: Supplementary Tables 1–2 and Supplementary Figures 1–3.
FUNDING
Jacobs Fellowship and by ISEF Fellowship (L.L., in part). Funding for open access charge: Laboratory of Computational Biology, Department of Computer Science, Technion—Israel Institute of Technology.
Conflict of interest statement. None declared.
Supplementary Material
ACKNOWLEDGEMENTS
We thank Israel Steinfeld for useful discussions and for support in implementing mHG calculations and other code. We also thank Yael Mandel-Gutfreund, Shlomo Moran, Tali Haran and Eran Eden for useful discussions. Finally, we thank Roy Navon for technical help with the software download service.
REFERENCES
- 1.Wickens M, Bernstein DS, Kimble J, Parker R. A PUF family portrait: 3′UTR regulation as a way of life. Trends Genet. 2002;18:150–157. doi: 10.1016/s0168-9525(01)02616-6. [DOI] [PubMed] [Google Scholar]
- 2.Gerber AP, Herschlag D, Brown PO. Extensive association of functionally and cytotopically related mRNAs with Puf family RNA-binding proteins in yeast. PLoS Biol. 2004;2:E79. doi: 10.1371/journal.pbio.0020079. [DOI] [PMC free article] [PubMed] [Google Scholar]
- 3.Galgano A, Forrer M, Jaskiewicz L, Kanitz A, Zavolan M, Gerber AP. Comparative analysis of mRNA targets for human PUF-family proteins suggests extensive interaction with the miRNA regulatory system. PLoS One. 2008;3:e3164. doi: 10.1371/journal.pone.0003164. [DOI] [PMC free article] [PubMed] [Google Scholar]
- 4.Morris AR, Mukherjee N, Keene JD. Ribonomic analysis of human Pum1 reveals cis-trans conservation across species despite evolution of diverse mRNA target sets. Mol. Cell Biol. 2008;28:4093–4103. doi: 10.1128/MCB.00155-08. [DOI] [PMC free article] [PubMed] [Google Scholar]
- 5.Yosefzon Y, Koh YY, Chritton JJ, Lande A, Leibovich L, Barziv L, Petzold C, Yakhini Z, Mandel-Gutfreund Y, Wickens M, et al. Divergent RNA binding specificity of yeast Puf2p. RNA. 2011;17:1479–1488. doi: 10.1261/rna.2700311. [DOI] [PMC free article] [PubMed] [Google Scholar]
- 6.Du T, Zamore PD. MicroPrimer: the biogenesis and function of microRNA. Development. 2005;132:4645–4652. doi: 10.1242/dev.02070. [DOI] [PubMed] [Google Scholar]
- 7.Saraste M, Sibbald PR, Wittinghofer A. The P-loop: a common motif in ATP- and GTP-binding proteins. Trends Biochem. Sci. 1990;15:430–434. doi: 10.1016/0968-0004(90)90281-f. [DOI] [PubMed] [Google Scholar]
- 8.Bork P, Koonin EV. Protein sequence motifs. Curr. Opin. Struct. Biol. 1996;6:366–376. doi: 10.1016/s0959-440x(96)80057-1. [DOI] [PubMed] [Google Scholar]
- 9.Smeenk L, van Heeringen SJ, Koeppel M, van Driel MA, Bartels SJ, Akkers RC, Denissov S, Stunnenberg HG, Lohrum M. Characterization of genome-wide p53-binding sites upon stress response. Nucleic Acids Res. 2008;36:3639–3654. doi: 10.1093/nar/gkn232. [DOI] [PMC free article] [PubMed] [Google Scholar]
- 10.Wei CL, Wu Q, Vega VB, Chiu KP, Ng P, Zhang T, Shahab A, Yong HC, Fu Y, Weng Z, et al. A global map of p53 transcription-factor binding sites in the human genome. Cell. 2006;124:207–219. doi: 10.1016/j.cell.2005.10.043. [DOI] [PubMed] [Google Scholar]
- 11.Lee BK, Bhinge AA, Iyer VR. Wide-ranging functions of E2F4 in transcriptional activation and repression revealed by genome-wide analysis. Nucleic Acids Res. 2011;39:3558–3573. doi: 10.1093/nar/gkq1313. [DOI] [PMC free article] [PubMed] [Google Scholar]
- 12.Lebedeva S, Jens M, Theil K, Schwanhäusser B, Selbach M, Landthaler M, Rajewsky N. Transcriptome-wide analysis of regulatory interactions of the RNA-binding protein HuR. Mol. Cell. 2011;43:340–352. doi: 10.1016/j.molcel.2011.06.008. [DOI] [PubMed] [Google Scholar]
- 13.Schwanhäusser B, Busse D, Li N, Dittmar G, Schuchhardt J, Wolf J, Chen W, Selbach M. Global quantification of mammalian gene expression control. Nature. 2011;473:337–342. doi: 10.1038/nature10098. [DOI] [PubMed] [Google Scholar]
- 14.Sandve GK, Drabløs F. A survey of motif discovery methods in an integrated framework. Biol. Direct. 2006;1:11. doi: 10.1186/1745-6150-1-11. [DOI] [PMC free article] [PubMed] [Google Scholar]
- 15.Bailey TL, Elkan C. Unsupervised learning of multiple motifs in biopolymers using expectation maximization. Mach. Learn. 1995;21:51–80. [Google Scholar]
- 16.Bailey TA, Hubbard TJP. NestedMICA: sensitive inference of over-represented motifs in nucleic acid sequence. Nucleic Acids Res. 2005;33:1445–1453. doi: 10.1093/nar/gki282. [DOI] [PMC free article] [PubMed] [Google Scholar]
- 17.Roth FP, Hughes JD, Estep PW, Church GM. Finding DNA regulatory motifs within unaligned noncoding sequences clustered by whole-genome mRNA quantitation. Nat. Biotechnol. 1998;16:939–945. doi: 10.1038/nbt1098-939. [DOI] [PubMed] [Google Scholar]
- 18.Liu XS, Brutlag DL, Liu JS. An algorithm for finding protein-DNA binding sites with applications to chromatin-immunoprecipitation microarray experiments. Nat. Biotechnol. 2002;20:835–839. doi: 10.1038/nbt717. [DOI] [PubMed] [Google Scholar]
- 19.Subramanian A, Tamayo P, Mootha VK, Mukherjee S, Ebert BL, Gillette MA, Paulovich A, Pomeroy SL, Golub TR, Lander ES, et al. Gene set enrichment analysis: a knowledge-based approach for interpreting genome-wide expression profiles. Proc. Natl Acad. Sci. USA. 2005;102:15545–15550. doi: 10.1073/pnas.0506580102. [DOI] [PMC free article] [PubMed] [Google Scholar]
- 20.Eden E, Lipson D, Yogev S, Yakhini Z. Discovering motifs in ranked lists of DNA sequences. PLoS Comput. Biol. 2007;3:e39. doi: 10.1371/journal.pcbi.0030039. [DOI] [PMC free article] [PubMed] [Google Scholar]
- 21.Eden E, Navon R, Steinfeld I, Lipson D, Yakhini Z. GOrilla: a tool for discovery and visualization of enriched GO terms in ranked gene lists. BMC Bioinformatics. 2009;10:48. doi: 10.1186/1471-2105-10-48. [DOI] [PMC free article] [PubMed] [Google Scholar]
- 22.Straussman R, Nejman D, Roberts D, Steinfeld I, Blum B, Benvenisty N, Simon I, Yakhini Z, Cedar H. Developmental programming of CpG island methylation profiles in the human genome. Nat. Struct. Mol. Biol. 2009;16:564–571. doi: 10.1038/nsmb.1594. [DOI] [PubMed] [Google Scholar]
- 23.Liang SD, Marmorstein R, Harrison SC, Ptashne M. DNA sequence preferences of GAL4 and PPR1: how a subset of Zn2 Cys6 binuclear cluster proteins recognizes DNA. Mol. Cell Biol. 1996;16:3773–3780. doi: 10.1128/mcb.16.7.3773. [DOI] [PMC free article] [PubMed] [Google Scholar]
- 24.Riley T, Sontag E, Chen P, Levine A. Transcriptional control of human p53-regulated genes. Nat. Rev. Mol. Cell Biol. 2008;9:402–412. doi: 10.1038/nrm2395. [DOI] [PubMed] [Google Scholar]
- 25.Liu X, Brutlag DL, Liu JS. BioProspector: discovering conserved DNA motifs in upstream regulatory regions of co-expressed genes. Pac. Symp. Biocomput. 2001:127–138. [PubMed] [Google Scholar]
- 26.Jensen KL, Styczynski MP, Rigoutsos I, Stephanopoulos GN. A generic motif discovery algorithm for sequential data. Bioinformatics. 2006;22:21–28. doi: 10.1093/bioinformatics/bti745. [DOI] [PubMed] [Google Scholar]
- 27.Chakravarty A, Carlson JM, Khetani RS, DeZiel CE, Gross RH. SPACER: identification of cis-regulatory elements with non-contiguous critical residues. Bioinformatics. 2007;23:1029–1031. doi: 10.1093/bioinformatics/btm041. [DOI] [PubMed] [Google Scholar]
- 28.Wijaya E, Rajaraman K, Yiu SM, Sung WK. Detection of generic spaced motifs using submotif pattern mining. Bioinformatics. 2007;23:1476–1485. doi: 10.1093/bioinformatics/btm118. [DOI] [PubMed] [Google Scholar]
- 29.Frith MC, Saunders NF, Kobe B, Bailey TL. Discovering sequence motifs with arbitrary insertions and deletions. PLoS Comput. Biol. 2008;4:e1000071. doi: 10.1371/journal.pcbi.1000071. [DOI] [PMC free article] [PubMed] [Google Scholar]
- 30.van Helden J, Rios AF, Collado-Vides J. Discovering regulatory elements in non-coding sequences by analysis of spaced dyads. Nucleic Acids Res. 2000;28:1808–1818. doi: 10.1093/nar/28.8.1808. [DOI] [PMC free article] [PubMed] [Google Scholar]
- 31.Carvalho AM, Freitas AT, Oliveira AL, Sagot MF. An efficient algorithm for the identification of structured motifs in DNA promoter sequences. IEEE/ACM Trans. Comput. Biol. Bioinform. 2006;3:126–140. doi: 10.1109/TCBB.2006.16. [DOI] [PubMed] [Google Scholar]
- 32.Chen CY, Tsai HK, Hsu CM, May Chen MJ, Hung HG, Huang GT, Li WH. Discovering gapped binding sites of yeast transcription factors. Proc. Natl Acad. Sci. USA. 2008;105:2527–2532. doi: 10.1073/pnas.0712188105. [DOI] [PMC free article] [PubMed] [Google Scholar]
- 33.Reid JE, Evans KJ, Dyer N, Wernisch L, Ott S. Variable structure motifs for transcription factor binding sites. BMC Genom. 2010;11:30. doi: 10.1186/1471-2164-11-30. [DOI] [PMC free article] [PubMed] [Google Scholar]
- 34.Moran MF, Koch CA, Sadowski I, Pawson T. Mutational analysis of a phosphotransfer motif essential for v-fps tyrosine kinase activity. Oncogene. 1988;3:665–672. [PubMed] [Google Scholar]
- 35.Stamos J, Sliwkowski MX, Eigenbrot C. Structure of the epidermal growth factor receptor kinase domain alone and in complex with a 4-anilinoquinazoline inhibitor. J. Biol. Chem. 2002;277:46265–46272. doi: 10.1074/jbc.M207135200. [DOI] [PubMed] [Google Scholar]
- 36.Lin X, Lee S, Sun G. Functions of the activation loop in Csk protein-tyrosine kinase. J. Biol. Chem. 2003;278:24072–24077. doi: 10.1074/jbc.M210596200. [DOI] [PubMed] [Google Scholar]
- 37.Gusfield D. Algorithms on Strings, Trees and Sequences: Computer Science and Computational Biology. New York, NY, USA: Cambridge University Press; 1997. pp. 89–129. [Google Scholar]
- 38.Martinez HM. An efficient method for finding repeats in molecular sequences. Nucleic Acids Res. 1983;13:4629–4634. doi: 10.1093/nar/11.13.4629. [DOI] [PMC free article] [PubMed] [Google Scholar]
- 39.Weiner P. Proceedings of the 14th IEEE Symposium on Switching and Automata Theory. IEEE Computer Society, Washington, DC, USA: 1973. Linear pattern matching algorithms; pp. 1–11. [Google Scholar]
- 40.McCreight EM. A space-economical suffix tree construction algorithm. J. ACM. 1976;23:262–272. [Google Scholar]
- 41.Ukkonen E. On-line construction of suffix trees. Algorithmica. 1995;14:249–260. [Google Scholar]
- 42.Hiu L. Color set size problem with applications to string matching. Proceedings of the 3rd Symposium on Combinatorial Pattern Matching. Springer LNCS. 1992;Vol. 644:227–240. [Google Scholar]
- 43.Zilberstein CB, Ziv-Ukelson M, Pinter RY, Yakhini Z. A high-throughput approach for associating MicroRNAs with their activity conditions. J. Comput. Biol. 2006;13:245–266. doi: 10.1089/cmb.2006.13.245. [DOI] [PubMed] [Google Scholar]
- 44.Carroll JS, Meyer CA, Song J, Li W, Geistlinger TR, Eeckhoute J, Brodsky AS, Keeton EK, Fertuck KC, Hall GF, et al. Genome-wide analysis of estrogen receptor binding sites. Nat. Genet. 2006;38:1289–1297. doi: 10.1038/ng1901. [DOI] [PubMed] [Google Scholar]
- 45.Ben-Dor A, Bruhn L, Friedman N, Nachman I, Schummer M, Yakhini Z. Tissue classification with gene expression profiles. J. Comput. Biol. 2000;7:559–583. doi: 10.1089/106652700750050943. [DOI] [PubMed] [Google Scholar]
- 46.Harbison CT, Gordon DB, Lee TI, Rinaldi NJ, Macisaac KD, Danford TW, Hannett NM, Tagne JB, Reynolds DB, Yoo J, et al. Transcriptional regulatory code of a eukaryotic genome. Nature. 2004;431:99–104. doi: 10.1038/nature02800. [DOI] [PMC free article] [PubMed] [Google Scholar]
- 47.Gasch AP, Spellman PT, Kao CM, Carmel-Harel O, Eisen MB, Storz G, Botstein D, Brown PO. Genomic expression programs in the response of yeast cells to environmental changes. Mol. Biol. Cell. 2000;11:4241–4257. doi: 10.1091/mbc.11.12.4241. [DOI] [PMC free article] [PubMed] [Google Scholar]
- 48.Nagalakshmi U, Wang Z, Waern K, Shou C, Raha D, Gerstein M, Snyder M. The transcriptional landscape of the yeast genome defined by RNA sequencing. Science. 2008;320:1344–1349. doi: 10.1126/science.1158441. [DOI] [PMC free article] [PubMed] [Google Scholar]
- 49.Dinkel H, Chica C, Via A, Gould CM, Jensen LJ, Gibson TJ, Diella F. Phospho.ELM: a database of phosphorylation sites–update 2011. Nucleic Acids Res. 2011;39:D261–D267. doi: 10.1093/nar/gkq1104. [DOI] [PMC free article] [PubMed] [Google Scholar]
- 50.El-Deiry WS, Kern SE, Pietenpol JA, Kinzler KW, Vogelstein B. Definition of a consensus binding site for p53. Nat. Genet. 1992;1:45–49. doi: 10.1038/ng0492-45. [DOI] [PubMed] [Google Scholar]
- 51.Inga A, Storici F, Darden TA, Resnick MA. Differential transactivation by the p53 transcription factor is highly dependent on p53 level and promoter target sequence. Mol. Cell. Biol. 2002;22:8612–8625. doi: 10.1128/MCB.22.24.8612-8625.2002. [DOI] [PMC free article] [PubMed] [Google Scholar]
- 52.Weinberg RL, Veprintsev DB, Bycroft M, Fersht AR. Comparative binding of p53 to its promoter and DNA recognition elements. J. Mol. Biol. 2005;348:589–596. doi: 10.1016/j.jmb.2005.03.014. [DOI] [PubMed] [Google Scholar]
- 53.Schwabe JW, Chapman L, Finch JT, Rhodes D. The crystal structure of the estrogen receptor DNA-binding domain bound to DNA: how receptors discriminate between their response elements. Cell. 1993;75:567–578. doi: 10.1016/0092-8674(93)90390-c. [DOI] [PubMed] [Google Scholar]
- 54.Enerly E, Steinfeld I, Kleivi K, Leivonen SK, Aure MR, Russnes HG, Rønneberg JA, Johnsen H, Navon R, Rødland E, et al. miRNA-mRNA integrated analysis reveals roles for miRNAs in primary breast tumors. PLoS One. 2011;6:e16915. doi: 10.1371/journal.pone.0016915. [DOI] [PMC free article] [PubMed] [Google Scholar]
- 55.Rhode PR, Elsasser S, Campbell JL. Role of multifunctional autonomously replicating sequence binding factor 1 in the initiation of DNA replication and transcriptional control in Saccharomyces cerevisiae. Mol. Cell Biol. 1992;12:1064–1077. doi: 10.1128/mcb.12.3.1064. [DOI] [PMC free article] [PubMed] [Google Scholar]
- 56.Vilo J, Kivinen K. Regulatory sequence analysis: application to the interpretation of gene expression. Eur. Neuropsychopharmacol. 2001;11:399–411. doi: 10.1016/s0924-977x(01)00117-1. [DOI] [PubMed] [Google Scholar]
- 57.Tacke R, Chen Y, Manley JL. Sequence-specific RNA binding by an SR protein requires RS domain phosphorylation: creation of an SRp40-specific splicing enhancer. Proc. Natl Acad. Sci. USA. 1997;94:1148–1153. doi: 10.1073/pnas.94.4.1148. [DOI] [PMC free article] [PubMed] [Google Scholar]
- 58.Xiao SH, Manley JL. Phosphorylation of the ASF/SF2 RS domain affects both protein-protein and protein-RNA interactions and is necessary for splicing. Genes Dev. 1997;11:334–344. doi: 10.1101/gad.11.3.334. [DOI] [PubMed] [Google Scholar]
- 59.Shepard PJ, Hertel KJ. The SR protein family. Genome Biol. 2009;10:242. doi: 10.1186/gb-2009-10-10-242. [DOI] [PMC free article] [PubMed] [Google Scholar]
- 60.Bailey TL, Williams N, Misleh C, Li WW. MEME: discovering and analyzing DNA and protein sequence motifs. Nucleic Acids Res. 2006;34:W369–W373. doi: 10.1093/nar/gkl198. [DOI] [PMC free article] [PubMed] [Google Scholar]
Associated Data
This section collects any data citations, data availability statements, or supplementary materials included in this article.