


Abstract
MicroRNAs (miRNAs) constitute an important class of gene regulators. While models have been proposed to explain their appearance and expansion, the validation of these models has been difficult due to the lack of comparative studies. Here, we analyze miRNA evolutionary patterns in two mammals, human and mouse, in relation to the age of miRNA families. In this comparative framework, we confirm some predictions of previously advanced models of miRNA evolution, e.g. that miRNAs arise more frequently de novo than by duplication, or that the number of protein-coding gene targeted by miRNAs decreases with evolutionary time. We also corroborate that miRNAs display an increase in expression level with evolutionary time, however we show that this relation is largely tissue-dependent, and especially low in embryonic or nervous tissues. We identify a bias of tag-sequencing techniques regarding the assessment of breadth of expression, leading us, contrary to predictions, to find more tissue-specific expression of older miRNAs. Together, our results refine the models used so far to depict the evolution of miRNA genes. They underline the role of tissue-specific selective forces on the evolution of miRNAs, as well as the potential co-evolution patterns between miRNAs and the protein-coding genes they target.
INTRODUCTION
MicroRNAs (miRNAs) constitute one of the largest classes of gene regulators in animal genomes. They are associated with the control of a broad range of biological processes, including development, differentiation, metabolism, cell cycle and aging (1–4). From an evolutionary point of view, changes in miRNA regulation underlie several species-specific adaptations (5–7). The evolutionary success of miRNAs might also result from the benefits of a supplementary layer of regulation on gene networks, leading to an increased combinatorial control power, more flexibility, robustness or buffering (8–12). It is thought that these properties could have been targeted by natural selection during evolution, making miRNAs good candidates to explain major evolutionary transitions (7,13,14). Consistent with this scenario, an increase in morphological complexity was shown to correlate with dramatic expansions of the miRNA repertoire in bilaterians (15,16) and in vertebrates (17–20).
Yet the appearance and expansion of miRNAs in animal genomes is not well understood. Because of their short sequence, it is likely that a substantial number of miRNAs regularly appear in the genome by chance—e.g. from intergenic or intronic sequences (20–22) or from Transposable Elements and repeats (23). Like other types of genes, miRNAs can also expand by gene duplication, increasing the size of miRNA gene families. It is unclear whether duplication or de novo generation is the main mechanism of miRNA expansion (14,20,21,23–25).
Regarding their long-term fate, the ‘transcriptional control model’ (21,23) proposes that miRNAs which are first expressed at low levels, and in a tissue or stage-specific manner, have mild phenotypic consequences, and can be retained in evolution. Selection could then drive higher and broader expression of the miRNAs that assume a functional role. This model is consistent with several lines of evidence, such as the observation that in human, miRNAs with no detectable expression—accounting for ∼30% of the total miRNA pool—appear to be recent and under relaxed selective pressure (26,27). In flies too, novel miRNA genes are under weaker purifying selection (28), and harbor few conserved targets and low expression (8). As for conserved miRNAs, they are typically more broadly and robustly expressed than non-conserved ones (29,30). However, tests of this model have been limited by the paucity of comparative studies performed.
In this paper, we tested the ‘transcriptional control model’ of miRNA emergence in a comparative framework. In light of the date of emergence of miRNA families, we analyzed in two mammalian species, human and mouse, the size of miRNA families, their expression in different anatomical structures, and the predicted protein-coding genes they target.
MATERIALS AND METHODS
Family size
The clustering of miRNA genes in families was retrieved from miRBase (ftp://mirbase.org/pub/mirbase/CURRENT/miFam.dat.gz, release 15, September 2010) (31). MiRBase works jointly with RFAM (32) to create the miRNA families, and a description of the pipeline used can be found at http://rfam.sanger.ac.uk/help. Deep-sequencing can generate numerous false miRNA gene predictions (33), which have the potential to bias our analyses. Recent releases of miRBase have focused on cleaning up the miRNA gene predictions (33). First, we verified that all the miRNA genes in our dataset were still present in the release 17 of miRBase (April 2011), which likely indicates a low rate of false positives in our dataset. Second, false positives are not expected to show inter-species conservation. We did not use species-specific miRNAs in our analyses: the most recent families in the analysis of human miRNAs are primate-specific (shared between human and macaque); they are rodent-specific in the analysis of mouse miRNAs (shared between mouse and rat) (18).
Another dataset was retrieved from Ensembl (release 60, November 2010) (34). In Ensembl the ncRNA phylogenetic trees are built with ncRNA predictions classified by RFAM ids; the alignment is made using Infernal 1.0; trees are merged by TreeBeST using a combination of NJ and ML on genomic context alignment and secondary structure models (RAxML); orthologs are then inferred using the approach used for protein-coding genes (personal communication on Ensembl-dev mailing-list, 21 September 2010).
Dating of miRNA families appearance
The emergence of miRNA families was dated using the dataset of Peterson et al. (18), in which the appearance of a total of 537 families was attributed by parsimony to a taxonomic group. Molecular estimates of the age of taxonomic groups was obtained from the database TimeTree (www.timetree.org, December 2010) (35). When available the ‘TimeTree expert’ result was used. Otherwise the weighted average (nuclear + mitochondrial) was used. The density of appearance of new miRNA families in human and mouse is illustrated in Supplementary Figure S1.
An independent estimation of the age of miRNA families was also obtained from the ncRNA Gene trees provided by Ensembl Compara (see above). The age of a miRNA family was dated by its first appearance in the phylogeny; this consists in retrieving the TimeTree age of the oldest node of its Gene Tree family in Ensembl release 60.
The dating of appearance of protein coding genes families was estimated with the same methodology using the protein-coding Gene Trees in Ensembl release 60.
Expression data
Gene expression patterns of miRNAs were retrieved from Bgee, a database for the study of gene-expression evolution (release 8, January 2011; http://bgee.unil.ch/) (36). Bgee includes miRNA gene information from Ensembl and miRNA families from miRBase (31). RNA library sequencing data for miRNAs of different species are retrieved from smiRNAdb (http://www.mirz.unibas.ch/cloningprofiles/) (37) and Unigene (38). The data used here come mostly from a study based on small RNA library sequencing (39). A miRNA gene was considered as expressed in a given tissue if at least one count for this gene was detected in a library performed on this tissue. miRNA genes that showed no expression data in any of the analyzed tissues were not considered for the analysis. For the analysis of the relation between age of miRNAs and level of expression in individual tissues, only tissues displaying more than 10 genes with expression were considered. In situ expression data for mouse miRNAs in Bgee are retrieved from the mouse Gene expression Database at MGI (40). For Supplementary Figure S2, PAR-CLIP data were retrieved from GEO (GSE28859) (41). We used the mean of the processed data from two replicates of MNase-treated PAR-CLIP on the Ago2 protein in HEK293 cells. This methodology was shown to be precise and quantitative (41). Microarray data were retrieved from GEO (GSE29356) (4). Hybridizations were made on the Agilent-021827 Human miRNA Microarray V3 platform. We used the mean of the processed data from two replicates of 2-day-old human cerebellar cortex samples. Similar results were obtained when samples of different age or prefrontal cortex samples were used.
Multi-species comparison
In Bgee, expression data are mapped to ontologies formalizing the description of the anatomy of different species. The ontologies describing the anatomy of different species are aligned to generate a common ontology describing the homologous tissues among vertebrate species (HOGs, Homologous Organ Groups) (42,43). This ontology can be downloaded from http://bgee.unil.ch/bgee/bgee?page=download.
Bgee maps tissues and organs from each species (here human and mouse) to the HOG ontology. Thus expression patterns from homologous genes are mapped to homologous organs. We considered only HOGs for which expression of more than 10 genes was detected in both human and mouse. Of note, when expression data is available for less than 10 genes, or in one species but not the other, or in tissues not directly mapped to a HOG, the ontology structure allows us to recover this information by mapping data to the parent structures.
Expression divergence
The significance of expression divergence was assessed using a statistical framework developed by Audic and Claverie (44). The probability for relative frequencies of counts to be identical between two conditions (i.e. two libraries) is given by:
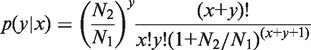 |
where x is the number of counts observed for a gene in a library of size N1 and y is the number of counts mapped to the same gene in a second library of size N2. We used this test to assess the probability (P-value) that counts of a miRNA family observed in human and mouse homologous tissues correspond to the same relative frequency in both libraries. Small P-values thus characterize cases of expression divergence between human and mouse homologous tissues. Genes with no expression in any of the seven HOGs considered in both species were not considered in this analysis.
Protein-coding genes target analysis
The mRNA targets of human and mouse miRNAs were predicted by the ElMMo algorithm (45). We retrieved the ElMMo miRNA target prediction flat files v5 (January 2011) at http://www.mirz.unibas.ch/miRNAtargetPredictionBulk.php.
The mapping of RefSeq IDs to Ensembl IDs (release 60) was downloaded using Biomart. We only considered target genes where the miRNA binding site was found to be under evolutionary selective pressure with high enough confidence (posterior probability > 0.8 as recommended by the authors).
Another independent dataset was retrieved from a recent study in mouse (46). The authors integrated experimental evidences to detect downstream mRNA transcripts likely to respond causally to changes in miRNA levels. The dataset was found in Supplementary Table 1c of the study (46). The mapping of the microarray was found on GEO (47) under the accession GPL3677.
RESULTS
miRNA families and their rate of acquisition through time
We find a positive correlation between the age of appearance of miRNA families and their size, both in human and mouse (Spearman correlation, ρ = 0.47, P = 1.1e − 16; and ρ = 0.41, P = 8.7e − 10; respectively). But this trend could be potentially due to a bias in miRNA gene annotation: ancient miRNA genes have been reported to be more expressed (26,27), and might be easier to detect. We controlled for this potential factor by performing the same analysis, restricted to human miRNA genes that have no mapped sequence tags in the database Bgee (36). These genes are likely to be expressed at low levels. Still, a significant correlation between family size and age is found for this subset (ρ = 0.37, P = 5.8e − 5), confirming that annotation bias is not likely to have a major effect. This is consistent with expectations of good annotation of the human and mouse genomes (48). We also verified these results with an independent method of dating families. We used miRNA trees provided by Ensembl to extract family size, and date of appearance (see ‘Materials and Methods’ section). Although the number of phylogenetic trees for miRNA families available in the release 60 of Ensembl is relatively low (272 trees), this subset also displays a very similar trend (ρ = 0.44, P = 1.4e − 12 for human; and ρ = 0.42, P = 3.9e − 9 for mouse).
These results suggest that the ‘duplication-mutation model’ of miRNA evolution plays a significant role in miRNA diversification, an idea that is debated—see Shabalina and Koonin (23) for pros and Chen and Rajewsky (21) for cons. To compare this to a model where most new miRNAs arise de novo, we divided the number of miRNA genes in each family by its age, a rough estimate of the rate of acquisition of miRNAs by duplication through evolutionary time (17). Both in human and mouse the same median rate of 0.011 new miRNA per My is observed. By contrast, the rate of de novo acquisition of families, while irregular over time (Supplementary Figure S1) is an order of magnitude higher (0.26 new family per My in human, and 0.20 in mouse). This suggest that the ‘duplication-mutation’ process, although significant, accounts for only a small fraction of newly emerged miRNAs, and that de novo acquisition explains the origin of the majority of new miRNA genes (21). This is further supported by the observation that the median size of a miRNA gene family is of only one member in both species (mean 2.06 in human, 1.93 in mouse) in our dataset.
Expression levels of miRNA families of different ages
Conserved miRNA genes have been shown to be expressed more robustly and at higher levels than non-conserved ones (26,27,29,30), suggesting that older miRNAs are more expressed than novel miRNAs. However the relation between the age of miRNA genes and their expression has never been directly tested to our knowledge. We estimated expression levels in human and mouse, based on the counts observed in the pool of all libraries available in the database Bgee. We find it to be positively correlated with the age of miRNA genes both in human and mouse (ρ = 0.36, P = 1e − 6; and ρ = 0.21, P = 0.0047 respectively; Figure 1). The trend is best modeled by an exponential rather than a linear relation (R2 = 0.13 and P = 6.2e − 7 versus R2 = 0.042 and P = 0.007 respectively for human; R2 = 0.051 and P = 0.0027 versus R2 = 0.036 and P = 0.013 respectively for mouse). We verified that this trend was supported by other types of quantitative data used to measure expression levels of miRNAs (PAR-CLIP and microarray, Supplementary Figure S2). This implies that the dynamics of gene changes might be different for old and recent miRNAs: with evolutionary time, expression level increase appears stronger. Yet, in the ‘transcriptional control model’ no further expression increase is expected once a miRNA gene has acquired a functional role in the genome (21).
Figure 1.

Relation between the age of miRNA genes and their level of expression. Relation between the age of miRNA genes (date of appearance of their family in the genome, in Mya) and their expression level, in human (A) and in mouse (B). Expression level was calculated as the sum of counts observed in all tissues with expression in Bgee. miRNA genes that showed no expression data in any tissue were not considered for the analysis. The y-axis is in logarithmic scale: an exponential regression had a better fit than a linear one. Exponential regression lines are plotted. Darker dots in the plot result from the superposition of several data points.
Evolution of expression levels of miRNA families in different tissues
We investigated whether the correlation between level of expression and age of miRNAs is led by some specific anatomical structures, or is a general property independent of anatomy. A similar analysis using expression data separately for each tissue in human and mouse yields a large amount of variation in the strength of the relation (Figure 2), from ρ = 0.09 to ρ = 0.40 in human, and from ρ = −0.056 to ρ = 0.33 in mouse. In human and mouse the weakest correlations are seen in tissues from the nervous system. In mouse, low correlations are observed in embryonic tissues, but this cannot be compared to human since no embryonic tissue was sampled. Across the range of correlation coefficients, a number of other tissues show consistent patterns in both species (placenta in the low range of correlation coefficients, heart in the middle range and kidney and its subparts in the high range), although spleen stands as an exception with high correlation in human (ρ = 0.38) while it is rather low in mouse (ρ = 0.13); this might be due to a low number of genes being detected in the mouse spleen library.
Figure 2.

Relation between the age of miRNA genes and their level of expression in different tissues. (A) In human and (B) in mouse. The barplot displays for each tissue the value of the coefficient ρ of the Spearman’s rank correlation. Tissues are ranked according to their ρ coefficient. Gray bars represent tissues where a significant correlation was observed after Bonferroni correction (17 tissues; P < 0.0029); white bars represent tissues where the correlation was not significant. Numbers in the bars represent the number of genes with detectable expression (at least one sequence count detected) in each tissue. Anatomical structures displaying less than 10 genes with expression were not considered.
Of note, these estimates do not appear to be biased by the number of genes with detectable expression in each tissue (ρ = −0.039, P = 0.88 for human, ρ = −0.15, P = 0.57 for mouse). The use of rank correlations also controls for the disproportionate weight that some miRNAs would have in some tissues. For example, miR-122 is known to be highly expressed in liver where it regulates tightly the gene-expression network (49). Removing miR-122 from the analysis in liver yields a very similar correlation coefficient between the level of expression in liver and the age of miRNAs (ρ = 0.175 instead of ρ = 0.179).
Thus it seems that the global trend seen in Figure 1 is led by a subset of anatomical structures. Such strong variation has not been predicted by any model of evolution of miRNAs, to our knowledge.
Breadth of expression of miRNA families of different ages
We examined the correlation between the number of tissues in which a miRNA gene was detected (i.e. its breadth of expression) and its age. A positive correlation is found for both human and mouse (ρ = 0.31, P = 4.2e − 5; and ρ = 0.22, P = 0.0036, respectively; Supplementary Figure S3), in agreement with the ‘transcriptional control model’ which postulates that miRNA genes acquire broader expression as they get older (21).
However expression level is likely to be a confounding factor in this analysis: highly expressed genes—which are also older—are easier to detect, and might thus be found more broadly expressed. A Kruskal-Wallis test (non-parametric ANOVA) indeed identifies expression level as a significant factor to explain breadth of expression both in human and mouse (P = 7.8e − 7 and P = 3.3e − 9 respectively). To remove this confounding effect, we split our dataset into four different bins, containing genes of similar expression levels (based on quartiles of expression levels in the whole dataset). In each bin the picture is widely changed (Supplementary Table S1). Most bins display a negative association, which is marginally significant in human for genes with 4–13 counts. In human, in only one case is the correlation still positive, but strongly weakened and no longer significant. In mouse the correlation is still positive in two bins, but not significant.
To test further the relation between breadth of expression and age of miRNA genes, we turned to in situ hybridization data from mouse. This technique is more qualitative and can reveal detailed patterns of expression even for lowly expressed genes (50), thus contributing to reduce the bias due to expression level. The precision of in situ hybridization data also makes them a good alternative to gross tissue-level miRNA expression profiling to assess tissue specificity (51). Most of the data we used were generated in the framework of a single study, performing high-resolution and genome-wide in situ hybridization in mouse at embryonic day 14.5 (444 miRNAs studied) (50). This makes for a conservative test, since the association between expression level and age seems weaker in embryonic tissues (Figure 2B). In these data, there is a significant negative correlation between the age of a miRNA and the number of tissues in which it is expressed (ρ = −0.24, P = 0.0021; Figure 3), implying that novel miRNA genes are more likely to be broadly expressed than older genes.
Figure 3.

Relation between the age of miRNA genes and their breadth of expression. Relation between the age of miRNA genes and the number of anatomical structures in which they are expressed in mouse. The number of structures showing expression of miRNA genes was assessed using in situ hybridization data. The linear regression line is plotted. Darker dots in the plot result from the superposition of several data points.
This is consistent with a study that identified several tissue-specific mouse miRNAs that were conserved among vertebrates (52), but stands in contrast with the ‘transcriptional control model’ and other previously published results (29,39). It is still possible that the specificity of expression of young miRNA genes does not lie at the anatomical level, but at the developmental level. But it is quite likely that several studies suffered from the difficulty of assessing tissue-specificity using tag-sequencing techniques. Indeed, among miRNAs for which expression data was available both in the in situ dataset and in the small RNA library sequencing dataset, we do not detect a significant correlation between the breadth of expression assessed using in situ data and small RNA library sequencing data (ρ = −0.15, P = 0.26). A specific example, mir-451, illustrates well how small RNA library sequencing can give a misleading idea of breadth of expression. Mir-451 is expressed very specifically during the development of red blood cells (53,54) and accordingly, in situ data report expression in embryonic liver, the main site of red blood cell production during fetal development, and in aorta. Small RNA library sequencing data, however, report expression of mir-451 in tissues as diverse as heart, cerebral cortex, colon, kidney or placenta. We suggest caution in the assessment of breadth of expression using such datasets until the availability of ultra high-throughput sequencing—e.g. Illumina platforms—of small RNA libraries in multiple tissues helps to clarify our observations.
Comparison of miRNAs expressed in homologous tissues between human and mouse
For a direct comparison between human and mouse miRNA spatial expression patterns, a common framework is required. We used the manually curated dataset of homology relationships among anatomical structures of vertebrate species provided by the database Bgee (36). Homologous tissues are gathered in HOGs. All HOGs that included at least one human and one mouse tissue were considered for the analysis. The expression in substructures of each HOG was considered (see ‘Materials and Methods’ section). Seven HOGs displayed enough expression in both species to allow a comparison: placenta, stomach, heart, ovary, testis, brain and metanephros (kidney). We looked at the number of miRNA genes of different ages expressed in these HOGs in each species. To allow proper comparisons between species and between HOGs, the number of miRNA genes expressed was normalized by the total number of miRNA genes expressed in each HOG in each species separately (Figure 4). A good correlation is observed between the patterns in both species (ρ = 0.78, P = 2.6e − 15; only miRNAs that originated before the divergence of the two species were considered here). This might reflect purifying selection on the expression patterns of miRNAs during ∼91 Mya of independent evolution in human and mouse.
Figure 4.
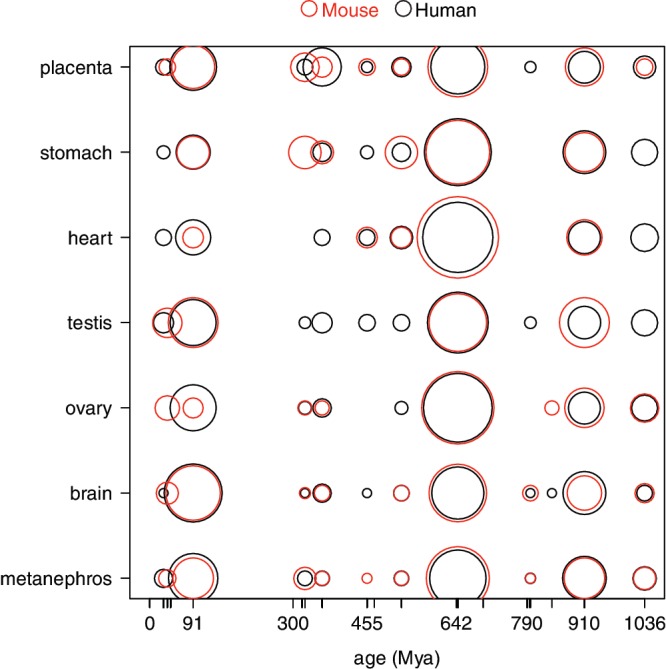
Comparison of miRNAs expression in human and mouse. Comparison of the number of miRNA genes of different ages expressed in human (black circles) and mouse (red circles) in different homologous tissues (HOGs). The surface of the circles is proportional to the number of miRNA found expressed, normalized by the total number of miRNA genes expressed in the different tissues considered for each species.
For each species separately however, the amount of variation is quite important between miRNAs of different ages, and between HOGs. miRNAs that appeared 91 Mya (mammals), 645 Mya (vertebrates), or 910 Mya (bilaterians) stand out because they represent a large proportion of the miRNAs expressed in human and mouse. This is consistent with the emergence of a large number of miRNA families during corresponding evolutionary transitions (Supplementary Figure S1) (14–18). At the anatomical level, some HOGs express relatively young miRNAs (brain, testis, placenta) while others express older miRNAs (heart, stomach). This is in agreement with the observation that the relation between expression level and age of miRNAs varies in strength among tissues (Figure 2). As might be expected, placenta, a recent tissue, tends to express young sets of miRNAs, as does testis, known to express fast evolving genes (55). Possibly linked to recently emerged anatomical structures (e.g. the mammal-specific neocortex) (56), the brain also expresses young miRNAs.
Comparison of expression levels of miRNA families between human and mouse
To analyze more precisely the patterns of divergence between human and mouse, we then compared directly the expression of miRNA families in each HOG. To gain statistical power, we assumed that duplicates present in a family had similar functions and we pooled their expression data by adding their respective counts. This is motivated by the observations that paralogous miRNAs usually share very similar mature sequences, and that they often show some level of functional compensation if one member of the family is experimentally deleted (57,58). To test the significance of the difference in counts observed between species, we used the test of Audic and Claverie (44) (see ‘Materials and Methods’ section). The test yields a probability (P-value) for each family in each HOG that observed counts reflect a similar level of expression in mouse and human. We adjusted the P-values for multiple testing (74 families in seven HOGS = 518 tests performed) using the FDR correction method (59), and we used −log10 of the adjusted P-values as a score of expression divergence for all families in the seven HOGs (Supplementary Figure S4).
Large differences can be observed among HOGs (Kruskal–Wallis test; P = 4.0e − 43): while only a handful of families significantly differ between human and mouse for some tissues (testis, heart, stomach), many do for others (up to 49% for metanephros/kidney). These results suggest that different tissues did not experience the same amount of changes in gene regulatory networks across evolution. The pattern does not parallel the divergence of protein-coding genes expression in several human and chimpanzee tissues (60), nor among amniote tissues (61). Among the four tissues in common with our analysis (heart, kidney, testis and brain), the lowest expression divergence was found for brain, while in our analysis it is in second position. Testis, heart and kidney displayed intermediate levels of divergence (after liver which is not analyzed here) in Khaitovich et al. (60), while in Brawand et al. testis displayed larger amounts of expression divergence (61). In our results they show diverse patterns and testis seem to be the least divergent tissue.
It is possible that part of the differences results from our methodology, i.e. the low amount of data available for some tissues limits the power of the statistical test. Lowly significant results can either reflect a low divergence of expression, or a lack of statistical power to detect divergence. This lack of power is particularly marked for families which display no expression in a given HOG, for at least one of the two species. To take this into account, we tested only the subset of families in HOGs for which both species had at least one count (Figure 5A). As expected, due to the increased statistical power, the proportion of significant families increases in most HOGs (up to 70% for metanephros/kidney). Their ranking is also affected: testis now displays an intermediate pattern, similar to ovary and placenta, more consistent with the observations of Khaitovich et al. (60), although still at odds with Brawand et al. (61). Brain still displays an elevated rate of divergence, reflecting that there might be less purifying selection, or more positive selection, acting on expression patterns of miRNAs than on those of protein-coding genes in the brain (62). Of note, our test cannot differentiate between divergence due to relaxed purifying selection or due to positive selection.
Figure 5.

Expression divergence of miRNAs between human and mouse. (A) Boxplot of expression divergence of miRNA families in different tissues between human and mouse. The significance of expression divergence was assessed using a test developed by Audic and Claverie (see ‘Materials and Methods’ section). The P-values are corrected for multiple testing, and −log10 of the adjusted P-values is displayed on the x-axis. This allows to spread on a broad range the small adjusted P-values, which correspond to significant cases of expression divergence. Only families where expression counts were non null in both species were used in this analysis; see Supplementary Figure S3 for the analysis using the complete dataset. A vertical dashed line indicates the 20% FDR threshold. (B) Relation between the expression divergence score, −log10 (adjusted P-values), of miRNA families between human and mouse and their date of appearance in the genome. Darker dots in the plot result from the superposition of several data points.
Regarding the relation between the divergence of expression patterns and the age of appearance of miRNA families, no significant pattern is observed (Figure 5B). This might result from the interplay between two effects: young genes are under less strong purifying selection and thus more free to diverge; old genes on the contrary are under stronger purifying selection but had more time to diverge.
Analysis of protein-coding targets of miRNAs of different ages
We examined the relation between the age of miRNA genes and the number of protein-coding genes they target. It is still difficult to predict with accuracy the targets of miRNA genes (63), and currently available methods yield high rates of false positives. We used first the ElMMo algorithm, a Bayesian method for the inference of miRNA target sites (45). ElMMo incorporates information on the phylogenetic conservation of miRNA binding sites in vertebrate species. This method was shown to perform among the best in a benchmarking study (64). We considered only predictions of miRNA–targets relationships when the miRNA binding site on the target gene was evolutionary conserved. Both in human and mouse we found no significant association between the age of miRNAs and the number of protein-coding genes they target (respectively ρ = 0.044, P = 0.78 and ρ = −0.042, P = 0.85). However this analysis might suffer from the low quality of in-silico prediction methods, and from the transfer of predictions from RefSeq mRNA sequences to Ensembl gene models—3′-UTR definitions sometimes differ between databases (65).
Secondly, we used a recently published study where predicted targets of miRNAs in mouse were inferred from experimental data, using sophisticated statistical procedures to infer causal relationships (46,66). This dataset includes a low number of predicted relationships, and contrary to in silico prediction methods is likely to include false negatives rather than false positives. Here we find a marginally significant negative correlation between the age of miRNAs and the number of gene they target (ρ = −0.39, P = 0.063). This is consistent with the predicted decrease in number of targets between the two phases of the life of miRNAs (21).
We then investigated the relationship between the age of miRNAs and the age of their targets. Using ElMMo predictions, no significant relationship is observed in human (ρ = 0.0013, P = 0.86), while a weak significant correlation is observed in mouse (ρ = 0.03, P = 0.001). This correlation is stronger if we use predictions from the experimental dataset (mouse only; ρ = 0.18, P = 0.0038), although only 248 miRNA–target relationships are used in this case.
DISCUSSION
The ‘transcriptional control model’ formulated by Chen and Rajewski (21) describes two phases in the life of miRNA genes. Because the binding sites on mRNAs are short, recently evolved miRNAs are likely to target many mRNAs in the genome. These interactions may have uncontrolled phenotypic consequences, and thus only miRNAs that are initially expressed at low levels and in specific tissues, leading to mildly deleterious fitness effects, are expected to be kept on the long term in the genome. In a second phase, purifying selection would purge from the genome the deleterious target sites of miRNAs, enabling miRNAs with a beneficial regulatory function to strengthen their expression and relax their tissue-specificity.
Several studies have relied on indirect evidence to analyze the evolution of miRNA genes. For example, differential rates of molecular evolution of miRNAs inside a genome were used to determine groups of presumably old or young miRNAs (26,27). Here, we used the age of appearance of miRNA families, as determined by phylogenetic analysis (18), and we crossed it with data in two mammalian species, human and mouse. This methodology allows us to perform a more detailed comparative analysis of the evolutionary patterns of miRNA genes in mammals.
On the one hand, our analysis supports the main prediction of the model, namely that miRNAs experience an increase in expression levels with evolutionary time. It is indeed likely that highly expressed newly arisen miRNAs cause severe fitness defects and are not retained in the genome. We confirm that age of appearance is a major determinant of the expression patterns of miRNAs. We also confirm the predicted decrease in number of targets between the two phases of the life of miRNAs. Of note, it is still difficult to predict with accuracy the targets of miRNA genes (63), and currently available methods yield high rates of false positives (computational) or of false negatives (experimental). Thus this result should be confirmed when higher quality data will be available. However it is consistent with the observation that genes involved in basic cellular processes avoid miRNA regulation by a depletion of miRNA binding sites in their 3′-UTRs (12).
On the other hand, several predictions are not supported. First, it is implicit in the model that two distinct phases should be observed in the relation between miRNA age and expression, corresponding to the two phases of life of miRNAs. Notably, a saturation of expression levels may be expected once miRNAs become functional and integrated in a gene regulatory network. However we observe a regular and exponential increase in expression levels with age of miRNAs. We can speculate that miRNAs might have to follow the observed increase in expression of protein-coding genes with age (67), since we find a positive correlation between the age miRNAs and the age of the protein-coding genes they target. Although the latter increase was found to be linear, the regulatory dynamics are complex and might not translate into a linear increase of miRNAs (68).
Second, we observe that the relation between age and level of expression is largely variable between different tissues, with embryonic and nervous structures displaying a more limited increase of miRNA expression with age. Such tissue-specific properties regarding miRNA regulation are not predicted by any model, but are reminiscent of selective pressures acting on protein-coding genes, which show the smallest expression divergence in neuronal and embryonic tissues (60,61,69,70). The optimal expression level of a gene corresponds to a trade-off between the benefits and costs of its expression (71) and this trade-off probably differs between tissues. Notably, errors in the process of protein production, potentially toxic to the cell, are more detrimental in cells that do not regenerate, such as neuronal cells, or in progenitor embryonic cells. A recent study confirms that miRNA genes also experience selective pressure associated to the toxicity cost of errors in their production process (72) and it is likely that this pattern may lead to tissue-specific patterns similar to those of protein-coding genes. On top of this, another layer of selective pressure acting on miRNA expression evolution is related to the control of gene regulatory networks in different tissues: the differential patterns observed in neuronal and embryonic tissues might reflect a need for tighter regulation of genes expressed in these tissues, a hypothesis consistent with the observation of an enrichment of genes involved in developmental processes, among genes targeted by miRNAs (12,73). Similarly, genes expressed in neuronal tissues have longer 3′-UTRs (74), while genes expressed in proliferating cells have shorter 3′-UTRs and less miRNA target sites (75). In summary, the analysis of the evolution of tissue-specific expression patterns of miRNAs is complicated by the interplay between the tissue-specific selective pressures acting directly on the miRNAs, and those acting on their target genes, leading to further evolutionary changes of miRNAs in return. This could provide one reason for an unexpected result: it is also in the brain that we observe high rates of divergence in miRNA expression between human and mouse, although a recent study suggests that this pattern could be due to human-specific adaptations (62). Careful experimental designs or computer simulations are needed to disentangle both effects.
Finally, the breadth of expression of miRNAs was predicted to increase with evolutionary time (21), whereas we observe a significant decrease. The original model was formulated based on studies using tag-based techniques to measure expression (29,39). We show that these techniques are likely to suffer from a bias regarding the assessment of specificity of expression, because ancient miRNAs are more highly expressed and more easily detected. Biologically, the decrease in breadth seems quite reasonable, since the establishment of a specific expression pattern is more complex than a broad expression pattern (76).
CONCLUSION
Using comparative genomics and transcriptomics, we performed here what is to our knowledge the first direct test of the ‘transcriptional control model’ of miRNAs (21,23). We studied evolutionary patterns of miRNA genes over a billion years time scale, and detected significant signal at this time scale for all aspects analyzed. Still, it is possible that on short evolutionary time scales—the first million years of miRNA life—some patterns may differ. Our study underlines the need to consider miRNA tissue specific patterns, and coevolution patterns of miRNAs with their targets, in future studies.
SUPPLEMENTARY DATA
Supplementary Data are available at NAR Online: Supplementary Table 1, Supplementary Figures 1–4 and Supplementary Dataset 1.
FUNDING
Etat de Vaud; The Swiss National Science Foundation [116798, 133011]; The Swiss Institute for Bioinformatics. Funding for open access charge: Etat de Vaud.
Conflict of interest statement. None declared.
Supplementary Material
ACKNOWLEDGEMENTS
The authors thank Frédéric Bastian, Jean Hausser, Julien Meunier, Alexander Stark, and members of the Robinson-Rechavi lab for stimulating discussions. J.R., M.G.P. and M.R.R. contributed to conception and design of the study and interpretation of data. J.R. and M.G.P. carried out the analyses. J.R. and M.R.R. wrote the manuscript. All authors have given final approval of the version to be published.
REFERENCES
- 1.Carthew RW, Sontheimer EJ. Origins and mechanisms of miRNAs and siRNAs. Cell. 2009;136:642–655. doi: 10.1016/j.cell.2009.01.035. [DOI] [PMC free article] [PubMed] [Google Scholar]
- 2.Somel M, Guo S, Fu N, Yan Z, Hu HY, Xu Y, Yuan Y, Ning Z, Hu Y, Menzel C, et al. MicroRNA, mRNA, and protein expression link development and aging in human and macaque brain. Genome Res. 2010;20:1207–1218. doi: 10.1101/gr.106849.110. [DOI] [PMC free article] [PubMed] [Google Scholar]
- 3.Kloosterman WP, Plasterk RHA. The diverse functions of microRNAs in animal development and disease. Dev Cell. 2006;11:441–450. doi: 10.1016/j.devcel.2006.09.009. [DOI] [PubMed] [Google Scholar]
- 4.Somel M, Liu X, Tang L, Yan Z, Hu H, Guo S, Jiang X, Zhang X, Xu G, Xie G, et al. MicroRNA-driven developmental remodeling in the brain distinguishes humans from other primates. PLoS Biol. 2011;9:e1001214. doi: 10.1371/journal.pbio.1001214. [DOI] [PMC free article] [PubMed] [Google Scholar]
- 5.Lu J, Fu Y, Kumar S, Shen Y, Zeng K, Xu A, Carthew R, Wu C-I. Adaptive evolution of newly emerged micro-RNA genes in Drosophila. Mol. Biol. Evol. 2008;25:929–938. doi: 10.1093/molbev/msn040. [DOI] [PMC free article] [PubMed] [Google Scholar]
- 6.Zhang R, Peng Y, Wang W, Su B. Rapid evolution of an X-linked microRNA cluster in primates. Genome Res. 2007;17:612–617. doi: 10.1101/gr.6146507. [DOI] [PMC free article] [PubMed] [Google Scholar]
- 7.Niwa R, Slack FJ. The evolution of animal microRNA function. Curr. Opin. Genet. Dev. 2007;17:145–150. doi: 10.1016/j.gde.2007.02.004. [DOI] [PubMed] [Google Scholar]
- 8.Stark A, Kheradpour P, Parts L, Brennecke J, Hodges E, Hannon GJ, Kellis M. Systematic discovery and characterization of fly microRNAs using 12 Drosophila genomes. Genome Res. 2007;17:1865–1879. doi: 10.1101/gr.6593807. [DOI] [PMC free article] [PubMed] [Google Scholar]
- 9.Wu CI, Shen Y, Tang T. Evolution under canalization and the dual roles of microRNAs: a hypothesis. Genome Res. 2009;19:734–743. doi: 10.1101/gr.084640.108. [DOI] [PMC free article] [PubMed] [Google Scholar]
- 10.Flynt AS, Lai EC. Biological principles of microRNA-mediated regulation: shared themes amid diversity. Nat. Rev. Genet. 2008;9:831–842. doi: 10.1038/nrg2455. [DOI] [PMC free article] [PubMed] [Google Scholar]
- 11.Bartel DP, Chen C-Z. Micromanagers of gene expression: the potentially widespread influence of metazoan microRNAs. Nat. Rev. Genet. 2004;5:396–400. doi: 10.1038/nrg1328. [DOI] [PubMed] [Google Scholar]
- 12.Stark A, Brennecke J, Bushati N, Russell RB, Cohen SM. Animal microRNAs confer robustness to gene expression and have a significant impact on 3′UTR evolution. Cell. 2005;123:1133–1146. doi: 10.1016/j.cell.2005.11.023. [DOI] [PubMed] [Google Scholar]
- 13.Levine M, Tjian R. Transcription regulation and animal diversity. Nature. 2003;424:147–151. doi: 10.1038/nature01763. [DOI] [PubMed] [Google Scholar]
- 14.Hertel J, Lindemeyer M, Missal K, Fried C, Tanzer A, Flamm C, Hofacker I, Stadler P. T.S.o.B.C.L. The expansion of the metazoan microRNA repertoire. BMC Genomics. 2006;7:25. doi: 10.1186/1471-2164-7-25. [DOI] [PMC free article] [PubMed] [Google Scholar]
- 15.Prochnik S, Rokhsar D, Aboobaker A. Evidence for a microRNA expansion in the bilaterian ancestor. Dev. Genes Evol. 2007;217:73–77. doi: 10.1007/s00427-006-0116-1. [DOI] [PubMed] [Google Scholar]
- 16.Grimson A, Srivastava M, Fahey B, Woodcroft BJ, Chiang HR, King N, Degnan BM, Rokhsar DS, Bartel DP. Early origins and evolution of microRNAs and Piwi-interacting RNAs in animals. Nature. 2008;455:1193–1197. doi: 10.1038/nature07415. [DOI] [PMC free article] [PubMed] [Google Scholar]
- 17.Heimberg AM, Sempere LF, Moy VN, Donoghue PC, Peterson KJ. MicroRNAs and the advent of vertebrate morphological complexity. Proc. Natl Acad. Sci. USA. 2008;105:2946–2950. doi: 10.1073/pnas.0712259105. [DOI] [PMC free article] [PubMed] [Google Scholar]
- 18.Peterson KJ, Dietrich MR, McPeek MA. MicroRNAs and metazoan macroevolution: insights into canalization, complexity, and the Cambrian explosion. BioEssays. 2009;31:736–747. doi: 10.1002/bies.200900033. [DOI] [PubMed] [Google Scholar]
- 19.Wheeler BM, Heimberg AM, Moy VN, Sperling EA, Holstein TW, Heber S, Peterson KJ. The deep evolution of metazoan microRNAs. Evol. Dev. 2009;11:50–68. doi: 10.1111/j.1525-142X.2008.00302.x. [DOI] [PubMed] [Google Scholar]
- 20.Campo-Paysaa F, Semon M, Cameron RA, Peterson KJ, Schubert M. microRNA complements in deuterostomes: origin and evolution of microRNAs. Evol. Dev. 2011;13:15–27. doi: 10.1111/j.1525-142X.2010.00452.x. [DOI] [PubMed] [Google Scholar]
- 21.Chen K, Rajewsky N. The evolution of gene regulation by transcription factors and microRNAs. Nat. Rev. Genet. 2007;8:93–103. doi: 10.1038/nrg1990. [DOI] [PubMed] [Google Scholar]
- 22.Berezikov E, Robine N, Samsonova A, Westholm JO, Naqvi A, Hung J-H, Okamura K, Dai Q, Bortolamiol-Becet D, Martin R, et al. Deep annotation of Drosophila melanogaster microRNAs yields insights into their processing, modification, and emergence. Genome Res. 2011;21:203–215. doi: 10.1101/gr.116657.110. [DOI] [PMC free article] [PubMed] [Google Scholar]
- 23.Shabalina SA, Koonin EV. Origins and evolution of eukaryotic RNA interference. Trends Ecol. Evol. 2008;23:578–587. doi: 10.1016/j.tree.2008.06.005. [DOI] [PMC free article] [PubMed] [Google Scholar]
- 24.Liu N, Okamura K, Tyler DM, Phillips MD, Chung WJ, Lai EC. The evolution and functional diversification of animal microRNA genes. Cell Res. 2008;18:985–996. doi: 10.1038/cr.2008.278. [DOI] [PMC free article] [PubMed] [Google Scholar]
- 25.Gu X, Su Z, Huang Y. Simultaneous expansions of microRNAs and protein-coding genes by gene/genome duplications in early vertebrates. J. Exp. Zool. B Mol. Dev. Evol. 2009;312B:164–170. doi: 10.1002/jez.b.21273. [DOI] [PubMed] [Google Scholar]
- 26.Liang H, Li W-H. Lowly expressed human microRNA genes evolve rapidly. Mol. Biol. Evol. 2009;26:1195–1198. doi: 10.1093/molbev/msp053. [DOI] [PMC free article] [PubMed] [Google Scholar]
- 27.Berezikov E, Thuemmler F, van Laake LW, Kondova I, Bontrop R, Cuppen E, Plasterk RHA. Diversity of microRNAs in human and chimpanzee brain. Nat. Genet. 2006;38:1375–1377. doi: 10.1038/ng1914. [DOI] [PubMed] [Google Scholar]
- 28.Nozawa M, Miura S, Nei M. Origins and evolution of MicroRNA genes in Drosophila species. Genome Biol. Evol. 2010;2:180–189. doi: 10.1093/gbe/evq009. [DOI] [PMC free article] [PubMed] [Google Scholar]
- 29.Ruby JG, Stark A, Johnston WK, Kellis M, Bartel DP, Lai EC. Evolution, biogenesis, expression, and target predictions of a substantially expanded set of Drosophila microRNAs. Genome Res. 2007;17:1850–1864. doi: 10.1101/gr.6597907. [DOI] [PMC free article] [PubMed] [Google Scholar]
- 30.Lu J, Shen Y, Wu Q, Kumar S, He B, Shi S, Carthew RW, Wang SM, Wu C-I. The birth and death of microRNA genes in Drosophila. Nat. Genet. 2008;40:351–355. doi: 10.1038/ng.73. [DOI] [PubMed] [Google Scholar]
- 31.Griffiths-Jones S, Saini HK, van Dongen S, Enright AJ. miRBase: tools for microRNA genomics. Nucleic Acids Res. 2008;36:D154–D158. doi: 10.1093/nar/gkm952. [DOI] [PMC free article] [PubMed] [Google Scholar]
- 32.Gardner PP, Daub J, Tate JG, Nawrocki EP, Kolbe DL, Lindgreen S, Wilkinson AC, Finn RD, Griffiths-Jones S, Eddy SR, et al. Rfam: updates to the RNA families database. Nucleic Acids Res. 2009;37:D136–D140. doi: 10.1093/nar/gkn766. [DOI] [PMC free article] [PubMed] [Google Scholar]
- 33.Kozomara A, Griffiths-Jones S. miRBase: integrating microRNA annotation and deep-sequencing data. Nucleic Acids Res. 2011;39:D152–D157. doi: 10.1093/nar/gkq1027. [DOI] [PMC free article] [PubMed] [Google Scholar]
- 34.Flicek P, Amode MR, Barrell D, Beal K, Brent S, Chen Y, Clapham P, Coates G, Fairley S, Fitzgerald S, et al. Ensembl 2011. Nucleic Acids Res. 2011;39:D800–D806. doi: 10.1093/nar/gkq1064. [DOI] [PMC free article] [PubMed] [Google Scholar]
- 35.Hedges SB, Dudley J, Kumar S. TimeTree: a public knowledge-base of divergence times among organisms. Bioinformatics. 2006;22:2971–2972. doi: 10.1093/bioinformatics/btl505. [DOI] [PubMed] [Google Scholar]
- 36.Bastian F, Parmentier G, Roux J, Moretti S, Laudet V, Robinson-Rechavi M. DILS: Data Integration in the Life Sciences. Vol. 5109. Springer Berlin/Heidelberg: 2008. pp. 124–131. [Google Scholar]
- 37.Hausser J, Berninger P, Rodak C, Jantscher Y, Wirth S, Zavolan M. MirZ: an integrated microRNA expression atlas and target prediction resource. Nucleic Acids Res. 2009;37:W266–W272. doi: 10.1093/nar/gkp412. [DOI] [PMC free article] [PubMed] [Google Scholar]
- 38.Pontius JU, Wagner L, Schuler GD. In: The NCBI Handbook. McEntyre J, Ostell J, editors. Bethesda, MD: National Library of Medicine, US, NCBI; 2003. [Google Scholar]
- 39.Landgraf P, Rusu M, Sheridan R, Sewer A, Iovino N, Aravin A, Pfeffer S, Rice A, Kamphorst AO, Landthaler M, et al. A Mammalian microRNA expression atlas based on small RNA library sequencing. Cell. 2007;129:1401–1414. doi: 10.1016/j.cell.2007.04.040. [DOI] [PMC free article] [PubMed] [Google Scholar]
- 40.Finger JH, Smith CM, Hayamizu TF, McCright IJ, Eppig JT, Kadin JA, Richardson JE, Ringwald M. The mouse Gene Expression Database (GXD): 2011 update. Nucleic Acids Res. 2011;39:D835–D841. doi: 10.1093/nar/gkq1132. [DOI] [PMC free article] [PubMed] [Google Scholar]
- 41.Kishore S, Jaskiewicz L, Burger L, Hausser J, Khorshid M, Zavolan M. A quantitative analysis of CLIP methods for identifying binding sites of RNA-binding proteins. Nat. Methods. 2011;8:559–564. doi: 10.1038/nmeth.1608. [DOI] [PubMed] [Google Scholar]
- 42.Parmentier G, Bastian FB, Robinson-Rechavi M. Homolonto: generating homology relationships by pairwise alignment of ontologies and application to vertebrate anatomy. Bioinformatics. 2010;26:1766–1771. doi: 10.1093/bioinformatics/btq283. [DOI] [PMC free article] [PubMed] [Google Scholar]
- 43.Niknejad A, Comte A, Parmentier G, Roux J, Bastian FB, Robinson-Rechavi M. vHOG, a multi-species vertebrate ontology of homologous organs groups. Bioinformatics. 2012;28:1017–1020. doi: 10.1093/bioinformatics/bts048. [DOI] [PMC free article] [PubMed] [Google Scholar]
- 44.Audic S, Claverie JM. The significance of digital gene expression profiles. Genome Res. 1997;7:986–995. doi: 10.1101/gr.7.10.986. [DOI] [PubMed] [Google Scholar]
- 45.Gaidatzis D, van Nimwegen E, Hausser J, Zavolan M. Inference of miRNA targets using evolutionary conservation and pathway analysis. BMC Bioinformatics. 2007;8:69. doi: 10.1186/1471-2105-8-69. [DOI] [PMC free article] [PubMed] [Google Scholar]
- 46.Su W-L, Kleinhanz RR, Schadt EE. Characterizing the role of miRNAs within gene regulatory networks using integrative genomics techniques. Mol. Syst. Biol. 2011;7:490. doi: 10.1038/msb.2011.23. [DOI] [PMC free article] [PubMed] [Google Scholar]
- 47.Barrett T, Troup DB, Wilhite SE, Ledoux P, Evangelista C, Kim IF, Tomashevsky M, Marshall KA, Phillippy KH, Sherman PM, et al. NCBI GEO: archive for functional genomics data sets – 10 years on. Nucleic Acids Res. 2011;39:D1005–D1010. doi: 10.1093/nar/gkq1184. [DOI] [PMC free article] [PubMed] [Google Scholar]
- 48.Chiang HR, Schoenfeld LW, Ruby JG, Auyeung VC, Spies N, Baek D, Johnston WK, Russ C, Luo S, Babiarz JE, et al. Mammalian microRNAs: experimental evaluation of novel and previously annotated genes. Genes Dev. 2010;24:992–1009. doi: 10.1101/gad.1884710. [DOI] [PMC free article] [PubMed] [Google Scholar]
- 49.Girard M, Jacquemin E, Munnich A, Lyonnet S, Henrion-Caude A. miR-122, a paradigm for the role of microRNAs in the liver. J. Hepatol. 2008;48:648–656. doi: 10.1016/j.jhep.2008.01.019. [DOI] [PubMed] [Google Scholar]
- 50.Diez-Roux G, Banfi S, Sultan M, Geffers L, Anand S, Rozado D, Magen A, Canidio E, Pagani M, Peluso I, et al. A high-resolution anatomical atlas of the transcriptome in the mouse embryo. PLoS Biol. 2011;9:e1000582. doi: 10.1371/journal.pbio.1000582. [DOI] [PMC free article] [PubMed] [Google Scholar]
- 51.Nelson PT, Wilfred BR. In situ hybridization is a necessary experimental complement to microRNA (miRNA) expression profiling in the human brain. Neurosci. Lett. 2009;466:69–72. doi: 10.1016/j.neulet.2009.04.044. [DOI] [PMC free article] [PubMed] [Google Scholar]
- 52.Lagos-Quintana M, Rauhut R, Yalcin A, Meyer J, Lendeckel W, Tuschl T. Identification of tissue-specific microRNAs from mouse. Curr. Biol. 2002;12:735–739. doi: 10.1016/s0960-9822(02)00809-6. [DOI] [PubMed] [Google Scholar]
- 53.Dore LC, Amigo JD, Dos Santos CO, Zhang Z, Gai X, Tobias JW, Yu D, Klein AM, Dorman C, Wu W, et al. A GATA-1-regulated microRNA locus essential for erythropoiesis. Proc. Natl Acad. Sci. USA. 2008;105:3333–3338. doi: 10.1073/pnas.0712312105. [DOI] [PMC free article] [PubMed] [Google Scholar]
- 54.Rathjen T, Nicol C, McConkey G, Dalmay T. Analysis of short RNAs in the malaria parasite and its red blood cell host. FEBS Lett. 2006;580:5185–5188. doi: 10.1016/j.febslet.2006.08.063. [DOI] [PubMed] [Google Scholar]
- 55.Ellegren H, Parsch J. The evolution of sex-biased genes and sex-biased gene expression. Nat. Rev. Genet. 2007;8:689–698. doi: 10.1038/nrg2167. [DOI] [PubMed] [Google Scholar]
- 56.Karlen SJ, Krubitzer L. Percept, Decision, Action: Bridging the Gaps. Chichester, UK: Novartis Foundation Symposium 270, John Wiley & Sons, Ltd; 2008. The Evolution of the Neocortex in Mammals: Intrinsic and Extrinsic Contributions to the Cortical Phenotype. In; pp. 146–163. [PubMed] [Google Scholar]
- 57.Miska EA, Alvarez-Saavedra E, Abbott AL, Lau NC, Hellman AB, McGonagle SM, Bartel DP, Ambros VR, Horvitz HR. Most Caenorhabditis elegans microRNAs are individually not essential for development or viability. PLoS Genet. 2007;3:e215. doi: 10.1371/journal.pgen.0030215. [DOI] [PMC free article] [PubMed] [Google Scholar]
- 58.Park CY, Choi YS, McManus MT. Analysis of microRNA knockouts in mice. Hum. Mol. Genet. 2010;19:R169–175. doi: 10.1093/hmg/ddq367. [DOI] [PMC free article] [PubMed] [Google Scholar]
- 59.Benjamini Y, Hochberg Y. Controlling the false discovery rate: a practical and powerful approach to multiple testing. J. Roy. Stat. Soc. Ser. B. 1995;57:289–300. [Google Scholar]
- 60.Khaitovich P, Hellmann I, Enard W, Nowick K, Leinweber M, Franz H, Weiss G, Lachmann M, Paabo S. Parallel patterns of evolution in the genomes and transcriptomes of humans and chimpanzees. Science. 2005;309:1850–1854. doi: 10.1126/science.1108296. [DOI] [PubMed] [Google Scholar]
- 61.Brawand D, Soumillon M, Necsulea A, Julien P, Csardi G, Harrigan P, Weier M, Liechti A, Aximu-Petri A, Kircher M, et al. The evolution of gene expression levels in mammalian organs. Nature. 2011;478:343–348. doi: 10.1038/nature10532. [DOI] [PubMed] [Google Scholar]
- 62.Hu HY, Guo S, Xi J, Yan Z, Fu N, Zhang X, Menzel C, Liang H, Yang H, Zhao M, et al. MicroRNA expression and regulation in human, chimpanzee, and macaque brains. PLoS Genet. 2011;7:e1002327. doi: 10.1371/journal.pgen.1002327. [DOI] [PMC free article] [PubMed] [Google Scholar]
- 63.Hammell M. Computational methods to identify miRNA targets. Semin. Cell Dev. Biol. 2010;21:738–744. doi: 10.1016/j.semcdb.2010.01.004. [DOI] [PMC free article] [PubMed] [Google Scholar]
- 64.Alexiou P, Maragkakis M, Papadopoulos GL, Reczko M, Hatzigeorgiou AG. Lost in translation: an assessment and perspective for computational microRNA target identification. Bioinformatics. 2009;25:3049–3055. doi: 10.1093/bioinformatics/btp565. [DOI] [PubMed] [Google Scholar]
- 65.Ritchie W, Flamant S, Rasko JEJ. Predicting microRNA targets and functions: traps for the unwary. Nat. Methods. 2009;6:397–398. doi: 10.1038/nmeth0609-397. [DOI] [PubMed] [Google Scholar]
- 66.Schadt EE, Lamb J, Yang X, Zhu J, Edwards S, GuhaThakurta D, Sieberts SK, Monks S, Reitman M, Zhang C, et al. An integrative genomics approach to infer causal associations between gene expression and disease. Nat. Genet. 2005;37:710–717. doi: 10.1038/ng1589. [DOI] [PMC free article] [PubMed] [Google Scholar]
- 67.Wolf YI, Novichkov PS, Karev GP, Koonin EV, Lipman DJ. The universal distribution of evolutionary rates of genes and distinct characteristics of eukaryotic genes of different apparent ages. Proc. Natl Acad. Sci. USA. 2009;106:7273–7280. doi: 10.1073/pnas.0901808106. [DOI] [PMC free article] [PubMed] [Google Scholar]
- 68.Mukherji S, Ebert MS, Zheng GXY, Tsang JS, Sharp PA, van Oudenaarden A. MicroRNAs can generate thresholds in target gene expression. Nat. Genet. 2011;43:854–859. doi: 10.1038/ng.905. [DOI] [PMC free article] [PubMed] [Google Scholar]
- 69.Drummond DA, Wilke CO. Mistranslation-induced protein misfolding as a dominant constraint on coding-sequence evolution. Cell. 2008;134:341–352. doi: 10.1016/j.cell.2008.05.042. [DOI] [PMC free article] [PubMed] [Google Scholar]
- 70.Roux J, Robinson-Rechavi M. Developmental constraints on vertebrate genome evolution. PLoS Genet. 2008;4:e1000311. doi: 10.1371/journal.pgen.1000311. [DOI] [PMC free article] [PubMed] [Google Scholar]
- 71.Gout J-F, Kahn D, Duret L. Paramecium Post-Genomics, C. The relationship among gene expression, the evolution of gene dosage, and the rate of protein evolution. PLoS Genet. 2010;6:e1000944. doi: 10.1371/journal.pgen.1000944. [DOI] [PMC free article] [PubMed] [Google Scholar]
- 72.Shen Y, Lv Y, Huang L, Liu W, Wen M, Tang T, Zhang R, Hungate E, Shi S, Wu C-I. Testing hypotheses on the rate of molecular evolution in relation to gene expression using microRNAs. Proc.Natl Acad. Sci. USA. 2011;108:15942–15947. doi: 10.1073/pnas.1110098108. [DOI] [PMC free article] [PubMed] [Google Scholar]
- 73.Yu Z, Jian Z, Shen S-H, Purisima E, Wang E. Global analysis of microRNA target gene expression reveals that miRNA targets are lower expressed in mature mouse and Drosophila tissues than in the embryos. Nucleic Acids Res. 2007;35:152–164. doi: 10.1093/nar/gkl1032. [DOI] [PMC free article] [PubMed] [Google Scholar]
- 74.Sood P, Krek A, Zavolan M, Macino G, Rajewsky N. Cell-type-specific signatures of microRNAs on target mRNA expression. Proc. Natl Acad. Sci. USA. 2006;103:2746–2751. doi: 10.1073/pnas.0511045103. [DOI] [PMC free article] [PubMed] [Google Scholar]
- 75.Sandberg R, Neilson JR, Sarma A, Sharp PA, Burge CB. Proliferating cells express mRNAs with shortened 3′ untranslated regions and fewer microRNA target sites. Science. 2008;320:1643–1647. doi: 10.1126/science.1155390. [DOI] [PMC free article] [PubMed] [Google Scholar]
- 76.Farre D, Bellora N, Mularoni L, Messeguer X, Alba MM. Housekeeping genes tend to show reduced upstream sequence conservation. Genome Biol. 2007;8:R140. doi: 10.1186/gb-2007-8-7-r140. [DOI] [PMC free article] [PubMed] [Google Scholar]
Associated Data
This section collects any data citations, data availability statements, or supplementary materials included in this article.