Abstract
Phosphorylation of the histone variant H2AX forms γ-H2AX that marks DNA double-strand break (DSB). Here, we generated the sequencing-based maps of H2AX and γ-H2AX positioning in resting and proliferating cells before and after ionizing irradiation. Genome-wide locations of possible endogenous and exogenous DSBs were identified based on γ-H2AX distribution in dividing cancer cells without irradiation and that in resting cells upon irradiation, respectively. γ-H2AX-enriched regions of endogenous origin in replicating cells included sub-telomeres and active transcription start sites, apparently reflecting replication- and transcription-mediated stress during rapid cell division. Surprisingly, H2AX itself, prior to phosphorylation, was specifically located at these endogenous hotspots. This phenomenon was only observed in dividing cancer cells but not in resting cells. Endogenous H2AX was concentrated on the transcription start site of actively transcribed genes but was irrelevant to pausing of RNA polymerase II (pol II), which precisely coincided with γ-H2AX of endogenous origin. γ-H2AX enrichment upon irradiation also coincided with actively transcribed regions, but unlike endogenous γ-H2AX, it extended into the gene body and was not specifically concentrated on the pausing site of pol II. Sub-telomeres were less responsive to external DNA damage than to endogenous stress. Our findings provide insight into DNA repair programs of cancer and may have implications for cancer therapy.
INTRODUCTION
Double-strand breaks (DSBs) initiate a rapid and highly coordinated series of molecular events triggering DNA damage repair. One of the earliest of such events includes the formation of γ-H2AX by phosphorylation of the serine residue 139 of histone H2AX (1–3). γ-H2AX generates a chromosomal microenvironment that facilitates recruitment of DNA repair proteins by spreading along the chromosome up to 1∼2 Mb from the damaged site. However, little is known about the differential distribution of H2AX throughout the genome in different cellular states.
Cellular demand for DNA repair correlates with the cell's potential to replicate. For example, with no more need for DNA replication, DNA repair in terminally differentiated cells is globally attenuated and only focused on the transcribed portion of the genome (4). Short-lived blood cells may even have less need for transcript repair (4). One molecular mechanism behind this reduced capacity for DNA repair has recently been suggested (5): a micro RNA species is up-regulated during hematopoietic cell differentiation and binds the H2AX mRNA to repress its translation, which renders the differentiated blood cells sensitive to irradiation.
On the other extreme is rapidly dividing cells such as cancer. Activated oncogenes result in the continuous formation of endogenous DSBs (6) due to increased replication stress (7,8). Sub-telomeres are prone to the replication-mediated DSBs (9). In cancer cells, DNA hyper-replication can also induce the stalling and collapse of replication forks, which in turn leads to DSB formation (10,11). Increased formation of DSBs brings about a high demand for DNA damage response. Activated DNA repair response, as represented by H2AX phosphorylation, was observed in both precancerous and cancer cells (12,13).
Increased DSBs and activated DNA repair pathway in proliferating cells could be demonstrated by γ-H2AX formation. However, how the substrate molecule H2AX is regulated at the transcription level and during chromatin packaging is completely unknown. If more H2AX molecules are newly synthesized, where should they be deposited on the genome for efficient protection from endogenous DSBs? While the genome-wide location of γ-H2AX has been profiled (14,15), the precise distribution of H2AX itself is still unknown. If there is no further synthesis of H2AX, how could the phosphorylation of existing H2AX contribute to DNA repair? These were the questions we attempted to address in this study.
MATERIALS AND METHODS
Cell preparation and irradiation
To purify resting T cells, CD4+ T lymphocytes were isolated by negative selection with a CD4+ T cell isolation kit. The purity of cells was more than 95% as assessed by FACS analysis. Jurkat (human T-cell lymphoma) cells and HL-60 (human promyelocytic leukaemia) cells were obtained from the American Type Culture Collection (ATCC). Cells were grown as a suspension culture in RPMI-1640 medium supplemented with 10% inactivated fetal bovine serum (Gibco/BRL, USA). Jurkat and CD4+ T ells were exposed to a dose of 10 Gy with a γ irradiator (Gammacell 3000, MDS Nordion Inc., Canada). The irradiated cells were subsequently incubated for 30 min at 37°C after the addition of 20 ml complete RPMI medium.
ChIP-seq and expression data analysis
Chromatin immunoprecipitation (ChIP) was performed using a ChIP assay kit (Millipore, Billerica, MA, USA) according to the manufacturer's protocol. ChIP DNA fragments were sequenced by Illumina Genome Analyzer. The number of sequence tags obtained from each library was provided in Supplementary Table S1. Sequence reads were mapped to the human genome [University of California, Santa Cruz (UCSC) hg18 assembly based on National Center for Biotechnology Information (NCBI) build 36.1] by means of the Illumina sequencing pipeline. The sequencing tags were extended to the average size of fragments in the library (200 bp) and the number of overlapping sequence reads was obtained at 200-bp intervals across the genome. The ratio of (target read count/200 bp)/(total read count/genome size) was obtained and log2 transformed (16). This normalized read count was used as an estimate of nucleosome and pol II level (17) at the given genomic locus. The MACS software (http://liulab.dfci.harvard.edu/MACS/) (18) was used to identify the peaks of sequence reads. For peak finding from each sample, either null control (sample only) or input DNA control was used. For sample comparisons, the two results of interest were compared using one of them as control. For instance, to compare Jurkat H2AX and CD4 H2AX, Jurkat H2AX was run against CD4 H2AX control. Gene expression levels in CD4+ and Jurkat T cells were determined by analyzing published RNA-seq data (19). Genes were divided into two groups according to their expression level (top 10% and lowest 10%). Transcribed regions were defined as 0.5-Mb genomic intervals harbouring five or more genes with moderate or high expression levels. The number of nucleosome peaks was counted in the same intervals. Nucleosome patterns across the genes were obtained by using the CEAS package (20). The ChIP-seq data sets are available in the Gene Expression Omnibus (GEO) database under the accession number GSE25577.
Global gene expression analysis
The DEGseq package in the Bioconductor suite of R software (http://www.bioconductor.org/packages/2.6/bioc/html/DEGseq.html) was used to determine gene expression level from RNA-seq data for CD4+ and Jurkat T cells (GEO accession number GSE16190). For HL-60 gene expression, a public microarray data set (GEO accession number GSE16160) was used. Genes were divided into two groups according to their expression level (top 10% and lowest 10%). A genomic interval of 0.5 Mb was considered as a transcribed region when more than five expressed genes are found. Expressed genes were defined as having expression levels greater than the lowly expressed genes.
Microarray meta-analysis of H2AX expression
The expression of H2AX was explored across many different tumours in comparison with matched normal tissues. The Oncomine™ (Compendia Bioscience, Ann Arbor, MI, USA) database (http://www.oncomine.org/) was used to determine how many data sets indicate the up-regulation of H2AX in cancer versus normal. Top 10% of genes in the given data set were considered differentially expressed and the number of data sets pointing to up- or down-regulation of H2AX was counted. We also used a web database named GENT (http://medical-genome.kribb.re.kr/GENT/), which provides gene expression patterns across more than 34,000 samples that were profiled by Affymetrix U133A or U133plus2 platform.
Measurement of pol II pausing
The pausing index of pol II devised by a previous study (21) was employed and modified for human genes. Specifically, normalized pol II density was calculated as described above and its average was obtained for the region 1 kb upstream to 500 bp downstream of the transcription start site (tss) and the region from 500 bp to the transcript end. The average density of pol II near the gene end was subtracted from the average pol II density near the tss. This differential value served as the pol II pausing index. The percentile of pol II density at the promoter and that of the pol II pausing index were obtained, and genes were grouped according to these percentiles.
RESULTS AND DISCUSSION
Our Oncomine database search shows that H2AX is over-expressed in many clinical cancer samples compared to matched normal samples (Supplementary Figure S1). Another database search (GENT) recalls the overt tendency of H2AX over-expression across many different tumours (Supplementary Figure S2). The transcriptional regulation of H2AX reflects cellular demands for DNA repair. For example, DNA repair in terminally differentiated cells is globally attenuated (4), and one suggested molecular mechanism behind the reduced DNA repair capacity is the repression of H2AX mRNA by a microRNA species (5). The Jurkat cell line, a model for acute T-cell leukaemia, has been compared with normal resting T cells by RNA-seq to understand transcriptomic changes in cancer (19). We observed a >8-fold increase in H2AX expression in Jurkat cells. This may reflect different levels of cellular demand for DNA repair. Indeed, γ-H2AX is detectable by western blotting in Jurkat cells but not in resting T cells without external stimuli (Supplementary Figure S3). Here, we raised a question as to where the induced H2AX proteins would be deposited in the chromatin of the rapidly proliferating genome.
To address this question, we used the ChIP-seq technique to profile the chromosomal distribution of H2AX and compared it with that of γ-H2AX. While H2AX positioning may reflect cellular program for DNA repair, γ-H2AX will serve as a marker for DSBs that are actively occurring. For comparison of normal and dividing cancer cells, we used resting and Jurkat T cells. We also used ionizing irradiation to compare the effects of endogenous and exogenous DNA damage. The experiments, we carried out in this study, are summarized in Table 1.
Table 1.
ChIP-seq performed in this study
| H2AX in CD4 T cells | H2AX deposition into a resting genome |
| γ-H2AX in CD4 T cells after irradiation | γ-H2AX formation upon exogenous DNA damage |
| H2AX in Jurkat T cells (and HL-60 cells) | H2AX deposition into a replicating genome |
| γ-H2AX in Jurkat T cells | γ-H2AX formation upon endogenous DNA damage |
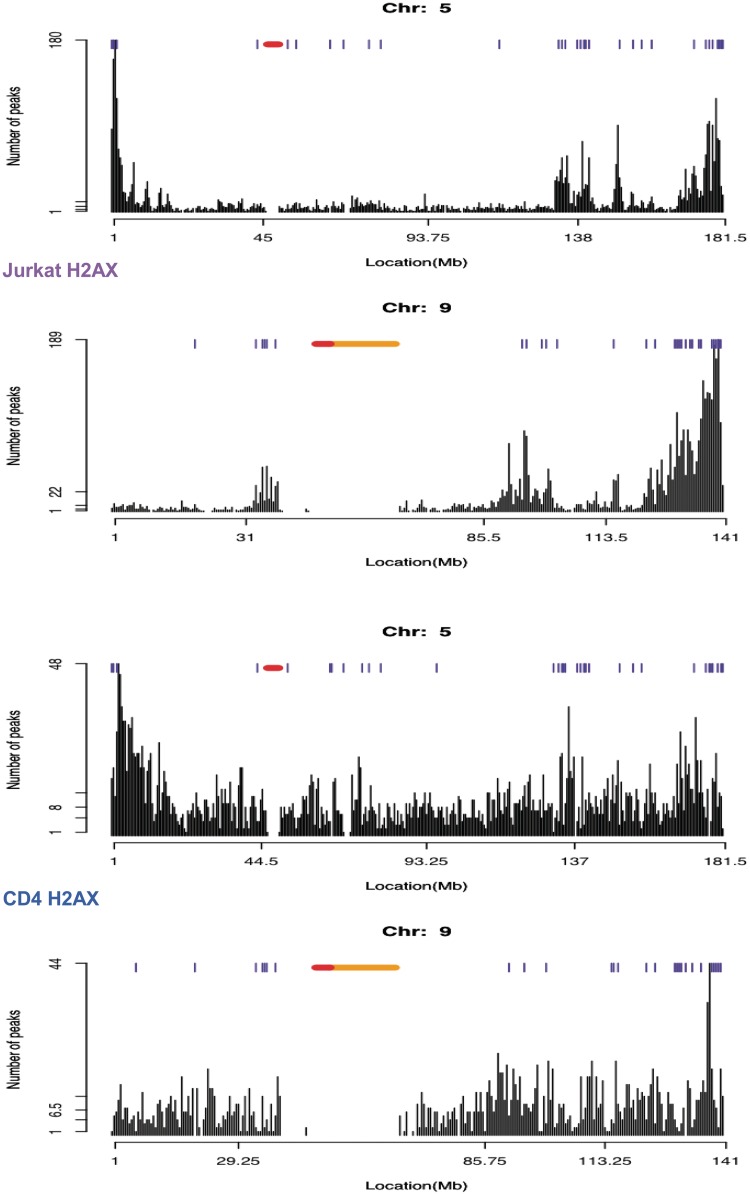
Chromosomal distributions of H2AX in the resting and dividing cancer cells were first compared. The number of identified peaks more than tripled in Jurkat cells even with a lower number of sequencing reads (Supplementary Table S1). The enrichment of the peaks in the individual chromosomes of the replicating genome was mostly found near many chromosomal ends and genomic regions harbouring expressed genes (blue ticks above the plots in Figure 1), in contrast to the relatively random and noisy distribution of resting H2AX without distinct peak clusters (Figure 1 and Supplementary Figures S4 and S5).
Figure 1.
Chromosomal distribution of H2AX in Jurkat T cells. Peak finding was run for H2AX in Jurkat versus the genomic input as control. The number of peaks in 0.5-Mb genomic intervals was plotted. The genomic intervals with five or more expressed genes are marked by blue ticks above the peaks. The annotated centromere and heterochromatin are shown in red and orange, respectively.
When summarized over all chromosomes, the H2AX density of the replicating genome was indeed higher on telomere-adjacent chromatin (violet curve in Figure 2A). A large fraction of the sub-telomeric H2AX was phosphorylated (green curve in Figure 2A). In the resting cells, neither H2AX (blue curve in Figure 2A) nor radiation-induced γ-H2AX (red curve in Figure 2A) showed such sub-telomeric enrichment. The number of peaks in the actively transcribed and non-transcribed regions of the whole genome was compared (Figure 2B). While H2AX in the resting cells showed a slight preference for non-transcribed regions (Figure 2B and Supplementary Figure S6), H2AX and γ-H2AX in the dividing cancer cells were distinctly biased towards transcribed regions (Figure 2B and Supplementary Figures S7 and S8). Radiation-induced γ-H2AX in the resting cells was also more enriched in transcribed regions (Figure 2B and Supplementary Figure S9).
Figure 2.
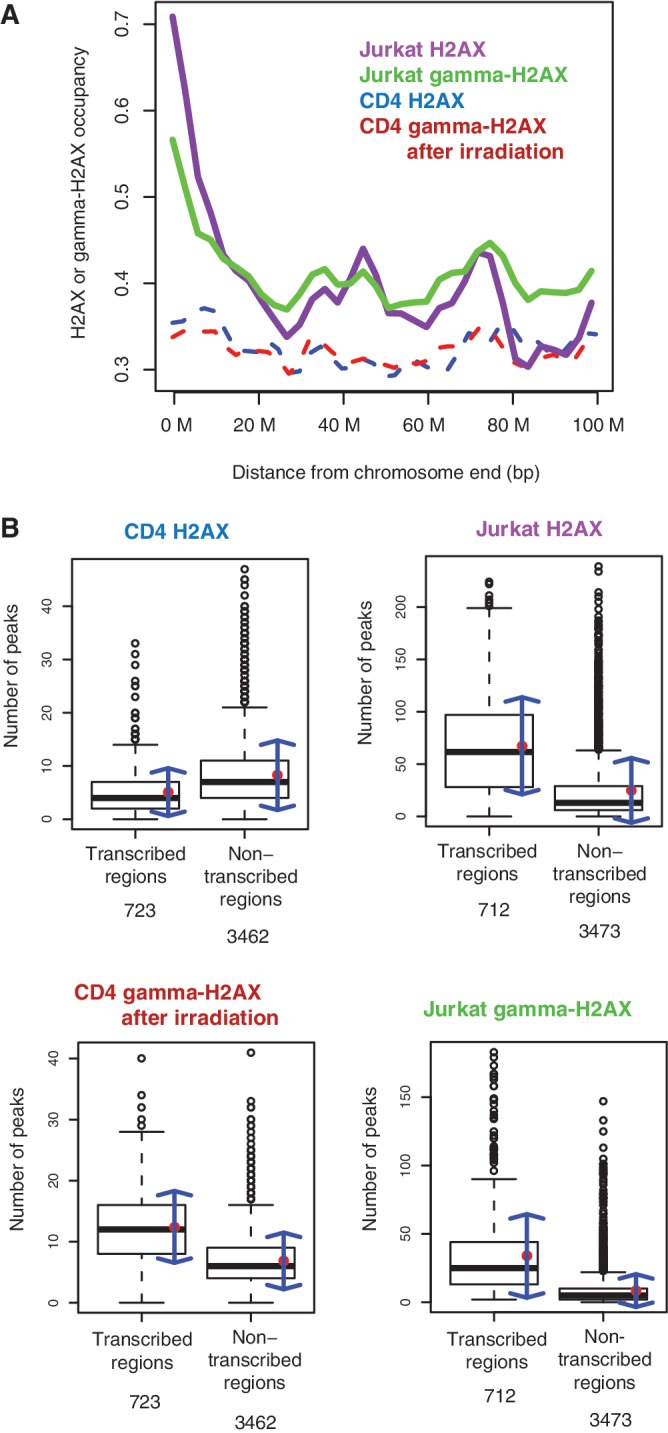
Sub-telomeric and genic distribution of H2AX and γ-H2AX. (A) Histone occupancy as a function of the distance to chromosome ends. Histone occupancy was calculated as the normalized read count (see ‘Materials and Methods’ section). (B) The number of H2AX and γ-H2AX peaks in 0.5 Mb-genomic intervals containing five or more expressed genes (transcribed) and those with less than five (non-transcribed). The numbers of genic and non-genic windows are shown at the bottom. The mean and standard deviation of each group are depicted as the red point and blue arrows.
The positioning patterns of γ-H2AX in Jurkat cells indicate that sub-telomeric and actively transcribed regions are sensitive to endogenous DNA damage. Sub-telomeres are known to be prone to replication-mediated DSBs, particularly due to oncogenic replication stress (10,11). DNA hyper-replication in rapidly dividing cells may cause stalling of replication forks in sub-telomeric regions, resulting in DSB formation (6–9). γ-H2AX enrichment at sub-telomeric regions was observed in growing yeast cells (15,22). The sub-telomeric enrichment of γ-H2A depended on the yeast orthologue of ATM and was distinct from internal γ-H2A formation, which depended mostly on the orthologue of ATR (22). It had been thought that telomeres should be protected from recognition as DSBs to prevent cell cycle arrest but it was recently discovered that telomeres could prevent cell cycle delay without preventing DSB detection (23). However, as demonstrated by the patterns of radiation-induced γ-H2AX, it appears that sub-telomeres are not so sensitive to exogenous DSBs as they are to endogenous DSBs (Figure 2A).
Intriguingly, the sites of spontaneous DSBs were covered by H2AX itself in the dividing caner cells. HL-60 leukaemia cells also showed the sub-telomeric and genic enrichment of H2AX (Supplementary Figure S10), an indication that this phenomenon is not limited to a specific cell type. In the resting cells, there was no such bias of H2AX deposition. It may be that the intensive deposition of H2AX precedes γ-H2AX formation for the repair process of endogenous DSBs in proliferating cells.
Notably, transcribed regions appear to be sensitive to both exogenous and endogenous DSBs. As for exogenous DSBs, transcription-induced open chromatin may sensitize DNA to external stimuli. γ-H2AX accumulation was observed at the sites of stalled transcription bubbles in transcriptionally active regions in response to induced transcriptional stress (24). However, it remains unknown whether this phenomenon can be also observed as a consequence of endogenous transcription stress in dividing cancer cells.
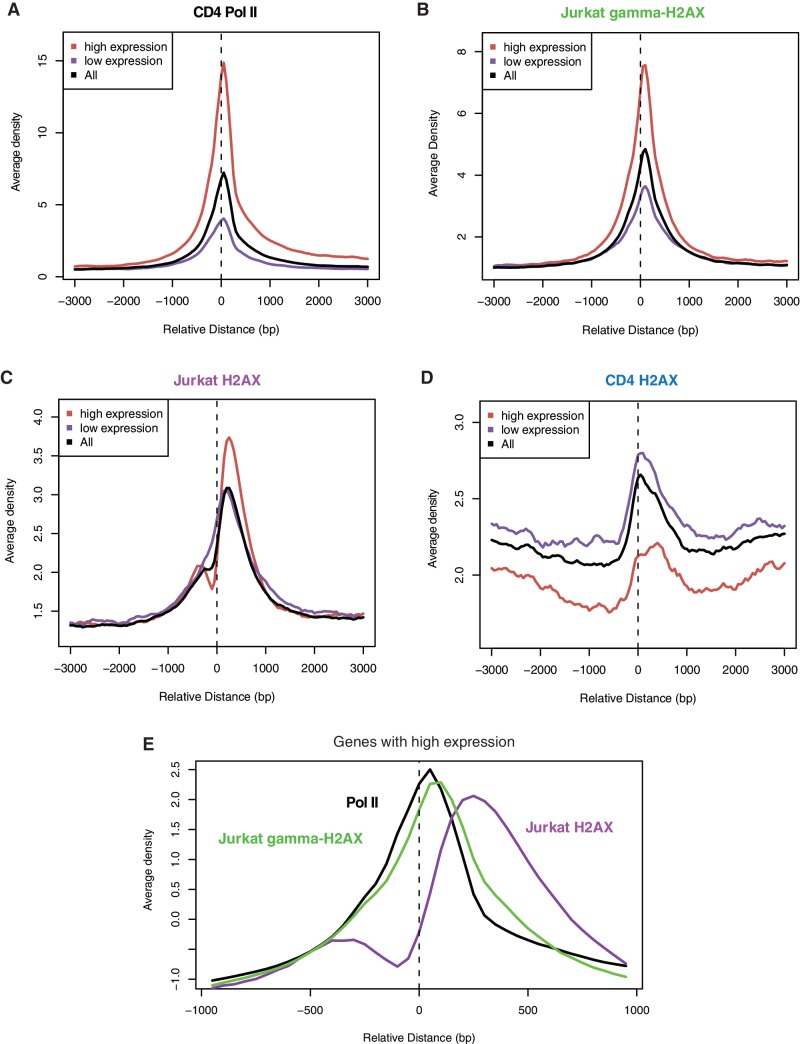
The tss is a major locus of pol II stalling. A pol II pileup that scales with gene expression level is observed at the tss (Figure 3A). γ-H2AX in the dividing cancer cells precisely peaked near the tss especially of actively transcribed genes, recapitulating the pattern of pol II (Figure 3B). Hyper-activated transcription may cause pol II stalling, leading to similar consequences as impeded replication forks at sub-telomeres. This finding conflicts with a previous report whereby promoters are devoid of γ-H2AX (14). However, this measure was based on the relative phosphorylation level (log2 ratio of γ-H2AX over H2AX). Given the above finding that H2AX itself is actively reorganized towards transcribed regions in dividing cancer cells, it is possible that H2AX occupancy, prior to H2AX phosphorylation, is increased at the tss. We observe that this is the case (Figure 3C). Therefore, it may be the increase in the substrate, namely H2AX, than that of phosphorylation levels, that explains γ-H2AX concentration at the tss.
Figure 3.
Transcription-coupled enrichment of H2AX and γ-H2AX without external damage. (A) Pol II density as a function of the distance to the tss of genes with different expression levels in CD4 T cells. (B) γ-H2AX occupancy as a function of the distance to the tss of genes with different expression levels in Jurkat T cells. (C) H2AX occupancy as a function of the distance to the tss of genes with different expression levels in Jurkat T cells. (D) H2AX occupancy as a function of the distance to the tss of genes with different expression levels in CD4 T cells. (E) A zoomed-in plot for pol II, Jurkat H2AX and Jurkat γ-H2AX surrounding the tss of highly expressed genes. (A–E) The plots were generated by means of the CEAS package (http://liulab.dfci.harvard.edu/CEAS/).
H2AX organization around the tss in the replicating genome is noteworthy. The canonical nucleosome and the H2AZ variant typically display the arrangement of −1 nucleosome and nucleosome-free region (NFR) upstream of the tss, and +1 nucleosome stably residing just downstream of the tss (17,25) (Supplementary Figure S11 for the H2A pattern in CD4 T cells). While Jurkat H2AX somehow maintained this ‘−1, NFR, +1’ arrangement, higher levels of H2AX were found with highly expressed genes (Figure 3C). This runs counter to the general property of nucleosome positioning, namely inverse correlations between nucleosome occupancy and gene expression level. H2AX in the resting cells, in contrast, showed the expected correlations with gene expression level (Figure 3D). Therefore, there must be unusual mechanisms operating in dividing cancer cells to recruit H2AX to the site of DSBs generated by the transcription bubble of pol II pausing in face of increased transcription stress. However, unlike γ-H2AX, H2AX in the dividing cancer cells did not precisely coincide with the pausing site of pol II (Figure 3E).
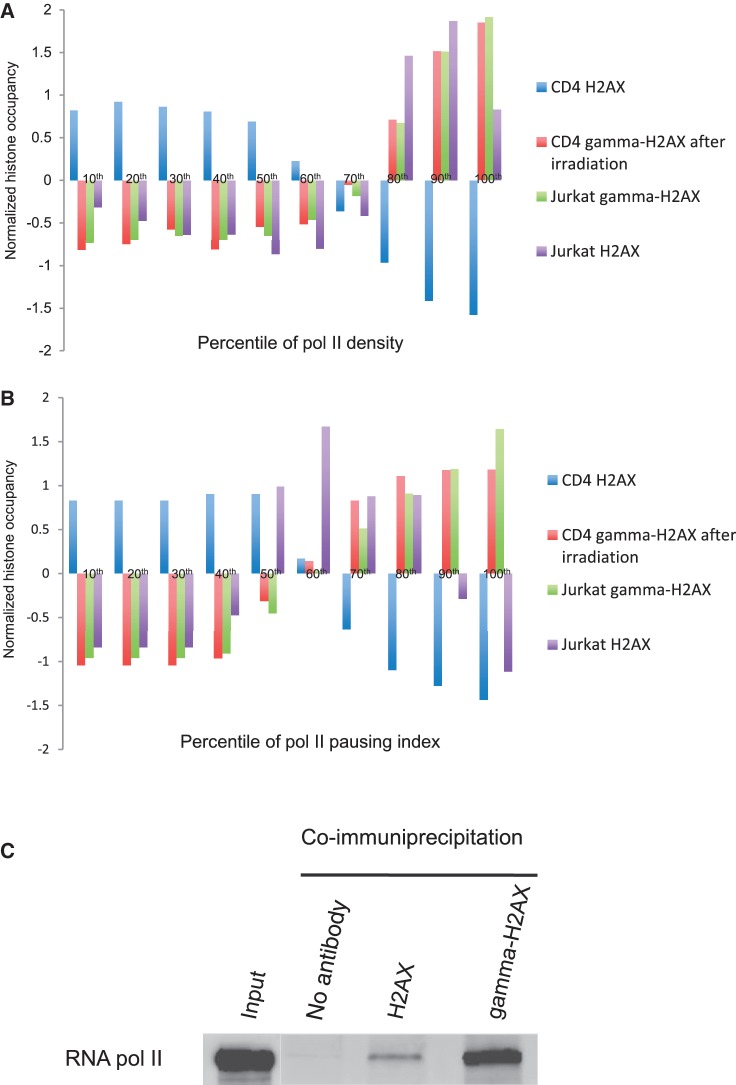
To investigate the relationship between pol II and H2AX, we grouped genes according to the density of pol II or the degree of pol II pausing at the promoter. Endogenous hotspots (seen by γ-H2AX in Jurkat cells) and exogenous hotspots (seen by γ-H2AX in CD4 T cells after irradiation) tightly correlated with pol II density at promoters (Figure 4A). In contrast, γ-H2A and pol II levels in yeast were anti-correlated (15). It may be that DNA damage occurrence in normally growing yeast is independent of transcription activity. H2AX without endogenous stress or external damage (CD4 H2AX) showed a strong inverse correlation (Figure 4A). H2AX under endogenous transcription stress (Jurkat H2AX) peaked at the 80∼90th percentile of pol II promoter occupancy and then slightly declined at the highest pol II density (Figure 4A). Interestingly, Jurkat H2AX showed a different pattern with pol II pausing while the other H2AX and γ-H2AX signals produced the similar patterns as pol II density (Figure 4B). Together with Figure 3E, this suggests that pol II pausing can be a direct cause of γ-H2AX formation but not be directly related to H2AX recruitment. We conclude that H2AX deposition with regards to endogenous DSBs is associated with pol II density but not with pol II pausing. The co-localization of H2AX and pol II was weaker than that of γ-H2AX and pol II in Jurkat cells (Figure 4C).
Figure 4.
Co-localization of H2AX and γ-H2AX with pol II. (A–B) The average occupancy of endogenous and exogenous H2AX and γ-H2AX was calculated for the promoters (1 kb centred on the tss) with different pol II density (A) or with different pol II pausing (B), which was binned into 10 percentiles. Nucleosome occupancy was calculated based on normalized read counts and re-normalized for comparison. (C) A western blot for pol II against the total protein extract (Input), and the fractions pulled down by blank antibody (No Ab), H2AX antibody and γ-H2AX antibody, respectively. Nuclear proteins were extracted from Jurkat cells.
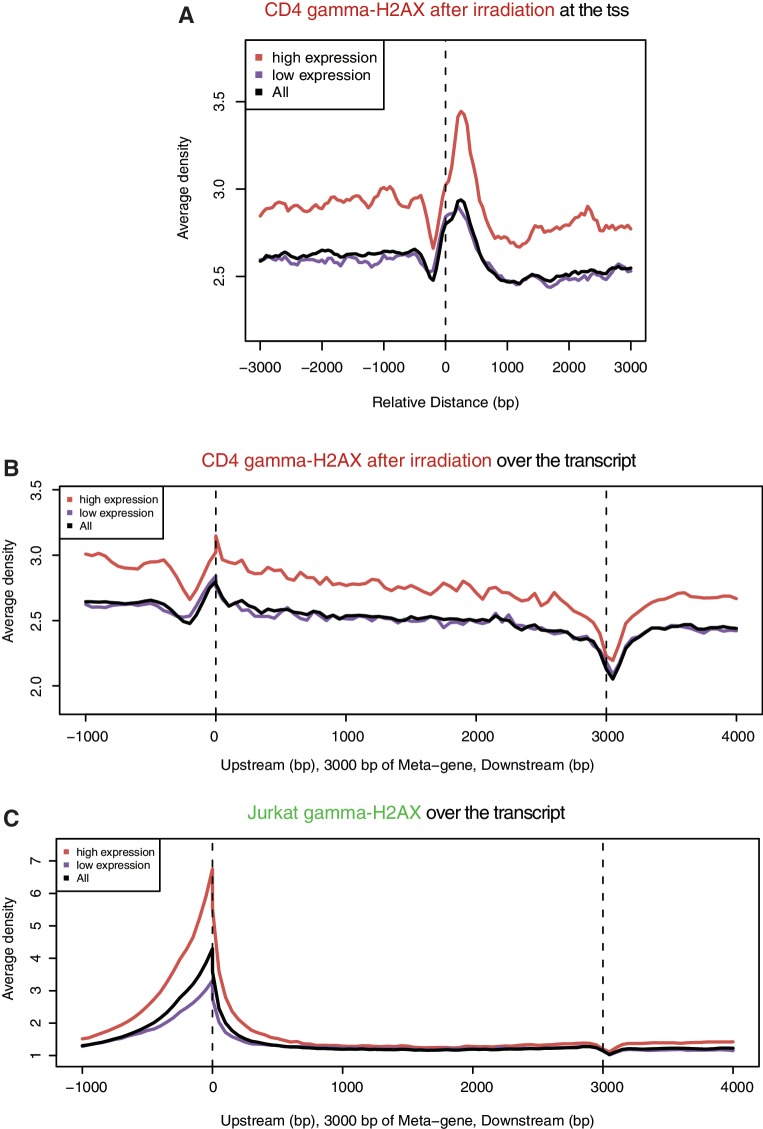
γ-H2AX enrichment in CD4 T cells after irradiation was biased to actively transcribed regions (Figure 2B) in proportion to pol II levels at the promoter (Figure 4A). Although slightly biased to the tss (Figure 5A), the exogenous γ-H2AX sites were extended into the transcript body (Figure 5B) unlike the endogenous hotspots sharply peaked at the tss (Figure 5C). While endogenous DSBs appear to be coupled with pol II pausing at the promoter, exogenous DSBs may simply occur in the accessible region of chromatin. In other words, endogenous and exogenous DSBs seem to arise by different mechanisms in association with transcription processes.
Figure 5.
Gene-wise distribution of γ-H2AX of endogenous and exogenous origin. (A) γ-H2AX upon ionizing irradiation is shown according to the distance from the tss in the same way as in Figure 3. γ-H2AX upon ionizing irradiation (B) and γ-H2AX in proliferating cells (C) were compared across the transcript. The size of the transcript body of all genes in each group (high expression, low expression and all) was scaled to 3 kb for comparison (referred to as Meta-gene by the CEAS package).
In this study, we presented the high-resolution whole-genome distribution of H2AX and γ-H2AX in the human genome. Previously, a major focus was on the level of phosphorylation, i.e. the relative ratio of γ-H2AX over H2AX, based on the assumption that H2AX distribution is not biologically meaningful. In this work, we have taken advantage of next-generation sequencing, which is capable of providing absolute measures of H2AX and γ-H2AX, to discover that the deposition of H2AX itself appeared to be recruited to specific sites. Therefore, H2AX deposition can be a better indicator of endogenous DSB hotspots than H2AX phosphorylation. However, our data should be interpreted with caution as the location of γ-H2AX, in some cases, cannot provide the precise location of DSBs. Further investigation is needed to prove that the sub-telomeric and genic enrichment of γ-H2AX indeed coincides with the actual occurrence of endogenous or exogenous DSBs.
These caveats aside, the specific incorporation of H2AX into chromatin is still intriguing. A major implication of this finding is that cancer cells may reprogram the genomic organization of H2AX so as to cope with increased replication-mediated and transcription-associated DSBs during rapid cell division. In normal cells, H2AX can act as a tumour suppressor by facilitating DNA repair and preventing mutations. Paradoxically, the reprogrammed H2AX positioning in oncogenic cells may promote tumour development by preventing fatal DNA damage. Radiation therapy will not be effective on telomeric regions as they are not prone to external stimuli probably owing to inaccessible chromatin configuration, nor on active promoters as they are already protected by endogenously driven repair activity. The body of actively transcribed genes, however, will be specifically responsive to radiation-induced DNA damage. Further studies based on these findings will shed new light on cancer therapy.
SUPPLEMENTARY DATA
Supplementary Data are available at NAR Online: Supplementary Table 1 and Supplementary Figures 1–11.
FUNDING
Nuclear Research & Development Program 20100017477 by National Research Foundation of Korea (to J.K.); Agency for Science, Technology, and Research (A*STAR) of Singapore (to N.L.M.S., K.V.D. and J.K.C.); Computing facilities 2009-0086964 by National Research Foundation of Korea (to J.K.C.); CHUNG Moon Soul Center of KAIST (to J.K.C.). Funding for open access charge: Agency for Science, Technology, and Research (A*STAR) of Singapore.
Conflict of interest statement. None declared.
Supplementary Material
ACKNOWLEDGEMENT
J.K.C. is a recipient of TJ Park Science Fellowship. The authors thank Sang-Soon Byun for her technical support.
REFERENCES
- 1.Rogakou EP, Pilch DR, Orr AH, Ivanova VS, Bonner WM. DNA double-stranded breaks induce histone H2AX phosphorylation on serine 139. J. Biol. Chem. 1998;273:5858–5868. doi: 10.1074/jbc.273.10.5858. [DOI] [PubMed] [Google Scholar]
- 2.Cook PJ, Ju BG, Telese F, Wang X, Glass CK, Rosenfeld MG. Tyrosine dephosphorylation of H2AX modulates apoptosis and survival decisions. Nature. 2009;458:591–596. doi: 10.1038/nature07849. [DOI] [PMC free article] [PubMed] [Google Scholar]
- 3.Xiao A, Li H, Shechter D, Ahn SH, Fabrizio La, Erdjument-Bromage H, Ishibe-Murakami S, Wang B, Tempst P, Hofmann K, et al. WSTF regulates the H2A.X DNA damage response via a novel tyrosine kinase activity. Nature. 2009;457:57–62. doi: 10.1038/nature07668. [DOI] [PMC free article] [PubMed] [Google Scholar]
- 4.Nouspikel T, Hanawalt PC. DNA repair in terminally differentiated cells. DNA Repair. 2002;1:59–75. doi: 10.1016/s1568-7864(01)00005-2. [DOI] [PubMed] [Google Scholar]
- 5.Lal A, Pan Y, Navarro F, Dykxhoorn DM, Moreau L, Meire E, Bentwich Z, Lieberman J, Chowdhury D. miR-24-mediated downregulation of H2AX suppresses DNA repair in terminally differentiated blood cells. Nat. Struct. Mol. Biol. 2009;16:492–498. doi: 10.1038/nsmb.1589. [DOI] [PMC free article] [PubMed] [Google Scholar]
- 6.Halazonetis TD, Gorgoulis VG, Bartek J. An oncogene-induced DNA damage model for cancer development. Science. 2008;319:1352–1355. doi: 10.1126/science.1140735. [DOI] [PubMed] [Google Scholar]
- 7.Bartkova J, Rezaei N, Liontos M, Karakaidos P, Kletsas D, Issaeva N, Vassiliou LV, Kolettas E, Niforou K, Zoumpourlis VC, et al. Oncogene-induced senescence is part of the tumorigenesis barrier imposed by DNA damage checkpoints. Nature. 2006;444:633–637. doi: 10.1038/nature05268. [DOI] [PubMed] [Google Scholar]
- 8.Di Micco R, Fumagalli M, Cicalese A, Piccinin S, Gasparini P, Luise C, Schurra C, Garre' M, Nuciforo PG, Bensimon A, et al. Oncogene-induced senescence is a DNA damage response triggered by DNA hyper-replication. Nature. 2006;444:638–642. doi: 10.1038/nature05327. [DOI] [PubMed] [Google Scholar]
- 9.Murnane JP. Telomere loss as a mechanism for chromosome instability in human cancer. Cancer Res. 2010;70:4255–4259. doi: 10.1158/0008-5472.CAN-09-4357. [DOI] [PMC free article] [PubMed] [Google Scholar]
- 10.Zschenker O, Kulkarni A, Miller D, Reynolds GE, Granger-Locatelli M, Pottier G, Sabatier L, Murnane JP. Increased sensitivity of subtelomeric regions to DNA double-strand breaks in a human cancer cell line. DNA Repair. 2009;8:886–900. doi: 10.1016/j.dnarep.2009.05.004. [DOI] [PMC free article] [PubMed] [Google Scholar]
- 11.Tsantoulis PK, Kotsinas A, Sfikakis PP, Evangelou K, Sideridou M, Levy B, Mo L, Kittas C, Wu XR, Papavassiliou AG, et al. Oncogene-induced replication stress preferentially targets common fragile sites in preneoplastic lesions. A genome-wide study. Oncogene. 2008;27:3256–3264. doi: 10.1038/sj.onc.1210989. [DOI] [PubMed] [Google Scholar]
- 12.Bartkova J, Horejsí Z, Koed K, Krämer A, Tort F, Zieger K, Guldberg P, Sehested M, Nesland JM, Lukas C, et al. DNA damage response as a candidate anti-cancer barrier in early human tumorigenesis. Nature. 2005;434:864–870. doi: 10.1038/nature03482. [DOI] [PubMed] [Google Scholar]
- 13.Gorgoulis VG, Vassiliou L-VF, Karakaidos P, Zacharatos P, Kotsinas A, Liloglou T, Venere M, Ditullio RA, Kastrinakis NG, Levy B, et al. Activation of the DNA damage checkpoint and genomic instability in human precancerous lesions. Nature. 2005;434:907–913. doi: 10.1038/nature03485. [DOI] [PubMed] [Google Scholar]
- 14.Iacovoni JS, Caron P, Lassadi I, Nicolas E, Massip L, Trouche D, Legube G. High-resolution profiling of γH2AX around DNA double strand breaks in the mammalian genome. EMBO J. 2010;29:1446–1457. doi: 10.1038/emboj.2010.38. [DOI] [PMC free article] [PubMed] [Google Scholar]
- 15.Szilard RK, Jacques P-É, Laramée L, Cheng B, Galicia S, Bataille AR, Yeung M, Mendez M, Bergeron M, Robert F, et al. Systematic identification of fragile sites via genome-wide location analysis of γ-H2AX. Nat. Struct. Mol. Biol. 2010;17:299–305. doi: 10.1038/nsmb.1754. [DOI] [PMC free article] [PubMed] [Google Scholar]
- 16.Choi JK. Contrasting chromatin organization of CpG islands and exons in the human genome. Genome Biol. 2010;11:R70. doi: 10.1186/gb-2010-11-7-r70. [DOI] [PMC free article] [PubMed] [Google Scholar]
- 17.Schones DE, Cui K, Cuddapah S, Roh T-Y, Barski A, Wang Z, Wei G, Zhao K. Dynamic regulation of nucleosome positioning in the human genome. Cell. 2008;132:887–898. doi: 10.1016/j.cell.2008.02.022. [DOI] [PMC free article] [PubMed] [Google Scholar]
- 18.Zhang Y, Liu T, Meyer C, Eeckhoute J, Johnson D, Bernstein B, Nusbaum C, Myers R, Brown M, Li W, et al. Model-based analysis of ChIP-Seq (MACS) Genome Biol. 2008;9:R137. doi: 10.1186/gb-2008-9-9-r137. [DOI] [PMC free article] [PubMed] [Google Scholar]
- 19.Chepelev L, Wei G, Tang Q, Zhao K. Detection of single nucleotide variations in expressed exons of the human genome using RNA-Seq. Nucleic Acids Res. 2009;37:e106. doi: 10.1093/nar/gkp507. [DOI] [PMC free article] [PubMed] [Google Scholar]
- 20.Shin H, Liu T, Manrai AK, Liu XS. CEAS: cis-regulatory element annotation system. Bioinformatics. 2009;25:2605–2606. doi: 10.1093/bioinformatics/btp479. [DOI] [PubMed] [Google Scholar]
- 21.Gilchrist DA, Santos GD, Fargo DC, Xie B, Gao Y, Li L, Adelman K. Pausing of RNA polymerase II disrupts DNA-specified nucleosome organization to enable precise gene regulation. Cell. 2010;143:540–551. doi: 10.1016/j.cell.2010.10.004. [DOI] [PMC free article] [PubMed] [Google Scholar]
- 22.Kitada T, Schleker T, Sperling AS, Xie W, Gasser SM, Grunstein M. γH2A is a component of yeast heterochromatin required for telomere elongation. Cell Cycle. 2011;10:293–300. doi: 10.4161/cc.10.2.14536. [DOI] [PMC free article] [PubMed] [Google Scholar]
- 23.Carneiro T, Khair L, Reis CC, Borges V, Moser BA, Nakamura TM, Ferreira MG. Telomeres avoid end detection by severing the checkpoint signal transduction pathway. Nature. 2010;467:228–232. doi: 10.1038/nature09353. [DOI] [PMC free article] [PubMed] [Google Scholar]
- 24.Mischo HE, Hemmerich P, Grosse F, Zhang S. Actinomycin D induces histone gamma-H2AX foci and complex formation of gamma-H2AX with Ku70 and nuclear DNA helicase II. J. Biol. Chem. 2005;280:9586–9594. doi: 10.1074/jbc.M411444200. [DOI] [PubMed] [Google Scholar]
- 25.Mavrich TN, Jiang C, Ioshikhes IP, Li X, Venters BJ, Zanton SJ, Tomsho LP, Qi J, Glaser RL, Schuster SC, et al. Nucleosome organization in the Drosophila genome. Nature. 2008;453:358–362. doi: 10.1038/nature06929. [DOI] [PMC free article] [PubMed] [Google Scholar]
Associated Data
This section collects any data citations, data availability statements, or supplementary materials included in this article.


