Abstract
Purpose
To determine the repeatability of real-time optical coherence tomography (OCT) measurements of tear film thickness (TFT) and variables of tear film menisci.
Methods
Forty eyes were imaged with a custom-built, real-time OCT to obtain heights, curvatures, and cross-sectional areas of upper and lower tear menisci simultaneously. The central TFT was indirectly determined as the difference between the combined thickness of the central cornea and tear film and the true corneal thickness obtained after instillation of artificial tears. Dynamic tear distribution was determined by OCT imaging immediately and 5, 20, 40, and 60 minutes after tear instillation. Measurements taken after two blinks of one eye at each visit were repeated on the next day. Measurements from the companion eye were made on separate days.
Results
There were no significant differences between the two measurements of each variable made on consecutive days. At baseline, upper tear meniscus variables were strongly correlated with the comparable lower meniscus variables. However, there were no significant correlations between TFT and any tear meniscus variable. Immediately after instillation of artificial tears, all measured variables increased significantly. TFT, upper and lower menisci heights, and upper meniscus area remained elevated for at least 5 minutes. In addition there were significant correlations between TFT and the lower tear meniscus height and area.
Conclusions
The custom-built OCT showed good repeatability and holds promise in measuring the dynamic distribution of artificial tears on the ocular surface.
Tear volumes and distributions are maintained in a dynamic balance throughout the cycle of tear secretion to loss. Any abnormality in this tear cycle may cause dysfunction and compromise the tear film integrity, potentially causing ocular discomfort and disease.1–3 Artificial tears are commonly used to compensate for tear inadequacy, so that the ocular surface is protected. Simultaneous measurements of the dimensions of the tears are extremely difficult, and to the best of our knowledge, no method has been developed to quantify the dynamics of tear distribution. The goal of this study was to determine the repeatability of measuring changes in central tear film thickness (TFT) and tear menisci after instillation of artificial tears. This goal was achieved by our custom-built, real-time optical coherence topographer (OCT).
Subjects and Methods
After the study was approved by the research review board of the University of Rochester, 20 healthy participants (13 women and 7 men, mean ± SD age: 40.5 ± 14.1 years), with no history of contact lens wear and any current ocular or systemic diseases, were enrolled in this prospective study. Informed consent was obtained from each subject, and each was treated in accordance with the tenets of the Declaration of Helsinki.
At each visit, one eye of each subject was imaged for two normal blinks using real-time OCT. After baseline imaging, artificial tears (35 µL, Refresh Liquigel; Allergan, Irvine, CA) were instilled into the eye, and OCT imaging followed immediately at t = 0. On the following day at the same time, the procedure was repeated. The other eye was similarly tested, so that each subject had four visits to test both eyes. OCT imaging was repeated at t = 5, 20, 40, and 60 minutes after instillation.
The OCT was custom built as described in our previous study,4 and similar descriptions can be found in other studies.5,6 Briefly, the OCT light source was 1310 nm with a bandwidth of 60 nm. It was connected to a telecentric optical probe with a maximum 15-mm scanning width at up to eight frames per second. The probe was mounted on a standard slit lamp with a digital video system. The viewing system of the slit lamp facilitated positioning scan locations on the cornea. As the subjects looked at an external target, they were exposed only to ambient room light. Because of the long wavelength of the incident OCT light, it was not visible to the subjects. OCT settings were similar to those described in our previous study.4 A vertical optical section crossing the central cornea and eyelids was taken continuously while a specular reflex was present in the OCT images. The entire scanned image was 960 pixels (12 mm) in width and 384 pixels (2.0 mm) in depth in air. The axial interval between two image pixels was 3.7 µm, assuming a group corneal refractive index of 1.389 with 1310-nm light.7
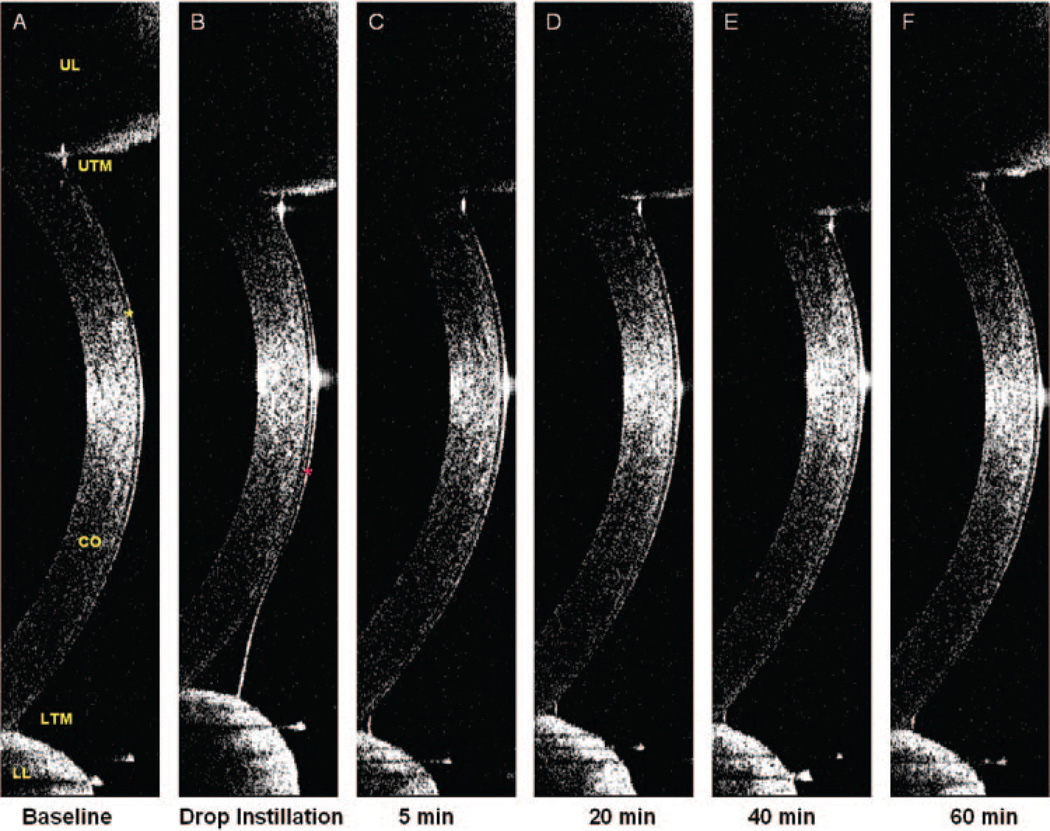
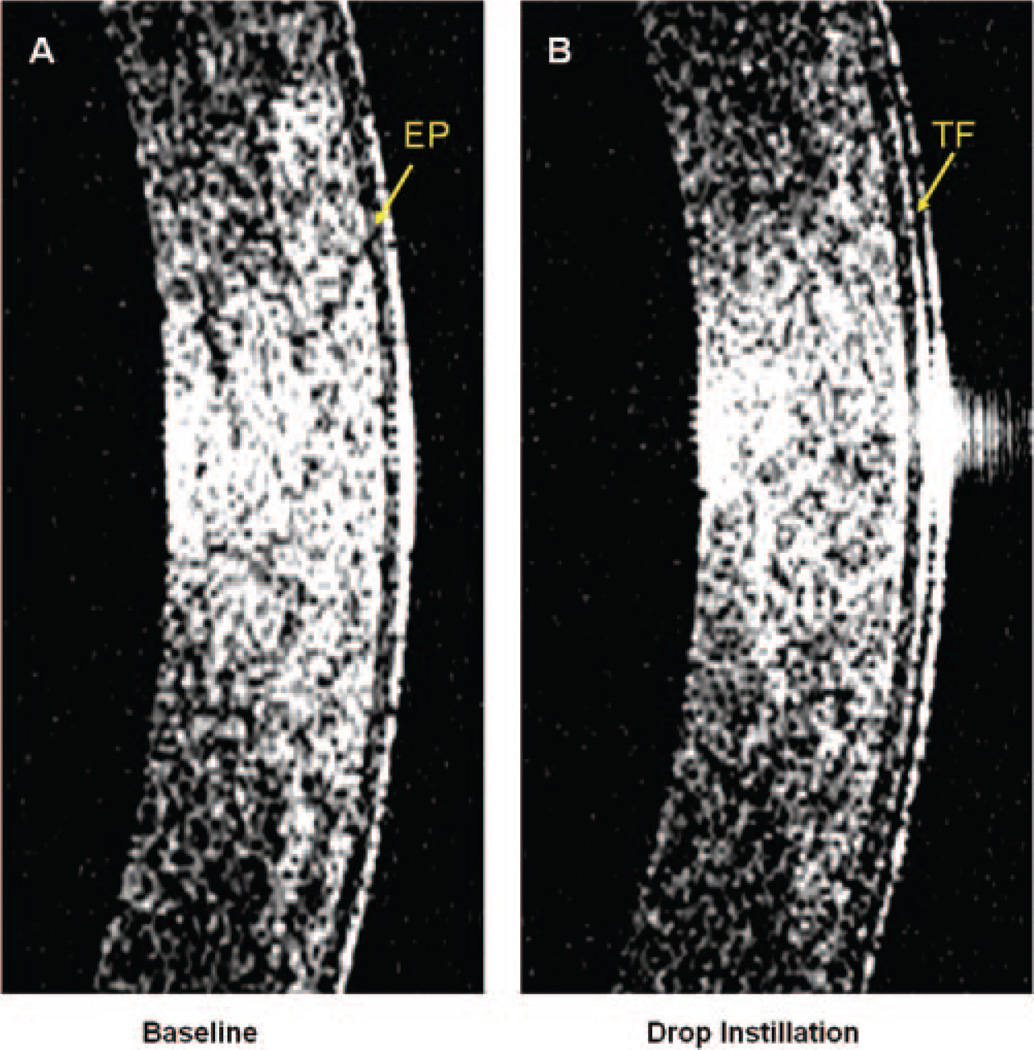
Custom software was used to process OCT images to yield all variables. To avoid the distortion of the central specular hyperreflective reflex of each image, the central 30 axial scans (0.39 mm width) were removed. After that, the central 21 axial scans of eight consecutive images immediately after blinking were processed to yield OCT longitudinal reflectivity profiles from corneal inner side to the outer side. The peak location of the OCT longitudinal reflectivity profile was used to locate the inner and outer borders, similar to that used in many previous studies by us and others.8,9 Total thickness of the cornea and tear film was defined as the distance between the first and last peaks. True corneal thickness was defined as the distance between the first and last second peaks. The TFT was obtained by subtracting the corneal thickness without tear film measured after the instillation of artificial tears (Fig. 1B) from the total thickness, with tear film measured at baseline and 5, 20, 40, and 60 minutes (Figs. 1A, 1C–F). The interface between the epithelium and artificial tears was clearly visualized in high-magnification images (Fig. 2B). TFT immediately after the instillation was obtained directly as the distance between last two peaks in OCT longitudinal reflectivity profiles. Immediately after the subject blinked, the first good image of the first eight images showing both the upper and lower tear menisci was processed to obtain six variables: upper tear meniscus radius of curvature (UTMC), height (UTMH), and cross-sectional area (UTMA) and lower tear meniscus radius of curvature (LTMC), height (LTMH), and cross-sectional area (LTMA).
Figure 1.
Tear film and tear menisci. A vertical 12-mm OCT scan was performed immediately after a full blink at each time point. In images (A–F), the cornea (CO), corneal epithelium (A, yellow star), upper eyelid (UL), and lower eyelid (LL) with upper (UTM) and lower (LTM) tear menisci were clearly visualized. The tear film at baseline (A) was too thin to be visualized, and the thickness of the cornea plus the tear film was 498.6 µm. (B) Immediately after instillation of 35 µL of artificial tears, a significant increase in TFT and tear menisci occurred. The tear film (marked as red star) was visualized, and the TFT was 30.8 µm. After the instillation of artificial tears, the interface between the tears and cornea was clearly evident, allowing determination of the corneal thickness. The baseline TFT was calculated by subtracting the corneal thickness, without tear film, in (B) from the total thickness, including the tear film, in (A). The thickness of the cornea in (B) was 492.8 µm. Therefore, the thickness of the baseline tear film in (A) was 5.8 µm. Similar calculations were performed to yield TFT at 5, 20, 40, and 60 minutes.
Figure 2.
High-magnification images obtained with OCT. The central portions of the images shown in Figures 1A and 1B, showing the epithelium (EP) and the interface between the tear film (TF) and epithelium.
Results
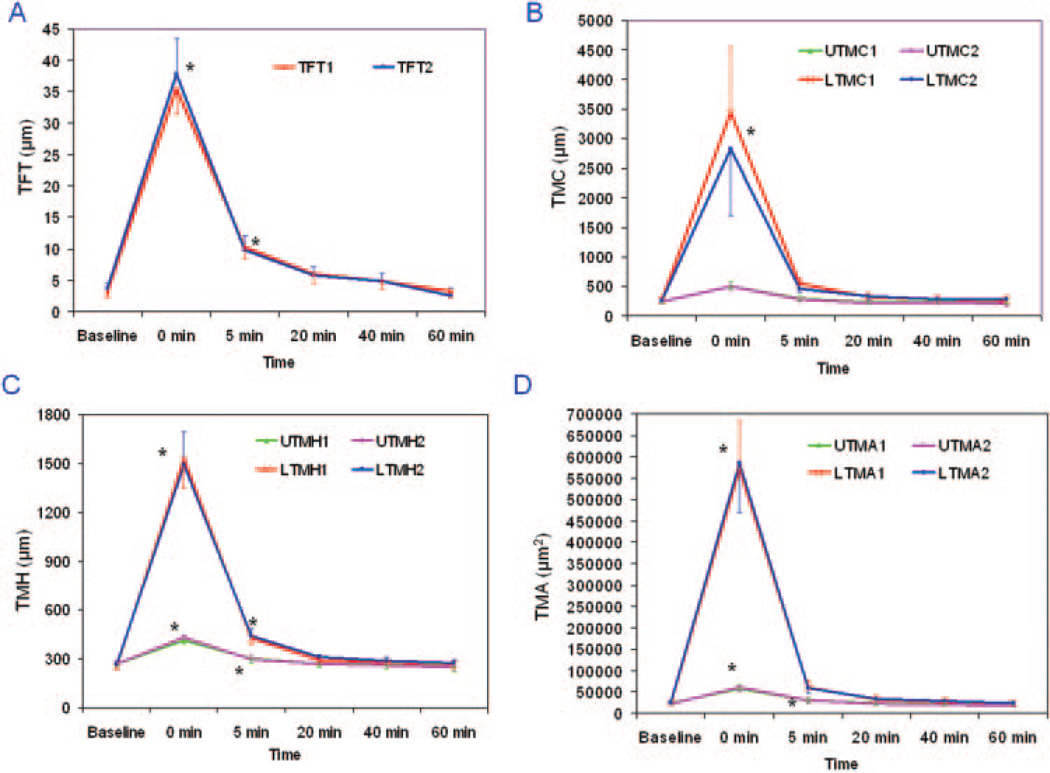
Immediately after instillation of the artificial tears at t = 0, all measured parameters increased significantly (Re-ANOVA, P < 0.01, Table 1, Figs. 1–4). At t = 5 minutes, TFT, UTMH, LTMH, and UTMA remained significantly elevated compared with the baseline values (post hoc tests, P < 0.001). None of the variables differed significantly between the two repeated measurements made on separate days (Re-ANOVA, P > 0.05). The average difference between any two repeated measurements was 1% and ranged from −10% to 12% (Table 1, Fig. 3). The increased values after artificial tear instillation were greater for the lower tear meniscus variables than the upper tear meniscus variables (paired t-tests, P < 0.05, Fig. 3).
TABLE 1.
Repeated Measurements of Tear Dimensional Variables in 20 Subjects (40 Eyes)
| Variables | Baseline | 0 min | 5 min | 20 min | 40 min | 60 min |
|---|---|---|---|---|---|---|
| TFT1* | 3.2 ± 3.2 | 35.6 ± 13.6 | 10.3 ± 5.8 | 6.0 ± 4.8 | 4.8 ± 3.9 | 3.3 ± 3.9 |
| TFT2† | 3.7 ± 3.2 | 37.9 ± 17.8 | 9.9 ± 6.9 | 5.8 ± 4.7 | 4.9 ± 4.2 | 2.6 ± 3.7 |
| Diff. | −0.5 ± 3.8 | −2.3 ± 13.7 | 0.4 ± 8.0 | 0.2 ± 5.2 | 0.0 ± 5.0 | 0.7 ± 4.5 |
| UTMC1* | 241 ± 152 | 503 ± 267 | 299 ± 160 | 230 ± 90 | 238 ± 137 | 235 ± 125 |
| UTMC2† | 237 ± 112 | 501 ± 274 | 284 ± 128 | 220 ± 78 | 231 ± 111 | 205 ± 115 |
| Diff. | −4 ± 145 | −2 ± 303 | −15 ± 146 | −10 ± 85 | −8 ± 147 | −30 ± 128 |
| LTMC1* | 269 ± 211 | 3434 ± 2736 | 552 ± 455 | 324 ± 264 | 283 ± 182 | 259 ± 196 |
| LTMC2† | 250 ± 129 | 2825 ± 3610 | 466 ± 230 | 331 ± 214 | 285 ± 196 | 277 ± 245 |
| Diff. | −19 ± 173 | −609 ± 4022 | −87 ± 420 | 7 ± 261 | 2 ± 215 | 17 ± 233 |
| UTMH1* | 268 ± 76 | 413 ± 113 | 300 ± 82 | 269 ± 68 | 263 ± 72 | 259 ± 69 |
| UTMH2† | 268 ± 78 | 431 ± 137 | 297 ± 79 | 270 ± 76 | 257 ± 69 | 251 ± 90 |
| Diff. | 0 ± 71 | 18 ± 119 | −3 ± 82 | 1 ± 60 | −6 ± 75 | −9 ± 85 |
| LTMH1* | 253 ± 89 | 1528 ± 526 | 426 ± 191 | 293 ± 102 | 276 ± 106 | 266 ± 88 |
| LTMH2† | 264 ± 89 | 1491 ± 480 | 438 ± 166 | 310 ± 121 | 287 ± 103 | 272 ± 111 |
| Diff. | 11 ± 88 | −37 ± 502 | 12 ± 181 | 17 ± 109 | 10 ± 121 | 6 ± 99 |
| UTMA1* | 23433 ± 13476 | 58109 ± 32941 | 31061 ± 18124 | 23798 ± 12009 | 21747 ± 11208 | 21929 ± 11431 |
| UTMA2† | 22030 ± 12890 | 61195 ± 35607 | 29596 ± 16712 | 21998 ± 12500 | 21033 ± 12248 | 19222 ± 12984 |
| Diff. | −1403 ± 10996 | 3087 ± 29337 | −1465 ± 16562 | −1800 ± 10660 | −714 ± 12891 | −2707 ± 12026 |
| LTMA1* | 23120 ± 15963 | 571507 ± 362190 | 60556 ± 52451 | 31976 ± 26984 | 27822 ± 19330 | 24262 ± 15252 |
| LTMA2† | 24879 ± 16678 | 585277 ± 372287 | 59131 ± 38109 | 33566 ± 22271 | 28095 ± 18370 | 24084 ± 18161 |
| Diff. | 1759 ± 12235 | 13770 ± 379028 | −1425 ± 54387 | 1590 ± 22365 | 272 ± 21275 | −178 ± 17126 |
All variables are measured in micrometers except for UTMCA and LTMCA, which are measured in cubic micrometers.
Mean ± SD for first test of each eye.
Mean ± SD for second test of each eye.
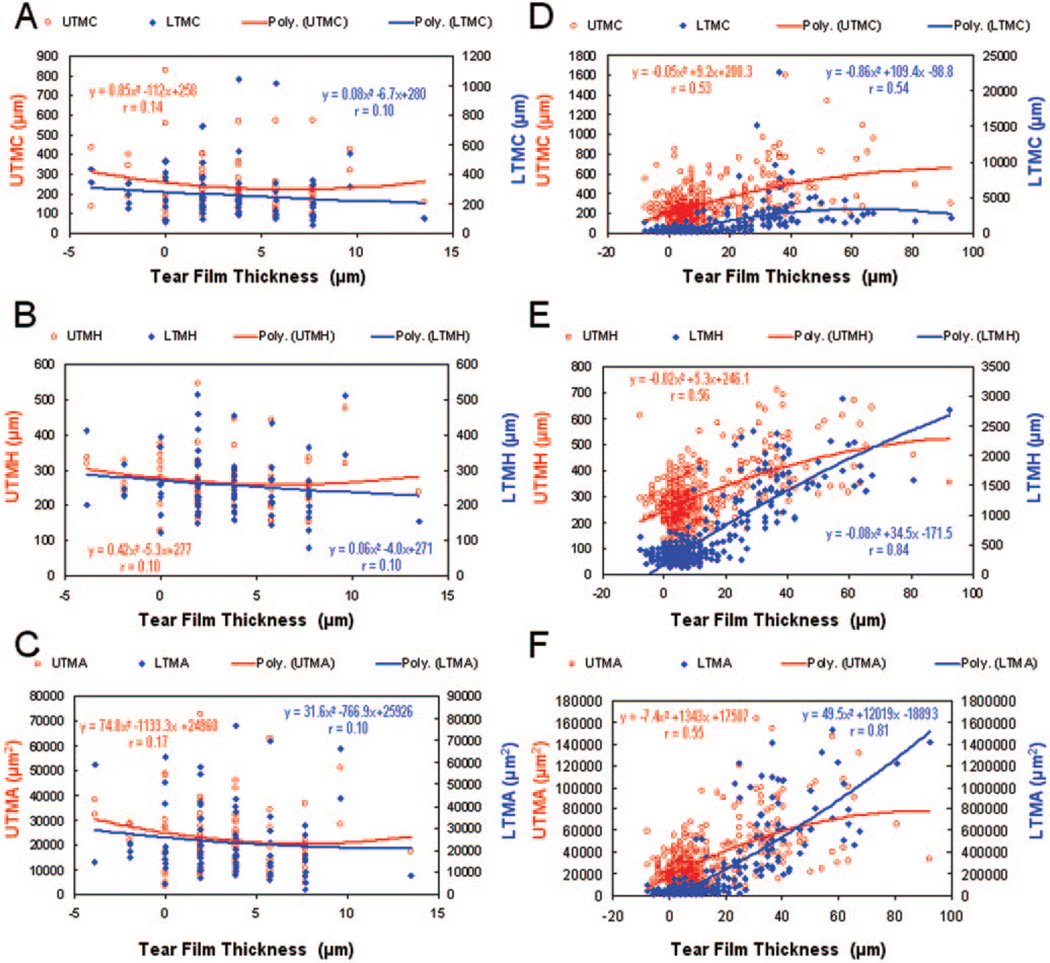
Figure 4.
Correlations between TFT and tear menisci variables before and after instillation of artificial tears. At baseline (A–C) with data from first and second visits, there were no significant correlations between the TFT and any of the tear menisci variables. After instillation of artificial tears with data from all check points at two visits (D–F), the TFT correlated significantly with LTMH and LTMA, whereas other variables showed weak correlations with the TFT. Second-order polynomial regression provided the best fit for these data.
Figure 3.
Repeated measurements of tear dimensional parameters before and after instillation of artificial tears. (A–D) Significant changes in all results at t = 0 minutes. At t = 5 minutes, only TFT, UTMH, LTMH, and UTMA remained significantly elevated over baseline. By t = 20 minutes and afterward, no significant differences were found compared with baseline. Also, there were no significant differences between repeated measurements of any variables. (B–D) The increased values after artificial tear instillation were greater for the lower tear meniscus variables than for the upper tear meniscus variables. *Significant differences between repeated measurements from the baseline. Vertical bars, 95% CI.
For baseline measurements, UTMC and LTMC were strongly correlated as were UTMH with LTMH and UTMA with LTMA. The linear regression r ranged from 0.54 to 0.95 (P < 0.05). However, there was no significant correlation between TFT and any tear menisci values (Fig. 4A–C). After instillation of artificial tears with data from all check points at two visits, the TFT was significantly correlated with LTMH and LTMA (P < 0.05, Figs. 4E–F), whereas other variables showed weak correlations with the TFT (Figs. 4D–F).
Discussion
The relationship between the TFT and tear menisci has been predicted from mathematical models by Creech et al.3 and Wong et al.10 They proposed that tear film formation is based on a coating process of the lower lid meniscus and that there is a critical TFT when the tear breaks up over the cornea. According to their models, the tear thinning process is related to the initial meniscus radius and the initial tear film thickness. However, this has never been verified by the measurement of these variables due to the extreme difficulty of measuring the TFT and the tear menisci in real time. In our study, we did not find a correlation between TFT and tear menisci at baseline. The independence of the TFT from all menisci variables at baseline does not support the mathematical models proposed by Creech et al.3 and Wong et al.10
After the instillation of artificial tears, strong correlations between the TFT and the LTMH and the LTMA were evident. This is probably due to the increased volume of the upper and lower tear menisci, which no doubt contributed to the spreading of the tear film during blinking. The greater volume of tears held by the lower tear meniscus may have been due to gravity and/or possible structural differences. Of interest, the correlations between the TFT and both upper and lower tear menisci were nearly identical as shown in Figures 4 D–F. This may indicate equal contributions to the increase of tear film from upper and lower tear menisci, although the magnitudes of the increases in meniscus variables were significantly different. There may be some limit of the increase in the upper tear meniscus, since we found that UTMH and UTMA stopped rising with the increase of central TFT (Figs. 4D–F). The separate contribution of upper or lower tear menisci to the tear film thickness warrants further studies.
The tears were about equally distributed between the menisci of both eyelids at baseline; however, more were present on the lower lid when extra tears were introduced. Based on the measurements made in our study, tear volumes could be calculated when ocular surface area and lengths of both eyelids were known. Although we did not calculate tear volume in this study, the OCT method provides the potential for estimating volume changes over time in human eyes. Artificial tears supplement natural tears in patients with dry eyes by increasing the TFT of the cornea and tear menisci for periods that vary from one individual to another. However, the dimensional changes and distribution of the tears after instillation of the artificial tears remain unclear and how long the effect lasts remains unknown. There are no validated methods that could be used objectively to evaluate the impact of the supplemental tears on TFT and menisci variables, which makes it more difficult for the development of truly effective artificial tears to improve the tear system. The method used in our study determined the dynamic distribution on the ocular surface after the instillation of the tears. The retention time can be obtained by analyzing the recovery time of all variables representing tear volume and the effects on TFT. In this study, the retention time was between 5 and 20 minutes. Further studies should be performed to compare different artificial tears with control solutions like normal saline and relate the dimensional findings to commonly used clinical tests, such as tear break-up time, ocular comfort, and clinical signs and symptoms of dry eye.
The OCT developed in this study has the following features that are essential for simultaneous measurements of dynamic distribution of tears. Real-time imaging with a wide-scan width (up to 12 mm) enables quick acquisition of multiple images across the upper and lower eye lids. Telecentric design of the probe allows recording of true dimensional information of the tears for precise image processing. Image processing software is essential to analyze multiple axial scans of multiple images to yield precise thickness information. The OCT with approximately 10 µm optical resolution has good repeatability, with variations in measurements of corneal thickness of from approximately 1 µm9 to 4 µm.11,12 In other words, the location of an interface could be found as precise as 1 µm if many scans or measurements were averaged to obtain the total thicknesses with and without tear film. The repeatability of our system was tested in vitro with a set of PMMA lenses and in vivo with a group of human corneas in a short period. The repeatability for the lens measurements was 0.9 µm and that for corneal thickness was 1.5 µm. The interval between two pixels in axial direction for our OCT system is 3.7 µm, which is larger than the thickness of the normal tear film itself. This necessitates making indirect estimates of TFT by determining the corneal thickness after instillation of artificial tears, then subtracting that value from the combined thickness of the cornea and tear film at baseline before addition of the artificial tears. In the future, some improvements will be made to enhance the precision of OCT biometry of tears. The use of an ultra– high-resolution light source would enable direct measurement of TFT and avoid errors caused by calculations. Corneal hydration after the instillation of the tears may introduce measurement error in the indirect measurement of central tear film. We used true corneal thickness obtained immediately after the installation to calculate tear film thickness at any other check points, assuring that corneal thickness remained the same over the study period. The TFT would be thicker than that which we found if corneal hydration occurred shortly after the instillation. The effect (if it occurs) appears to be small, since no difference was found between baseline and 60 minutes in total corneal thickness. Further studies are warranted to investigate from this standpoint.
In summary, a novel method for imaging the tears on ocular surface was developed and used to take highly repeatable measurements of the distribution of artificial tears. OCT holds promise in studying the distribution and retention time of artificial tears. This method may open a new era in characterizing the human tear system to diagnose dry eye and in evaluating dry-eye–related treatments, such as artificial tears and punctual occlusion.
Acknowledgments
Supported by research grants from NEI (EY016420), Bausch & Lomb, Allergan, Rochester/Finger Lakes Eye and Tissue Bank, and Research to Prevent Blindness (JW).
Footnotes
Disclosure: J. Wang, Bausch & Lomb, Allergan (F); J. Aquavella, None; J. Palakuru, None; S. Chung, None
References
- 1.Lemp MA, Holly FJ, Iwata S, Dohlman CH. The precorneal tear film. I. Factors in spreading and maintaining a continuous tear film over the corneal surface. Arch Ophthalmol. 1970;83:89–94. doi: 10.1001/archopht.1970.00990030091017. [DOI] [PubMed] [Google Scholar]
- 2.Pflugfelder SC, Solomon A, Stern ME. The diagnosis and management of dry eye: a twenty-five-year review. Cornea. 2000;19:644–649. doi: 10.1097/00003226-200009000-00009. [DOI] [PubMed] [Google Scholar]
- 3.Creech J, Do L, Fatt I, Radke C. In vivo tear-film thickness determination and implications for tear-film stability. Curr Eye Res. 1998;17:1058–1066. doi: 10.1076/ceyr.17.11.1058.5233. [DOI] [PubMed] [Google Scholar]
- 4.Wang J, Thomas J, Cox I, Rollins A. Noncontact measurements of central corneal epithelial and flap thickness after laser in situ keratomileusis. Invest Ophthalmol Vis Sci. 2004;45:1812–1816. doi: 10.1167/iovs.03-1088. [DOI] [PubMed] [Google Scholar]
- 5.Radhakrishnan S, Rollins AM, Roth JE, et al. Real-time optical coherence tomography of the anterior segment at 1310 nm. Arch Ophthalmol. 2001;119:1179–1185. doi: 10.1001/archopht.119.8.1179. [DOI] [PubMed] [Google Scholar]
- 6.Goldsmith JA, Li Y, Chalita MR, et al. Anterior chamber width measurement by high-speed optical coherence tomography. Ophthalmology. 2005;112:238–244. doi: 10.1016/j.ophtha.2004.09.019. [DOI] [PMC free article] [PubMed] [Google Scholar]
- 7.Lin RC, Shure MA, Rollins AM, Izatt JA, Huang D. Group index of the human cornea at 1.3-micron wavelength obtained in vitro by optical coherence domain reflectometry. Opt Lett. 2004;29:83–85. doi: 10.1364/ol.29.000083. [DOI] [PubMed] [Google Scholar]
- 8.Wang J, Fonn D, Simpson TL, et al. Topographical thickness of the epithelium and total cornea after overnight wear of reverse-geometry rigid contact lenses for myopia reduction. Invest Ophthalmol Vis Sci. 2003;44:4742–4746. doi: 10.1167/iovs.03-0239. [DOI] [PubMed] [Google Scholar]
- 9.Muscat S, McKay N, Parks S, Kemp E, Keating D. Repeatability and reproducibility of corneal thickness measurements by optical coherence tomography. Invest Ophthalmol Vis Sci. 2002;43:1791–1795. [PubMed] [Google Scholar]
- 10.Wong H, Fatt I, Radke C. Deposition and thinning of the human tear film. J Colloid Interface Sci. 1996;184:44–51. doi: 10.1006/jcis.1996.0595. [DOI] [PubMed] [Google Scholar]
- 11.Maldonado MJ, Juberias JR, Rodriguez-Conde R. Corneal flap thickness and tissue laser ablation in myopic LASIK. Ophthalmology. 2002;109:1042–1043. doi: 10.1016/s0161-6420(02)01064-3. [DOI] [PubMed] [Google Scholar]
- 12.Wang J, Fonn D, Simpson TL, Jones L. The measurement of corneal epithelial thickness in response to hypoxia using optical coherence tomography. Am J Ophthalmol. 2002;133:315–319. doi: 10.1016/s0002-9394(01)01382-4. [DOI] [PubMed] [Google Scholar]


