Abstract
Objectives
To demonstrate in vivo molecular imaging of the eye using spectral-domain magnetomotive optical coherence tomography (MMOCT).
Methods
A custom-built, high-speed, and high-resolution MMOCT was developed for imaging magnetic particle–coupled molecules in living mouse eyes by applying an external dynamic magnetic field gradient during optical coherence tomography (OCT) scanning. The magnetomotive signals were tested in vitro by scanning magnetic beads embedded within an agarose gel (1.5%) and in vivo in the anterior segment of a mouse eye.
Results
Cross-sectional OCT images of the gel and the anterior segment of the eye were acquired by regular OCT structural scanning. Magnetomotive optical coherence tomography signals were successfully captured in the agarose gel with embedded magnetic beads. The signals were captured in the anterior segment of the mouse eyes after injecting the beads. The signal was overlaid successfully onto the structural OCT image.
Conclusions
We demonstrated the ability to detect particles injected into the anterior chamber of the mouse eye using MMOCT. This suggests that MMOCT is effective for future live detection of molecular (protein) targets in various ocular diseases in mouse models.
Keywords: OCT, Magnetomotion, Mouse model
Biologic imaging at the molecular and cellular levels is often critical for early detection and diagnosis of diseases. Signals from specific molecules and specific probes can be detected and localized when they exceed a certain threshold above the background.1–4 Light microscopy and histology, which use antibodies and stains, have been the standard method for detection of specific molecular protein targets. With the advancement of optical imaging methods, such as optical coherence tomography (OCT), detection and localization of specific probes in live animals are now possible.2 Such a detection ability could provide a great potential for obtaining morphologic and functional information. Such information will be useful for early diagnosis of diseases in the living tissue. Specific molecular probes targeted to intrinsic pathologic conditions or protein markers could be detected and may serve as diagnostic markers. The biodistribution of these probes can be imaged in vivo in relation to an underlying biologic process.1,5,6 In contrast, other anatomically based imaging modalities, such as computed tomography, magnetic resonance imaging, ultrasound, and structural OCT, are limited by their inability to detect diseases until tissue structural changes are present because they only detect the distortion of the structure caused by the disease. Fluorescent markers have been widely used to couple specific cell receptors, and bioluminescent probes have been used for optical molecular imaging in small animal models.1,5,6 These probes are capable of detecting proteins that play key roles in diseases. They thereby enable the tracking of pathologic development.1,5,6 Other non-fluorescent probes can provide equal benefit by enhancing image contrast. These methods include white light microscopy, reflectance confocal microscopy, and low-coherence, high-depth resolution imaging such as OCT with contrast enhancement.1,7
Magnetomotive optical coherence tomography (MMOCT) is an advanced OCT technique that uses synchronized reorientation of nanomagnetic beads to enhance the OCT imaging contrast. Magnetomotive optical coherence tomography has expanded molecular imaging in the eye and is a technique that has not been previously explored. Magnetic beads coupled with antibodies will enable detection of proteins that are uniquely expressed or significantly upregulated in pathologic conditions. The purpose of this study was to prove the feasibility of the MMOCT technique for molecular imaging of ocular proteins.
INSTRUMENTATION AND METHOD
Instrumentation: Ultrahigh Speed Spectral-Domain MMOCT with Ultrahigh Resolution
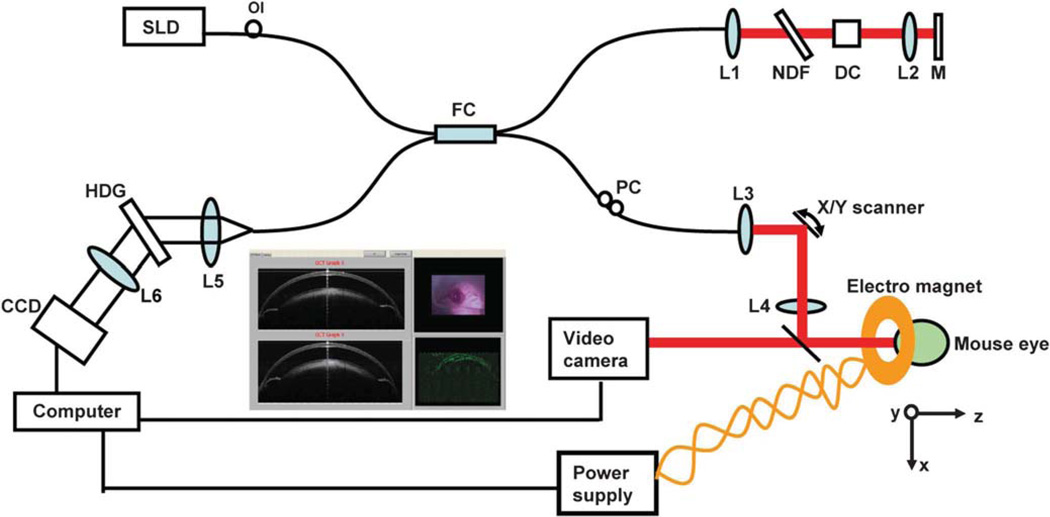
The prototype of the MMOCT (Fig. 1) was based on our previously built high-speed and ultrahigh resolution spectral-domain OCT (SD-OCT) instrument, described in prior studies.8,9 Briefly, a three-module superluminescent diode light source (Broadlighter, T840-HP, Superlumdiodes Ltd., Moscow, Russia) with a center wavelength of 840 nm and a full width at half maximum bandwidth of 100 nm was used. After passing through a fiber pigtailed isolator, the low-coherence light was coupled into a 2 × 2 3-dB fiber coupler (beam splitter), which splits the light into the reference arm and the sample arm. The sample light was transported to a telecentric optical delivery system. The delivery system consisted of an X–Y galvanometer scanner and the optical system. The optical system allows the transport of the sample light into the anterior segment of the eye and also collects the back-reflected sample light. The power of the sample light was lowered to 750 mW by adjusting the source power with a fiber-based pigtail style attenuator to ensure that the light intensity delivered to the eye was safe. In the detection arm, a spectrometer with a line scan charge charge-coupled device (Aviiva-M2-CL-2014, Tarrytown, NY) was used to detect the combined reference and sample light. The scan depth was measured as 3.1 mm in air, and the axial resolution was approximately 3 µm in the tissue, assuming a refractive index of approximately 1.33.
FIG. 1.
View of the magnetomotive optical coherence tomography (MMOCT) system. A broad superluminescent diode was connected to a fiber coupler, which was connected to sample and reference arms. The spectrometer was used to detect light reflected from both arms. Data acquisition was performed on a computer with custom-developed software. During the scanning, the X–Y cross aiming will be used for proper alignment with the aid of a video camera, and the magnetic signal in 2D is displayed (inset). An electric magnetic coil is powered by a DC power supply to generate a magnetic field, which is switched ON and OFF while imaging the mouse. SLD, superluminescent diode; OI, optical isolator; FC, 50:50 fiber coupler; PC, polarization controller; NDF, neutral density filter; DC, dispersion compensator; L1 to L6, lenses; M, silver mirror; and HDG, holographic volume diffraction grating.
The system was modified with a magnetic coil powered by a regulated DC 24V power supply and with the attachment of a 6-axial stage, where a mouse was held for imaging. To obtain the magnetomotive signal, two images with the magnetic field ON and OFF were acquired. Pixel subtraction (the difference of scattering) was processed for each OCT scan and 2D image display. The magnetic field of 40 G within the coil was measured with a gaussmeter.
Magnetic Field and Data Acquisition
A current flowing in a coil generates a magnetic field along the coil axis when its length is much longer than its radius. We determined the current-generated magnetic field strength along the central axis of the magnetic coil. This enabled us to determine the length of the magnetic coil necessary for the tissue sample or mouse eyes. In this experiment, we have demonstrated a magnetic flux density of approximately 40 G using a 24-V power supply and a 50-ohm limiting resistor to the coil. The effective current generated is low at approximately 0.48 A. For this experiment, separate MMOCT scan measurements were performed during the current OFF, current ON with positive polarity (+), and current ON with negative polarity (−). The OCT scan control is the same as in SD-OCT, except for the synchronization control of the current ON or OFF with the OCT scan. A total of two OCT images were obtained during current OFF and ON. The OCT images obtained during each of the current states were processed and displayed.
MMOCT Verification In Vitro and In Vivo
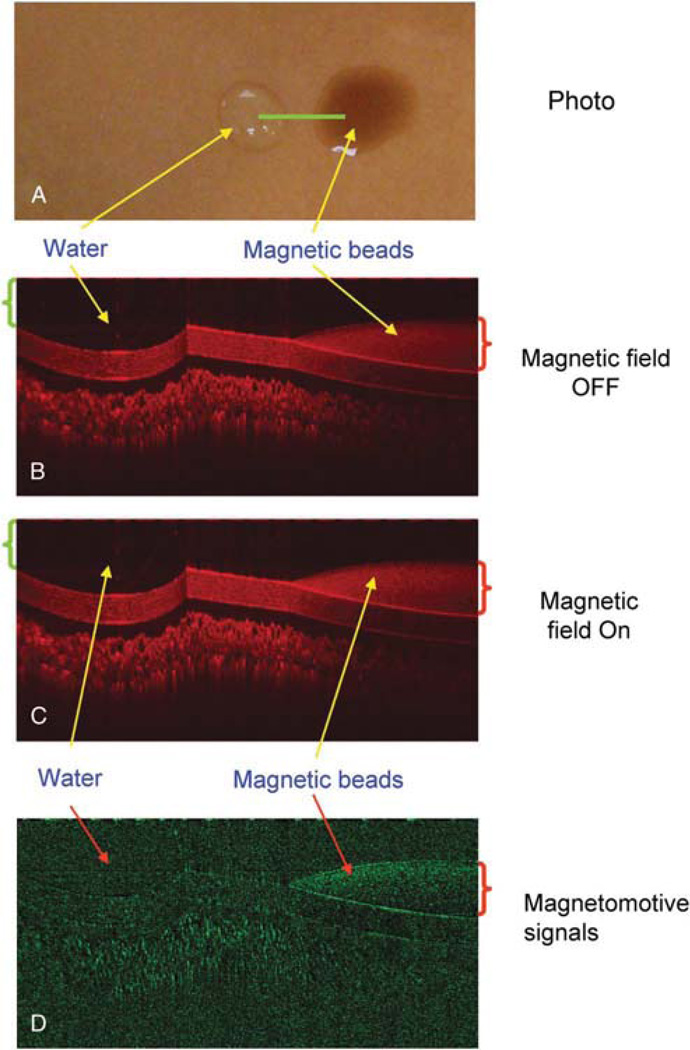
To verify the magnetic responses from the magnetic particles, magnetomotive signals were acquired and compared between water and magnetic beads (Streptavidin Magnetic Beads S1420S, size 1 µm; 4 mg/mL; New England BioLabs, Ipswich, MA). One drop of each test component was placed on a plastic card and imaged with the MMOCT with the magnetic field OFF and ON (Fig. 2A). In addition, the beads were injected into the agarose gel (1.5% agarose; A9539-250G; Sigma Chemical Co. St. Louis, MO, prepared in 400 mM Tris acetate, 10 mM ethylenediaminetetraacetic acid) with air for the simulation of the biodistribution of the beads. A solidified agarose gel was used and was kept on a transparent plastic holder that is standard for casting agarose gels. Magnetomotive optical coherence tomography imaging was conducted. To test the low concentration of the magnetic beads for MMOCT detection, the beads were diluted with normal saline (1:4), injected into the agarose gel, and imaged using MMOCT. To verify the magnetic responses in vivo from the magnetic particles, 0.1 µL of the magnetic beads was injected into the anterior segment of a DBA/2J mouse eye,10 followed by MMOCT imaging. Without turning ON the magnetic field, we imaged twice to demonstrate the repeatability of the imaging. Magnetomotive optical coherence tomography signals were acquired when the magnetic field was turned ON.
FIG. 2.
Optical coherence tomography (OCT) imaging of water and magnetic particles. One drop of water (green bracket ~50 µL) was instilled onto a plastic card surface along with another drop (red bracket ~ 50 µL) of the magnetic particles. The card was placed on a magnetic coil. An OCT linear scan (A, green line) was performed. The OCT imaging was repeated during the magnetic modulation OFF (B) and ON (C). Magnetomotive signal in M-model (D) showed only the magnetic particles with a great reduction of the background.
Intraocular Injections
These procedures were performed by following a protocol approved by the institutional animal care and use committee. For this, mice were anesthetized using an intraperitoneal injection (0.1 µL) of ketamine (100 mg/kg) and xylazine (9 mg/kg). A topical anesthetic (0.5% tetracaine hydrochloride) was applied to the selected eye. The beads (0.5–1 µL) were injected using a 36G beveled needle (NF36BV-2, World Precision Instrument, Sarasota, FL) mounted on a 10-µL microsyringe (NanoFil 300329, World Precision Instrument). An UltraMicroPumpII (UMP2; World Precision Instrument) was used to control the injection volume. The needle was entered at the limbus, and care was taken not to puncture the iris or the lens. As the needle was being withdrawn after the injection, a cotton tip applicator was applied for approximately 30 sec to prevent the fluid from leaking out.
RESULTS
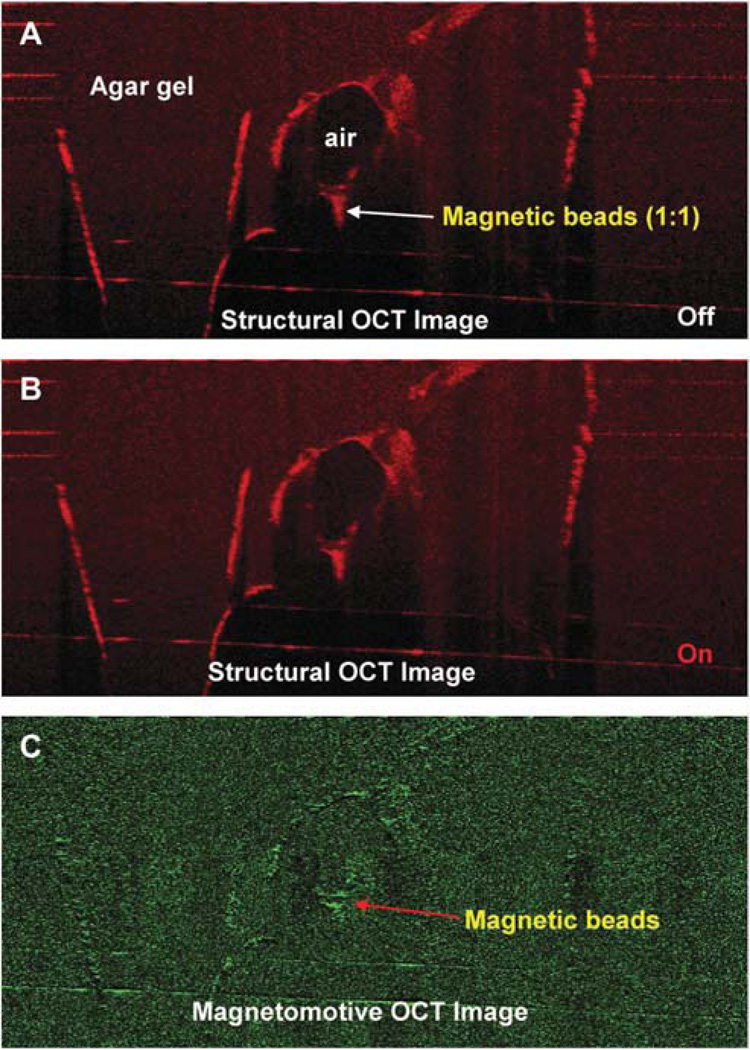
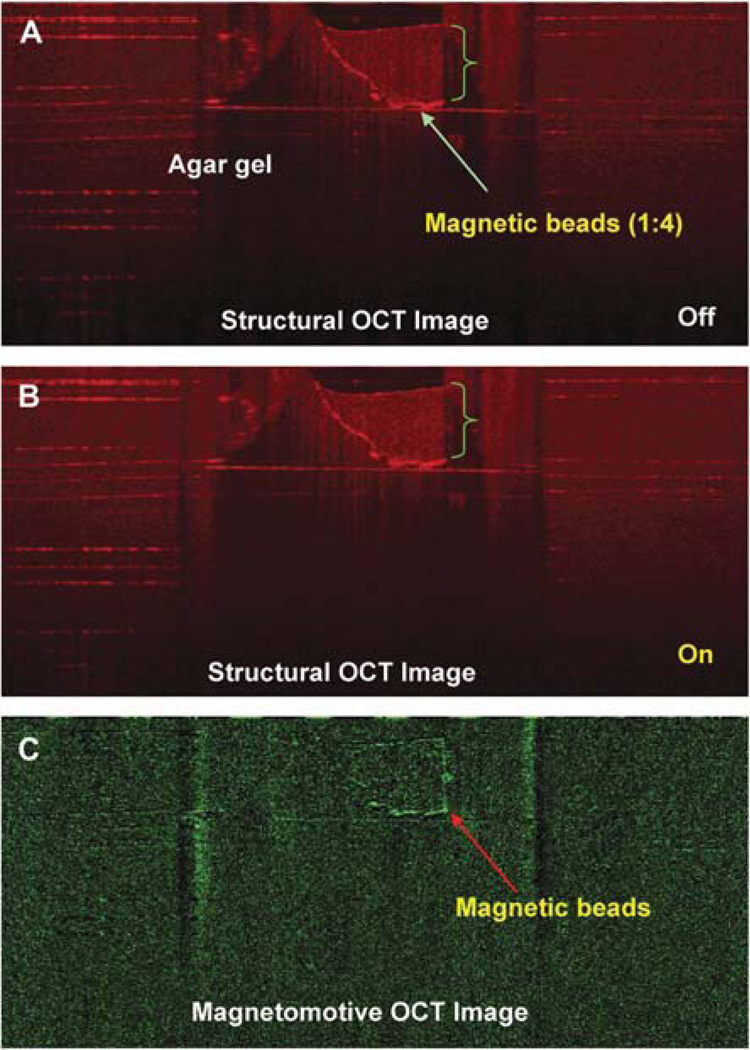
The in vitro determination showed the magnetomotive signals on the plastic card (Fig. 2) and within the agarose gel with enhanced contrast (Fig. 3). The signals were detectable with the 1:4 diluted beads in the agarose gel (Fig. 4). The distribution of the beads in the agarose gel matched the location shown in the structural OCT image (Figs. 1–4).
FIG. 3.
Magnetomotive OCT image of magnetic beads in the agar gel. The beads were injected into the gel. Two OCT images were acquired before (A) and after (B) switching on the magnetic modulation. The magnetomotive OCT image (C) showed the signals of the magnetic beads, which matched the distribution of the beads in the structural OCT images.
FIG. 4.
Magnetomotive OCT image of magnetic beads at a dilution of 1:4. The beads (green bracket) were diluted 1:4 with normal saline and injected into an agarose gel (1.5% agarose in 400 mM Tris acetate, 10 mM ethylenediaminetetraacetic acid). The OCT images were acquired before (A) and after (B) switching on the magnetic modulation. The magnetomotive OCT image (C) shows the boundaries of the magnetic beads.
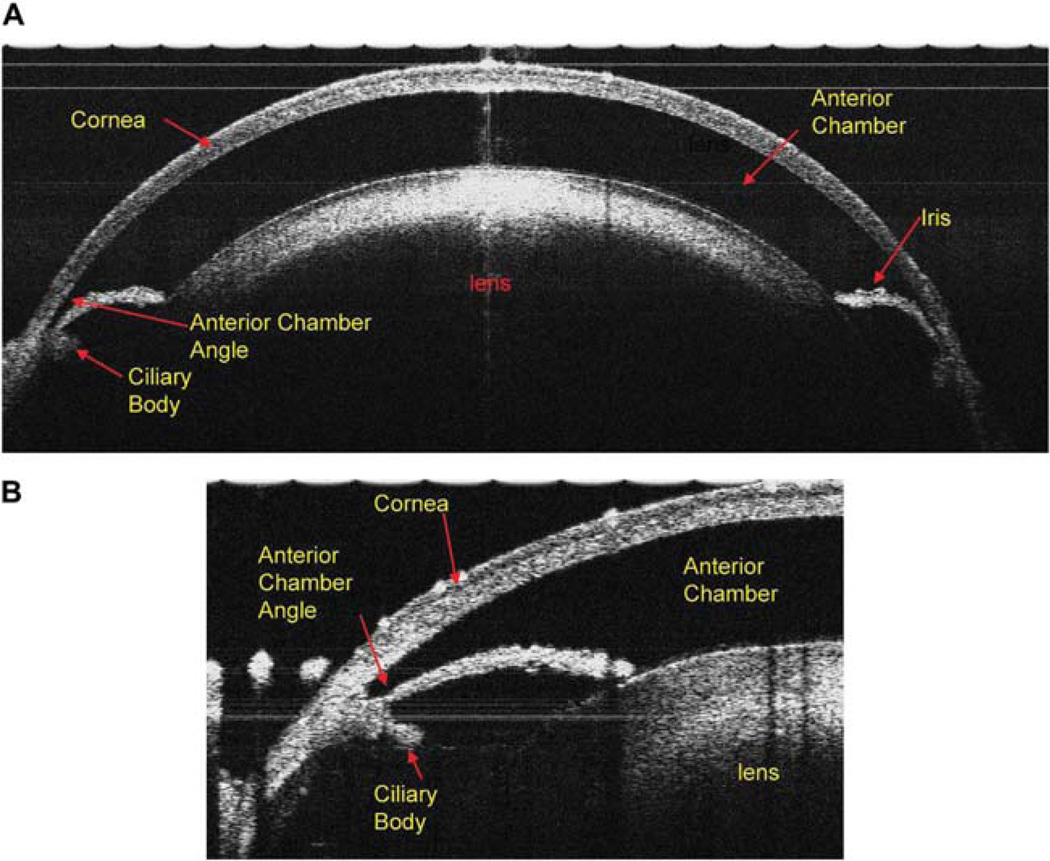
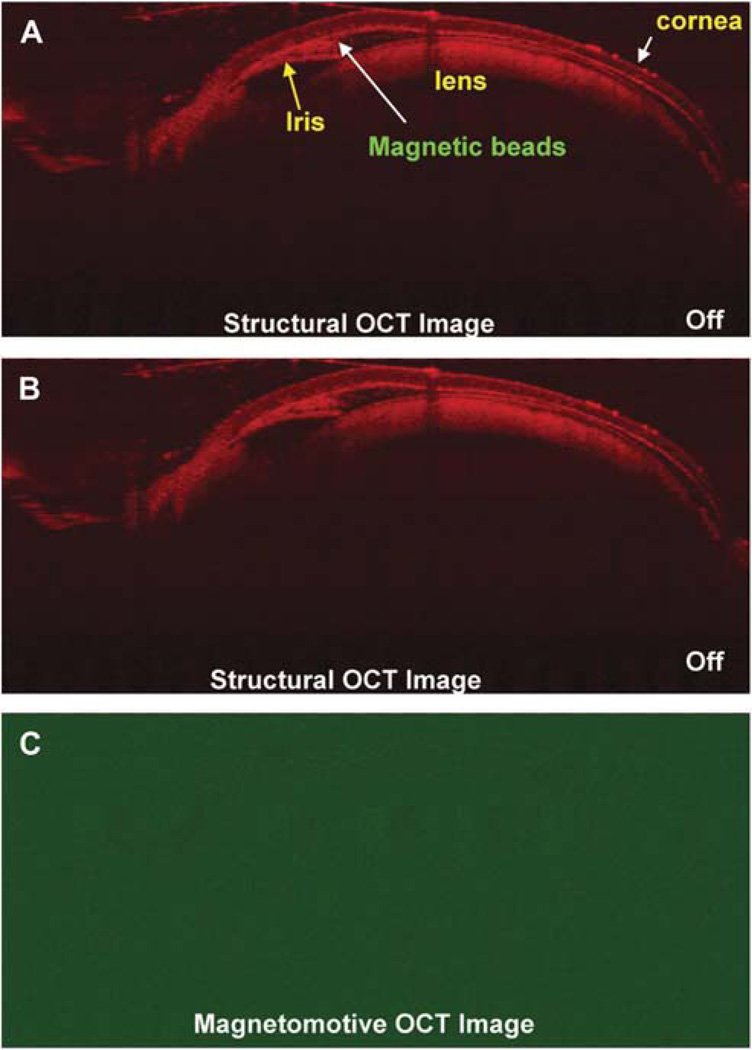
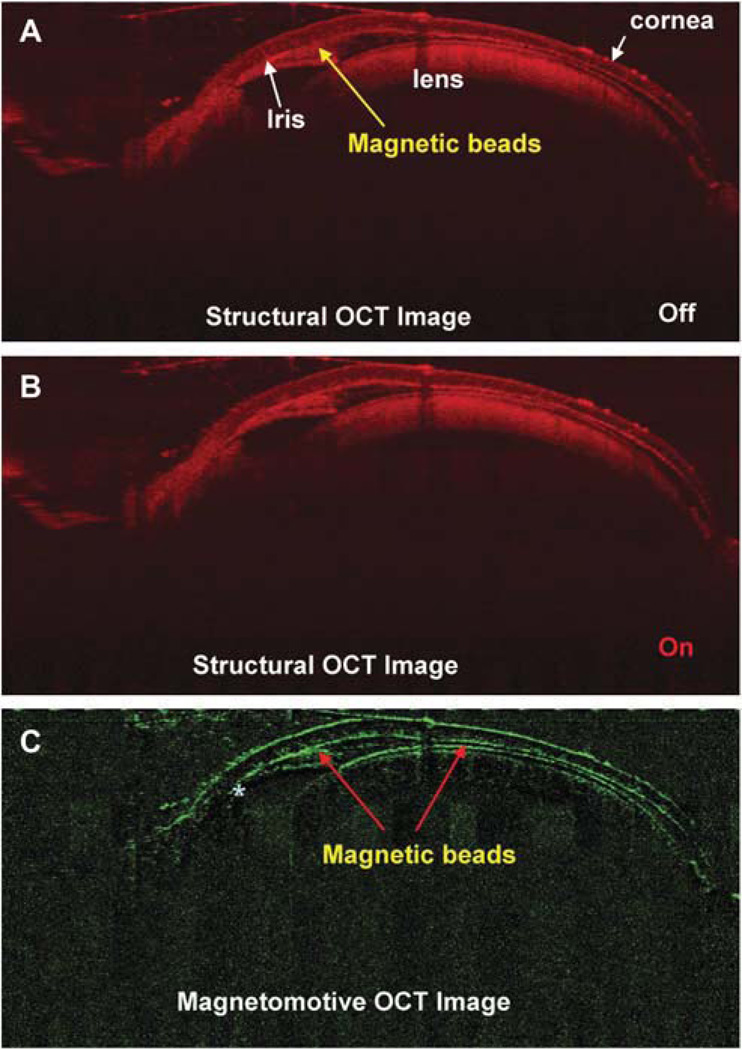
The entire anterior segment (including the ciliary body) of the mouse eye was also imaged successfully with the system (Fig. 5). In the test on the mouse eye, there was no magnetic motion (Fig. 6) detected by the MMOCT when the magnetic field was OFF. After turning ON the magnetic field, the signals pointed to the anterior segment angle by showing the responding scattering in addition to other boundaries (Fig. 7). The front surface of the cornea showed some signals of the magnetic motion of the beads, possibly because of the leakage of the beads during the injection. The anterior chamber was shallow as a result of the leakage of aqueous humor during the injection.
FIG. 5.
The cross-sectional view of the anterior segment of the DBA/2J mouse eye: (A) Ultrahigh resolution spectral-domain OCT with a scan width of 3.5 mm and a scan depth of 2 mm; the entire cornea, anterior chamber, iris, and the lens are clearly visualized. (B) When the scanning probe was turned to the limbus area of the mouse eye, the anterior chamber angle, iris, and ciliary body clearly are seen.
FIG. 6.
Magnetomotive OCT image of the DBA/2J mouse eye after injection of the magnetic beads. The beads were injected into the anterior chamber of the mouse eye and the anterior chamber was shallow after the injection because of the leak of aqueous humor. (A, B) Views captured with magnetic field OFF. The magnetic beads were imaged in the structural OCT images because of their scattering nature in the anterior chamber. Nothing is seen in (C) the magnetomotive OCT image.
FIG. 7.
Magnetomotive OCT image of the DBA/2J mouse eye after injection of the magnetic beads with magnetic field. Structural OCT images of (A) the mouse anterior segment captured without a magnetic field and (B) view acquired with the magnetic field. The magnetic beads appeared in the structural OCT images because of their scattering nature in the anterior chamber. (C) Magnetomotive OCT image of the magnetic beads appearing in the anterior chamber, anterior chamber angle, the back surface of the cornea and front surface of the crystal lens. There were almost none in the posterior chamber (marked as asterisk *) underneath the iris.
DISCUSSION
Because OCT detects backscattering from the tissue, any changes in scattering will result in the detection of a difference, which can be used to localize the change in the structure. Biologic tissues exhibit no ferromagnetism but only weak magnetic susceptibility. Imaging particles with high magnetic susceptibility and ferromagnetic properties has been successfully demonstrated.1,6,11 Iron oxide, such as magnetite, is a good candidate because of its known bio-compatibility after polymer coating.12 In the presence of a high magnetic field gradient, particles with high magnetic susceptibility in tissue are exposed to a gradient force. This causes the ferromagnetic particles to change their orientation and align their internal magnetization along the field. The rotation and movement of the particles result in the magnetomotion of the particle and perturbation of the surrounding cells and organelles that, in turn, induces the change in the localized scattering. When the magnetic field is removed, the particles in the elastic medium (tissue) return to their original position and orientation. These changes in position and orientation include displacement and rotation.11 When the magnetic field is repetitively switched ON and OFF, the induced magnetomotion causes a change in light scattering that can be captured using OCT. Thus, the differences between the two states can be imaged. The ON and OFF states can be rapidly switched during each A-scan data acquisition, resulting in the detection of the location where the magnetic nanoparticles are embedded. The magnetic nanoparticles can be coupled to an antibody or cell for targeting.1,6,11 Because OCT can also acquire structural information, the magnetomotive signal can be projected (overlaid) onto the structural image.11
Magnetomotive optical coherence tomography is a combination of OCT with a synchronized magnetic field control system (control electronics and magnetic coil). Magnetomotive optical coherence tomography is the performance of OCT on a tissue that contains magnetic nanoparticles that change orientation under different externally applied magnetic fields. The changes in orientations of magnetic nanoparticles greatly affect the local tissue structure and thus enhance the local light scattering. Effective use of MMOCT can thus enhance 3D tomography image contrast. Rapid reorientation of magnetic nanoparticles is achieved with a magnetic coil composed of a spool wound with a thin electrical wire. When the coil is connected to a power supply, the current flow in the coil generates the magnetic field. The greater the coil wiring loop density (number of wires per unit length) and the greater the current, the higher the generated central magnetic field. The central magnetic field direction can be changed by changing the current flow direction. For imaging, the tissue sample or mouse containing the magneto nanoparticles needs to be placed near the center of the coil. The nanomagnetic particles are of a size of 50 to 500 nm and have minimal scattering to the MMOCT measurement light beam. Light scattering occurs when the particle sizes are close to or larger than the wavelength of the measurement light. In the absence of an applied an electric field, the MMOCT measurement of the tissue sample with magnetic nanoparticles is almost the same as the conventional SD-OCT measurement with no contrast enhancement. When a DC current is applied to the vertical magnetic coil, it generates a strong magnetic field pointing in a certain direction. Magnetic nanoparticles react to the externally applied magnetic field by aligning in the same magnetic field direction. During the nanoparticle reorientation and near-by nanoparticle interactions, larger local scattering centers are formed through the change in local material (tissue) densities. This effectively scatters the measurement light beam and increases the MMOCT image contrast. When the current direction is reversed, the magnetic field direction also reverses and causes a reorientation of the magnetic nanoparticles. By quickly switching the magnetic field direction and comparing the tomographic images obtained, we can further enhance the image contrast through image subtraction and processing.
This novel approach using MMOCT imaging in the mouse eye will widen the research applications of the OCT technique. Coupling magnetic beads to antibodies in future studies could significantly advance our capability to image specific molecules in the eye and study diseases at the molecular level. These diseases include glaucoma, dry eye, multiple sclerosis, and other diseases with ocular manifestation. Currently, mouse models are available for several such diseases.13–16 Development of this novel technology will have a high impact on these studies. With the implementation of the MMOCT, proteins or other biologic macromolecules can be detected in live eyes, and their rate of generation and degradation may possibly be determined. Such a detection in live tissues will provide an insight into the mechanisms at the molecular level involving biomacromolecules. For instance, it will enable the detection of correlations among specific proteins and stages of disease and also the therapeutic outcome for a given protein target at a given dose of inhibitor or activator. Fundamentally, the MMOCT will lead to the development of new approaches for the diagnosis and treatment of ocular abnormalities.
The MMOCT signal appeared weaker in the agarose gel than on the plastic card. This may be because of the light absorption by agarose with appearance of translucence, as shown in Figures 3 and 4. The anterior chamber was shallow after injection, and this can be overcome by using a viscoleastic substance mixed with beads to maintain a deep anterior chamber. This may make the MMOCT imaging easier because we may acquire the same quality image as shown in the preinjection figure. This did not consider specific targeting. The injected beads were found to be nonspecifically distributed in the anterior segment. In future studies, specific targeting may be used to locate proteins in the anterior segment and other parts of the eye. Further work in this field will be focused on the improvement of scanning speed and sensitivity. Using phase-resolved detection of magnetic nanoparticle displacements, Oldenburg et al. reported that the sensitivity was improved by a factor of 15 and that speed was more than 10 times faster.3
In this study, we have proven that it is feasible to use MMOCT to detect magnetic particles injected into the DBA/2J mouse eye. This suggests that MMOCT is effective for future live detection of molecular (protein) targets in various ocular diseases in mouse models.
ACKNOWLEDGMENTS
The authors thank Ashley Crane and Andrew Coggin for critical reading of the article.
Supported by research grants from the NIH (3R01EY016112-04S1 to SKB, 1R21EY021012-01 to JW), UM SAC Award (JW), NIH Center Grant P30 EY014801 and Research to Prevent Blindness (RPB).
Footnotes
The authors have no proprietary interest in any materials or methods described within this article.
REFERENCES
- 1.Boppart SA, Oldenburg AL, Xu C, et al. Optical probes and techniques for molecular contrast enhancement in coherence imaging. J Biomed Opt. 2005;10:41208. doi: 10.1117/1.2008974. [DOI] [PubMed] [Google Scholar]
- 2.John R, Rezaeipoor R, Adie SG, et al. In vivo magnetomotive optical molecular imaging using targeted magnetic nanoprobes. Proc Natl Acad Sci U S A. 2010;107:8085–8090. doi: 10.1073/pnas.0913679107. [DOI] [PMC free article] [PubMed] [Google Scholar]
- 3.Oldenburg AL, Crecea V, Rinne SA, et al. Phase-resolved magnetomotive OCT for imaging nanomolar concentrations of magnetic nanoparticles in tissues. Opt Express. 2008;16:11525–11539. [PMC free article] [PubMed] [Google Scholar]
- 4.Oh J, Feldman MD, Kim J, et al. Magneto-motive detection of tissue-based macrophages by differential phase optical coherence tomography. Lasers Surg Med. 2007;39:266–272. doi: 10.1002/lsm.20473. [DOI] [PubMed] [Google Scholar]
- 5.Xu C, Ye J, Marks DL, et al. Use of near-infrared fluorescent dyes in depth resolved spectroscopic optical coherence tomography. Conf Proc IEEE Eng Med Biol Soc. 2004;2:1214–1217. doi: 10.1109/IEMBS.2004.1403387. [DOI] [PubMed] [Google Scholar]
- 6.Oldenburg A, Toublan F, Suslick K, et al. Magnetomotive contrast for in vivo optical coherence tomography. Opt Express. 2005;13:6597–6614. doi: 10.1364/opex.13.006597. [DOI] [PubMed] [Google Scholar]
- 7.Wang J, Jiao S, Ruggeri M, et al. In situ visualization of tears on contact lens using ultra high resolution optical coherence tomography. Eye Contact Lens. 2009;35:44–49. doi: 10.1097/ICL.0b013e31819579f2. [DOI] [PMC free article] [PubMed] [Google Scholar]
- 8.Ruggeri M, Wehbe H, Jiao S, et al. In vivo three-dimensional high-resolution imaging of rodent retina with spectral-domain optical coherence tomography. Invest Ophthalmol Vis Sci. 2007;48:1808–1814. doi: 10.1167/iovs.06-0815. [DOI] [PubMed] [Google Scholar]
- 9.Christopoulos V, Kagemann L, Wollstein G, et al. In vivo corneal high-speed, ultra high-resolution optical coherence tomography. Arch Ophthalmol. 2007;125:1027–1035. doi: 10.1001/archopht.125.8.1027. [DOI] [PMC free article] [PubMed] [Google Scholar]
- 10.Hoag WG, Meier H, Dickie M, et al. The effect of nutrition on fertility of inbred DBA/2J mice. Lab Anim Care. 1966;16:228–236. [PubMed] [Google Scholar]
- 11.Oldenburg AL, Gunther JR, Boppart SA. Imaging magnetically labeled cells with magnetomotive optical coherence tomography. Opt Lett. 2005;30:747–749. doi: 10.1364/ol.30.000747. [DOI] [PubMed] [Google Scholar]
- 12.Chertok B, David AE, Yang VC. Polyethyleneimine-modified iron oxide nanoparticles for brain tumor drug delivery using magnetic targeting and intra-carotid administration. Biomaterials. 2010;31:6317–6324. doi: 10.1016/j.biomaterials.2010.04.043. [DOI] [PMC free article] [PubMed] [Google Scholar]
- 13.Lindsey JD, Weinreb RN. Elevated intraocular pressure and transgenic applications in the mouse. J Glaucoma. 2005;14:318–320. doi: 10.1097/01.ijg.0000169411.09258.f6. [DOI] [PubMed] [Google Scholar]
- 14.Chang B, Hawes NL, Hurd RE, et al. Retinal degeneration mutants in the mouse. Vision Res. 2002;42:517–525. doi: 10.1016/s0042-6989(01)00146-8. [DOI] [PubMed] [Google Scholar]
- 15.Furlan R, Cuomo C, Martino G. Animal models of multiple sclerosis. Meth Mol Biol. 2009;549:157–173. doi: 10.1007/978-1-60327-931-4_11. [DOI] [PubMed] [Google Scholar]
- 16.Imamura Y, Noda S, Hashizume K, et al. Drusen, choroidal neovascularization, and retinal pigment epithelium dysfunction in SOD1-deficient mice: A model of age-related macular degeneration. Proc Natl Acad Sci U S A. 2006;103:11282–11287. doi: 10.1073/pnas.0602131103. [DOI] [PMC free article] [PubMed] [Google Scholar]


