Abstract
Background & objectives:
New diagnostic tests for tuberculosis, especially those based on nucleic acid amplification, offer the possibility of early and accurate diagnosis of active TB. In this study we use mathematical modelling to explore the potential epidemiological impact of these new tests, with particular reference to India.
Methods:
A behavioural model of patient-doctor interactions embedded in an epidemiological model of Mycobacterium tuberculosis transmission, linked to field data, was used to investigate the effects of early diagnosis in preventing future TB cases.
Results:
New diagnostic tests for active TB will have a bigger impact sooner where: disease incidence is high and most cases are due to recent infection; advances in test technology (test sensitivity, specificity, etc.) are combined with early diagnosis; new tests have not only better technical specifications than current tests, but also compensate for the misuse of existing tests; health system delays are long compared with patient delays, assuming the former are more amenable to change.
Interpretation & conclusions:
New diagnostic tests will certainly improve TB control, but the highest impact will be obtained by applying tests with higher sensitivity and specificity early in the infectious period. Refined behavioural and epidemiological models should be able to investigate the mechanisms by which early diagnosis could be achieved, in addition to the consequent epidemiological effects.
Keywords: Diagnosis, health system delay, India, mathematical model, patient delay, transmission dynamics, tuberculosis
The World Health Organization's Stop TB Strategy has been adopted worldwide and more than 50 million patients have been successfully treated since the strategy was launched in 1995 (then known as DOTS)1. In the early years of the DOTS strategy, we predicted that TB incidence per capita would decline at 5-10 per cent per year in high-burden countries once widespread coverage had been achieved2, and yet the incidence rate has been falling at only 1 per cent per year since 20021. The reasons why TB control has been less effective than anticipated are the subject of current debate. It seems clear, however, that while HIV continues to generate many TB cases in Africa3, and concomitant risk factors such as diabetes are on the increase, notably in Asia4, a large proportion of new cases is due to persistent transmission5.
Where the majority of TB cases arise from recent infection or reinfection (as distinct from the reactivation of old infection), there is enormous potential for early diagnosis, coupled with curative treatment, to cut transmission and incidence. New diagnostic tests have a critical role to play in this process, along with improvements to the way in which medical services are sought and provided.
The purpose of this study was to explore the potential epidemiological impact of new TB diagnostic tests and procedures, focusing on India. The analysis adds to other recent work on this topic6–12, but aims to be more explicit than most previous studies about the interplay between the technology and the health system in which it is to be used.
Material & Methods
The approach was, first, to formulate a model of the behavioural interactions between patients and health providers (qualified doctors, pharmacists, laboratories and quacks, henceforth referred to as “doctors”). This allowed us to be explicit about how diagnostic tests are deployed in the health system, and to calculate the benefits in terms of the reduction in transmission. The output of this patient-doctor model was then incorporated into a full transmission model to calculate the impact on TB incidence over time.
Because the following investigation is intended to be illustrative rather than definitive, it does not include sensitivity and uncertainty analyses. These will be essential in future evaluations of the goodness of fit of models to data, and when calculating the epidemiological impact of new diagnostic tests and procedures. Besides questions about parameter values and their uncertainty, there are larger questions about model structures. This is especially true of the behavioural model of patient-doctor interactions.
Results
Modelling behavioural interactions between patients and doctors: Following others, we distinguished between patient delays (time from onset of symptoms to first contact with a doctor) and health service delays (time from first contact to a correct diagnosis)13–15. The available data, like those in Fig. 1, were usually obtained by interviewing patients in clinics. Most studies do not actively search for patients who have not presented for diagnosis and treatment (population-based prevalence surveys are an exception), and therefore, probably underestimate the period of illness and infectiousness attributable to patient delays. In this study, we focused on TB patients in India, and the analysis reflects the fact that a large proportion16, and perhaps the majority17, of people in India seek medical care from private doctors rather than from the public health system. For TB, diagnosis and treatment in the public sector in India is provided by the Revised National TB Control Programme (RNTCP).
Fig. 1.

Patient delays (PD) and health system delays (HSD) measured in 72 studies reported by Storla et al13, Sreeramareddy et al14, and Pantoja et al15. There was no association between the two measures of delay across these studies. All points except two (one not shown) lie below the diagonal line, which marks a sum of delays of 100 days. The black circle marks the mean for which PD and HSD are roughly equal.
Based on patient interviews, Fig. 2A shows the number of doctors seen by 1050 TB patients in Bangalore before being diagnosed by the RNTCP15. For both men and women, the number of contacts ranged from 1 to 7, with a mode of 3. This pattern of multiple contacts between patients and doctors is not unique to Bangalore or India, and is found elsewhere in the Middle East and Asia18. In Bangalore, each doctor seen added 11.5 days (S.D. 0.94) to the diagnostic delay (Fig. 2B).
Fig. 2.
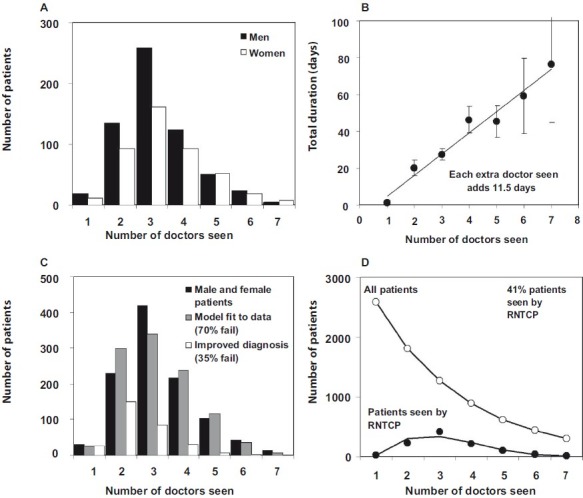
A. The number of doctors seen by 1049 male and female patients in Bangalore (mode 3, range 1-7), as reported to the RNTCP. B. Cumulative duration of health system delays in relation to the number of doctors seen. The slope of the line indicates that each doctor seen adds 11.5 days to the diagnostic delay. C. Fit of model 1 (grey) to the total number of male and female patients (black), assuming a failure rate at each point (and survival to visit the next doctor), f, of 0.7. The alignment of black and grey bars indicates a good fit of the model to the data. Open bars show the distribution of the number of doctors seen if a new diagnostic procedure reduced f to 0.35. D. Fit (lower line) to the data (filled circles) in A and C, and the estimated total number of patients (open circles) in this setting in Bangalore. Data from the study by Pantoja et al15.
Several models of the interaction between patients and doctors could explain the patterns in Figs. 2A and Figs. 2B. The following scheme is just one example. We assume that any patient seeking a diagnosis for the first time can choose to go to the RNTCP (proportion p0) or to a private doctor (1-p0). If the first consultation leads to a satisfactory outcome so far as the patient and doctor are concerned (ideally, the correct diagnosis followed by curative treatment), the chain of events ends there. If the outcome is not satisfactory, the patient may remain with the same doctor or choose another one, either in the RNTCP or the private sector. We define f to be the proportion of patients who fail with one doctor (in either private or public sector) and survive to choose another. The proportion that chooses the RNTCP at the nthencounter (pn) may remain the same, or increase or decrease with each encounter. In this scheme, the number of patients in any cohort, I, that are diagnosed and treated by the RNTCP is
N = I[p0 + (1 – p0) fp1 + (1 – p0) f (1 – p1)fp2+ …]
In the Bangalore study15, (N = 1050). Ideally, we would also have independent estimates of pn, f, and I to test both the underlying logic of the model and its fit to the data. In the absence of these data, and for the sake of example, we take f = 0.7, and then fit the model to the data by maximum likelihood to estimate pn and I (Fig. 2C). With these assumptions, cohort size I is estimated to be 2556 (S. D. 130), the estimated mean number of doctors seen by men and women is 2.7 (compared with the actual mean of 3.3), and pn increases linearly by 0.16 (S.D. 0.01) with each additional doctor seen. That is, patients are increasingly likely to seek care in the RNTCP after each failed encounter. If each contact adds 11.5 days to the diagnostic delay, then this cohort of 2556 patients suffers an average 31.1 days of illness before receiving a correct diagnosis, or 79,504 person-days in total.
Although the Bangalore study15 reported data from the perspective of the 1050 patients interviewed in the RNTCP, the model can be used to reconstruct the fate of the full cohort of 2566 patients (Fig. 2D). Furthermore, the ratio N/I = 41 per cent is an estimate of the percentage of all patients seen in the RNTCP. The true percentage of cases detected by the RNTCP might be higher, but this low case detection rate is consistent with the data.
Having formulated the model and estimated parameter values, we can investigate the effect of improving diagnostic procedures. If a new diagnostic test was applied only to the sputum samples that are presently examined by smear microscopy in the RNTCP, its effect would clearly be limited. However, if every TB suspect examined by every private or public doctor was given a test that doubled the proportion of correct diagnoses (reducing the proportion of unsatisfactory encounters by half, so that f falls from 0.7 to 0.35), then each patient would see only 1.5 doctors on average, and the average duration of illness would be shortened to 17.6 days, or 45,083 person-days in total (Fig. 2C). Notice that improved diagnosis by private doctors means that fewer patients are eventually seen by the RNTCP (now down to 11% in this example). Under this model, a lower percentage of cases detected by the RNTCP is a sign of more effective TB control.
If the number of person-days of illness varies in proportion with the number of infections transmitted, the improvement to diagnosis cuts transmission by 43 per cent in this example. This calculated impact on the number of transmitted infections can be used to investigate epidemiological impact.
Modelling the epidemiological impact of new diagnostic tests : Transmission drives dynamic models of TB epidemics, like that depicted in Fig. 3 (see also Annex). We used this model to investigate how the reductions in transmission attributable to improved diagnostic procedures, as compared with other control methods, will reduce future numbers of TB cases.
Fig. 3.
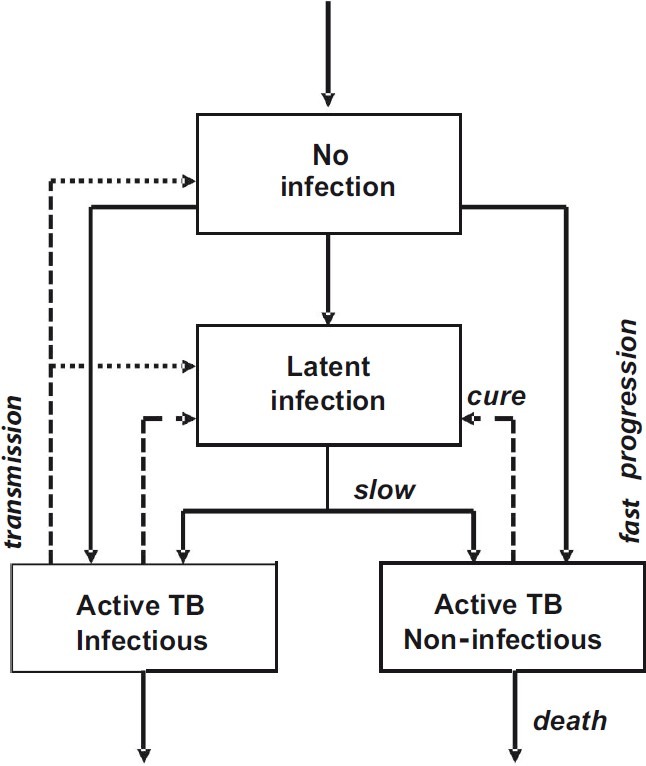
Stock and flow chart of the TB transmission model. Transmission (dotted arrow) drives the direction of movement (solid arrows) among exclusive groups of uninfected and infected people. Infection can progress quickly to active infectious or non-infectious TB, or slowly via a subclinical or latent state. Patients with active TB who are successfully diagnosed and treated are returned to the latent state (dashed arrows); otherwise they persist in the population with active disease, or die. Equations of the model are in the Annexure and parameter values are in the Table.
Annexure.
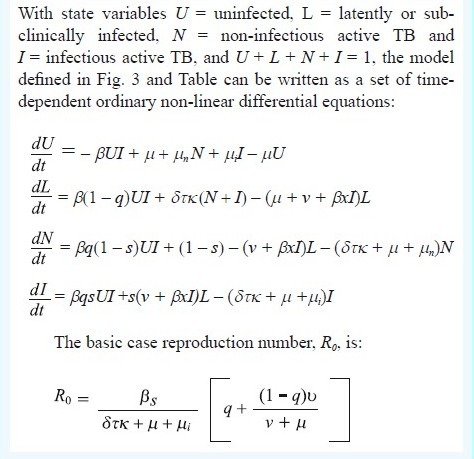
Epidemiological model of tuberculosis
Initial model parameter values are chosen to be consistent with (but do not uniquely determine) the TB epidemic in India, generating an annual risk of infection (ARI) of 1.5 per cent19 and an incidence rate of 220/100k population/year, with 78 per cent of new cases to due recent infection rather than reactivation. This incidence rate was higher than the present WHO estimate, but was consistent with the most recent measure of ARI. The diagnosis and treatment of active TB, and mortality, remove infectious and non-infectious cases from the prevalent pool at a rate δτκ + μ + μi, where δ is the per capita detection rate per year, τ is the proportion of TB cases that test positive on diagnosis (test sensitivity), κ is the proportion that is cured, and the μs are mortality rates with (subscripted) and without TB. Diagnostic test sensitivity is at a maximum when the test is used under optimal conditions; the effective sensitivity could be lower when the test is used in routine practice.
We choose initial values of δ = 2 (patient delay of 0.5 yr), τ = 0.5 (50% test sensitivity) and κ = 0.7 (70% cure). Health system delays arise because τ and κ take values less than 1, but these delays are foreshortened by death from TB and other causes. The model is a device that puts different interventions in the same currency - the infectious period - so these can be compared. With these parameter values and others in the Table, the mean infectious period is 1/(δτκ + μ + μi) = 1.1 yr. The total duration of infectiousness is divided almost equally between patient and health system delays, and this duration becomes shorter when any of the control parameters (δ, τ, κ) increases in value. The basic case reproduction number of R0 = 1.4 in this example, is the product of the contact rate, β, the proportion of infected people that ever develops infectious TB, s[q + (1 - q)v/ (v + μ)], and the duration of infectiousness. Any reduction in the duration of infectiousness by a factor of more than 1-1/1.4, or 29 per cent (to 0.78 yr or less), will ensure that R0 < 1 and that TB is eventually eliminated (Fig. 4A).
Table.
Parameters and control variables of the TB transmission model depicted in Fig. 3
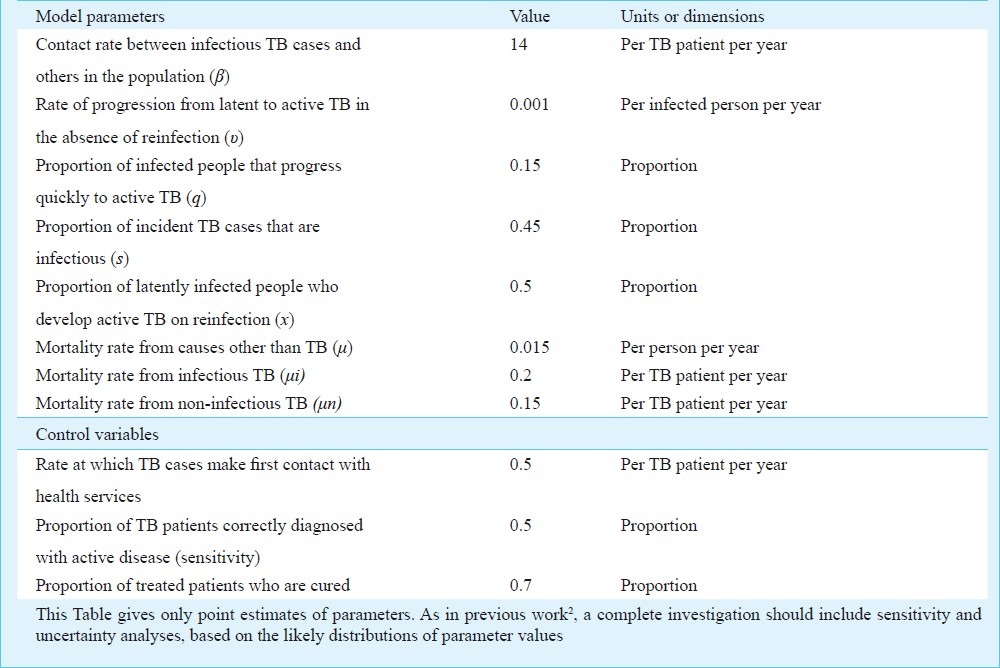
Fig. 4.
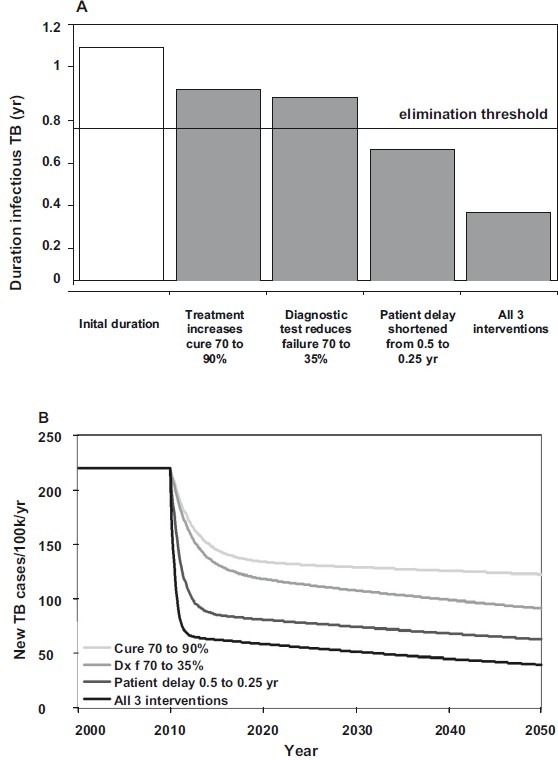
Comparative impact of three interventions, singly and in combination, on (A) the average duration of infectiousness, and consequently (B) TB incidence through time. Interventions begin in 2010. Below the elimination threshold of 0.78 yr in A, R0 < 1 and TB will eventually be eliminated.
Beginning in 2010, an immediate increase in the percentage cured from, say, 70 to 90 per cent would reduce the duration of illness from 1.1 to 0.9 yr (Fig. 4A). Consequently, incidence falls from 220 cases/100k population/year to 122/100k by 2050 (Fig. 4B). A cure rate of 90 per cent is close to the maximum that can be achieved in large-scale, routine health care, but if the starting point was lower than 70 per cent, the impact on incidence would be greater.
Better drug treatment is limited by the ceiling on cure rate, and early diagnosis is needed to cut transmission prior to effective treatment. While new diagnostic tests and procedures could in principle eliminate delays altogether, their performance in practice will depend on test characteristics and how these are deployed by medical services. A new diagnostic procedure that cut the health system delay by 43 per cent and the overall delay by half that (by 23%, to 0.86 yr) would reduce incidence to 92/100k in 2050. If, by using a new diagnostic procedure, the patient delay could be reduced by half (duration 0.62 yr) then TB incidence would fall to 63/100k in 2050, which puts TB on a path to elimination.
All three interventions carried out together would yield 40 cases/100k in 2050, which is not much better than reducing the patient delay alone. The reason is that the three interventions do not act independently. Rather, these all work in pursuit of the same goal – to reduce transmission. Although more effort given to control has greater absolute effects and may push R0 below the elimination threshold, extra effort yields diminishing returns. When most transmission has been interrupted, further substantial progress in reducing incidence (below about 50 cases/100k in Fig. 4B) must be made by neutralizing the subclinical reservoir of infection.
Discussion
This analysis shows how new diagnostic tests and procedures can reduce the number of consultations between patients and doctors, cut transmission and avert future TB cases. The analysis is preliminary and illustrative, but underpins at least six general conclusions.
First, it is self-evident that improved diagnostic procedures will avert more TB cases when the correct diagnosis is made earlier for a higher proportion of patients, preferably at the first “point of care”. However, our explicit analysis of patient-doctor interactions underlines the fact that better diagnosis requires, not just technological advances, but also changes to the way in which medical services are sought and provided – in India, by patients and by public and private practitioners.
Second, if a new diagnostic test does more to reduce health system delays than patient delays, its impact will be greater where the health system delays are relatively long. As the data in Fig. 1 show, the absolute and relative lengths of these delays vary from one study to another, and need to be measured in each setting. The standard method of investigating patient and health service delays – to ask the patients who come to health services - probably underestimates the length of these delays. A better approach would be to interview patients found in population-based prevalence surveys, although the number of patients found in national surveys is typically small (< 200).
Third, new diagnostic tests will make a bigger impact where they not only have better sensitivity and specificity than existing tests, but also compensate for the misuse of the existing tests because, for example, these are easier to use. Thus fully automated nucleic acid amplification tests (the leading product in 2010 is Xpert MTB/RIF20) have higher sensitivity than sputum smear microscopy, but their clinical and epidemiological effects will be greater if used to replace low-quality smear microscopy.
Fourth, more cases will be averted when the TB incidence per capita is initially higher, with a higher proportion of new cases arising from recent infection. In our interpretation of TB epidemiology in India, the majority of cases is still due to recent infection and reinfection rather than reactivation, and therefore, the majority of cases can be prevented by interrupting transmission. In this respect, the potential effect of early diagnosis is greater than the effect of pushing the cure rate up to a ceiling of around 90 per cent. Because the results of this analysis depend on it, the proportion of cases due to recent infection deserves further investigation in high-burden countries where, in ageing populations with high rates of smoking, undernutrition and diabetes, the aetiology of disease may differ from that reported in Europe and North America5,21.
Fifth, while efforts given to reducing transmission may push the basic case reproduction number below the threshold for (eventual) elimination (R0< 1), incremental effort yields diminishing returns. The implication is that all the interventions to reduce transmission investigated here – improved diagnosis and cure rates, shorter patient and health system delays - become less cost-effective as these are more fully implemented. There are at least two possible exceptions. One is that there are economies of scale, where an intervention becomes cheaper with greater population coverage, so lower incremental effectiveness is offset by lower incremental costs. The other is that there are synergistic interactions between interventions. Thus, intuition backed by some calculations suggests that diagnosing more patients with subsequently low cure rates has the potential to generate chronic cases, drug resistance, and to increase transmission2,22. If so, coupling earlier diagnosis with a higher cure rate would yield greater benefits than revealed by the present epidemiological model.
Sixth, by collecting data to validate and refine both the behavioural and the epidemiological models discussed here, it will be possible to make a firmer assessment of the impact of new diagnostic tests and procedures in any given setting. We shall then be in a stronger position to state what technical specifications (sensitivity, specificity, positive predictive value, etc.), and what adjustments to the supply and demand of medical services, are needed to achieve early diagnosis and any specified reduction in transmission and incidence.
The next generation of models and data will need to address a series of emerging questions that concern the mechanisms by which early diagnosis can be achieved as well as the consequent epidemiological effects. Among these questions are: In India or elsewhere, are efforts to reduce transmission limited mainly by technology or by the nature of the health system? What set of incentives and regulations are needed to achieve early and accurate diagnosis in a system dominated by private medical care? What combination of sensitivity, specificity and cost would encourage active rather than passive case detection? New diagnostic tests and procedures are bound to improve TB control, but the best results will depend on finding answers to these and other similar questions.
Acknowledgment
Knut Lönnroth kindly provided original data from the Bangalore study and advised on its interpretation. Brian Williams advised on maximum likelihood fitting procedures. Clarisse Mason helped compile the data in Fig. 1. The World Health Organization and the Bill & Melinda Gates Foundation provided financial support. This paper was presented orally at an international symposium on TB Diagnostics: Innovating to Make an Impact, held on December 16-17, 2010, at the International Centre for Genetic Engineering and Biotechnology, New Delhi. The author alone is responsible for the contents of this paper, which do not necessarily represent the decisions, policies or views of the World Health Organization.
References
- 1.Geneva: World Health Organization. Geneva: World Health Organization; 2011. Global tuberculosis control. [Google Scholar]
- 2.Dye C, Garnett GP, Sleeman K, Williams BG. Prospects for worldwide tuberculosis control under the WHO DOTS strategy. Directly observed short-course therapy. Lancet. 1998;352:1886–91. doi: 10.1016/s0140-6736(98)03199-7. [DOI] [PubMed] [Google Scholar]
- 3.Williams BG, Granich R, De Cock KM, Glaziou P, Sharma A, Dye C. Antiretroviral therapy for tuberculosis control in nine African countries. Proc Natl Acad Sci USA. 2010;107:19485–9. doi: 10.1073/pnas.1005660107. [DOI] [PMC free article] [PubMed] [Google Scholar]
- 4.Lonnroth K, Castro KG, Chakaya JM, Chauhan LS, Floyd K, Glaziou P, et al. Tuberculosis control and elimination 2010-50: cure, care, and social development. Lancet. 2010;375:1814–29. doi: 10.1016/S0140-6736(10)60483-7. [DOI] [PubMed] [Google Scholar]
- 5.Dye C, Williams BG. The population dynamics and control of tuberculosis. Science. 2010;328:856–61. doi: 10.1126/science.1185449. [DOI] [PubMed] [Google Scholar]
- 6.Keeler E, Perkins MD, Small P, Hanson C, Reed S, Cunningham J, et al. Reducing the global burden of tuberculosis: the contribution of improved diagnostics. Nature. 2006;444(Suppl 1):49–57. doi: 10.1038/nature05446. [DOI] [PubMed] [Google Scholar]
- 7.Murray CJL, Salomon JA. Modeling the impact of global tuberculosis control strategies. Proc Natl Acad Sci USA. 1998;95:13881–6. doi: 10.1073/pnas.95.23.13881. [DOI] [PMC free article] [PubMed] [Google Scholar]
- 8.Dowdy DW, Lourenco MC, Cavalcante SC, Saraceni V, King B, Golub JE, et al. Impact and cost-effectiveness of culture for diagnosis of tuberculosis in HIV-infected Brazilian adults. PLoS One. 2008;3:e4057. doi: 10.1371/journal.pone.0004057. [DOI] [PMC free article] [PubMed] [Google Scholar]
- 9.Dowdy D, Chaisson RE, Maartens G, Corbett EL, Dorman SE. Impact of enhanced tuberculosis diagnosis in South Africa: a mathematical model of expanded culture and drug susceptibility testing. Proc Natl Acad Sci USA. 2008;105:11293–8. doi: 10.1073/pnas.0800965105. [DOI] [PMC free article] [PubMed] [Google Scholar]
- 10.Abu-Raddad LJ, Sabatelli L, Achterberg JT, Sugimoto JD, Longini IM, Jr, Dye C, et al. Epidemiological benefits of more-effective tuberculosis vaccines, drugs, and diagnostics. Proc Natl Acad Sci USA. 2009;106:13980–5. doi: 10.1073/pnas.0901720106. [DOI] [PMC free article] [PubMed] [Google Scholar]
- 11.Uys PW, Warren R, van Helden PD, Murray M, Victor TC. Potential of rapid diagnosis for controlling drug-susceptible and drug-resistant tuberculosis in communities where Mycobacterium tuberculosis infections are highly prevalent. J Clin Microbiol. 2009;47:1484–90. doi: 10.1128/JCM.02289-08. [DOI] [PMC free article] [PubMed] [Google Scholar]
- 12.Ahmad RA, Mahendradhata Y, Cunningham J, Utarini A, de Vlas SJ. How to optimize tuberculosis case finding: explorations for Indonesia with a health system model. BMC Infect Dis. 2009;9:87. doi: 10.1186/1471-2334-9-87. [DOI] [PMC free article] [PubMed] [Google Scholar]
- 13.Storla DG, Yimer S, Bjune GA. A systematic review of delay in the diagnosis and treatment of tuberculosis. BMC Public Health. 2008;8:15. doi: 10.1186/1471-2458-8-15. [DOI] [PMC free article] [PubMed] [Google Scholar]
- 14.Sreeramareddy CT, Panduru KV, Menten J, Van den Ende J. Time delays in diagnosis of pulmonary tuberculosis: a systematic review of literature. BMC Infect Dis. 2009;9:91. doi: 10.1186/1471-2334-9-91. [DOI] [PMC free article] [PubMed] [Google Scholar]
- 15.Pantoja A, Floyd K, Unnikrishnan KP, Jitendra R, Padma MR, Lal SS, et al. Economic evaluation of public-private mix for tuberculosis care and control, India. Part I. Socio-economic profile and costs among tuberculosis patients. Int J Tuberc Lung Dis. 2009;13:698–704. [PubMed] [Google Scholar]
- 16.Dewan PK, Lal SS, Lonnroth K, Wares F, Uplekar M, Sahu S, et al. Improving tuberculosis control through public-private collaboration in India: literature review. Br Med J. 2006;332:574–8. doi: 10.1136/bmj.38738.473252.7C. [DOI] [PMC free article] [PubMed] [Google Scholar]
- 17.Bhatia V. Enhancing private sector contribution to TB care in India. Geneva: Global Fund to Fight AIDS, TB and Malaria; 2010. [Google Scholar]
- 18.World Health Organization. Regional Office for the Eastern Mediterranean. Diagnostic and treatment delay in tuberculosis WHO/-EM/TDR/009/E Cairo. 2006 [Google Scholar]
- 19.Chadha VK, Kumar P, Jagannatha PS, Vaidyanathan PS, Unnikrishnan KP. Average annual risk of tuberculous infection in India. Int J Tuberc Lung Dis. 2005;9:116–8. [PubMed] [Google Scholar]
- 20.Boehme CC, Nabeta P, Hillemann D, Nicol MP, Shenai S, Krapp F, et al. Rapid molecular detection of tuberculosis and rifampin resistance. N Engl J Med. 2010;363:1005–15. doi: 10.1056/NEJMoa0907847. [DOI] [PMC free article] [PubMed] [Google Scholar]
- 21.Rieder HL. Epidemiologic basis of tuberculosis control. 1st ed. Paris: International Union Against Tuberculosis and Lung Disease; 1999. [Google Scholar]
- 22.Styblo K, Bumgarner JR. Tuberculosis can be controlled with existing technologies: evidence. Paris: Tuberculosis Surveillance Research Unit, International Union Against Tuberculosis and Lung Disease; 1991. [Google Scholar]


