

Abstract
Purpose
Assuming that early tumor volume change is a biomarker for response to therapy, accurate quantification of early volume changes could aid in adapting an individual patient’s therapy and lead to shorter clinical trials. We investigated an image registration–based approach for tumor volume change quantification that may more reliably detect smaller changes that occur in shorter intervals than can be detected by existing algorithms.
Methods and Materials
Variance and bias of the registration-based approach were evaluated using retrospective, in vivo, very-short-interval diffusion magnetic resonance imaging scans where true zero tumor volume change is unequivocally known and synthetic data, respectively. The interval scans were nonlinearly registered using two similarity measures: mutual information (MI) and normalized cross-correlation (NCC).
Results
The 95% confidence interval of the percentage volume change error was (−8.93% to 10.49%) for MI-based and (−7.69%, 8.83%) for NCC-based registrations. Linear mixed-effects models demonstrated that error in measuring volume change increased with increase in tumor volume and decreased with the increase in the tumor’s normalized mutual information, even when NCC was the similarity measure being optimized during registration. The 95% confidence interval of the relative volume change error for the synthetic examinations with known changes over ±80% of reference tumor volume was (−3.02% to 3.86%). Statistically significant bias was not demonstrated.
Conclusion
A low-noise, low-bias tumor volume change measurement algorithm using nonlinear registration is described. Errors in change measurement were a function of tumor volume and the normalized mutual information content of the tumor.
Keywords: Tumor volume change, Image registration, Dual baseline examination, Coffee-break examination, Linear mixed-effects model
Introduction
The temporal evolution of tumors in three spatial dimensions (3D) is complex. Standard techniques for tumor response evaluation, like unidimensional Response Evaluation Criteria in Solid Tumors (RECIST) 1.1 (1) or bidimensional World Health Organization (2) measurement methods, make many assumptions (3) and are challenged in accurately assessing small, early changes. Accurate, early quantification of tumor volume change could lead to iteratively adapting individual patients’ chemotherapy to achieve optimal response and shorter Phase III clinical trials (4, 5). However, finding accurate techniques to measure small 3D changes is a significant challenge. Current approaches estimate a tumor’s change indirectly by independently segmenting it in interval examinations and then subtracting the segmented volumes to obtain a change estimate (6, 7). Ensuring the consistency of these independent segmentations across intervals is a significant challenge. This work investigated an alternative but direct approach to volume change quantification using image registration. The goal was to develop low-noise estimators of change that would reliably detect smaller tumor volume changes that occur in shorter intervals.
An initial registration-based study was conducted by Thirion and Calmon (8) for synthetic multiple sclerosis lesions using the Demons nonrigid registration algorithm. They calculated tumor volume change by evaluating the deformation field using concentric spheres and embedded isosurfaces (8). Reeves et al. (9) used 3D rigid body registration to improve the consistency of sequential segmentations and accuracy of change measurements in interval scans of pulmonary nodules. A constrained warping scheme to register lesions in low-information liver datasets while preserving local volume outside the lesion was presented in 2008 by our group (10). This article discusses a warping registration approach to estimate volume change in breast tumors imaged with diffusion magnetic resonance imaging (dMRI). Tumor pairs are spatially registered across intervals, and volumetric change is calculated by summing local scale changes obtained from the Jacobian map of the deformation. Potentially, such an approach can also reveal regions of differential change within the tumor.
The algorithm best suited for early change detection would have the least measurement noise and least bias (11). Using RECIST 1.1, a spherical tumor’s volume needs to change by as much as −66% or +73% to be classified as partial response or progressive disease, respectively (12). Thus, the RECIST measurement paradigm is useless for early detection of small changes. Most segmentation-based algorithms can reduce these volume response bounds to around ±20% (13–15). Although this reduction is a substantial improvement over RECIST, the smaller these bounds become, the smaller the volume change (effect size) that can be measured leading to earlier detection of treatment response.
A major obstacle in the validation of different algorithms is the lack of sources where true volume change is reliably known. But very-short-interval examinations and synthetic examinations provide solutions to this problem. Herein we assess the noise variance and bias of our volume change measurement algorithm using such sources.
Methods and Materials
Dataset
A useful volume change measurement algorithm should be able to track small changes (i.e., from this clinical standpoint the main interest lies in evaluating the noise and bias of an algorithm in measuring tumor volume change close to zero). We gauged the performance of our algorithm using two kinds of interval scans: clinical interval scans, where true tumor volume change is known to be zero for assessing the repeatability of the method, and synthetic interval scans with random but known nonzero tumor volume change primarily to observe bias effects.
Deidentified clinical data previously collected at the University of Michigan for early evaluation of response to neoadjuvant chemotherapy in 9 breast cancer patients using dMRI was used in this study. In the imaging protocol every patient received two pretreatment, baseline, anisotropic dMRI scans within a very short interval (~15 minutes). We also refer to these examinations as coffee-break examinations (CBEs). Given that these dMRI scans are taken within a few minutes of each other, we assume that there are no macroscopic changes to the tumor (i.e., the true tumor volume change between these two examinations is zero). The scans, however, differ because of the decorrelating effects of noise during scan acquisition, patient repositioning, and motion. These factors make CBEs excellent resources for realistic assessment of measurement noise associated with change measurement algorithms at the null point of volume change. Manual segmentations, even when performed by experts, have significant variability (16). Thus, we assessed our algorithm’s performance in measuring tumor change rather than assessing segmented individual tumor volumes. Each CBE pair represents the same volume in the patient; any nonzero measurement of change is in error.
Given our laboratory’s successful experience with the quantitative use of apparent diffusion coefficient (ADC) magnetic resonance imaging for early estimation of tumor response to radiation and chemotherapy (17), we focused on the potential use of diffusion volumetry for assessing the response of homogeneous tumors. Additionally, in a retrospective analysis of 50 patients with locally advanced rectal cancer others, have found that post-chemoradiation diffusion-weighted magnetic resonance volumetry was significantly more accurate than T2-weighted magnetic resonance volumetry (18).
Our method requires segmentation of only the first of the interval scans to grossly identify the tumor. The second of the interval scans is then registered to the tumor as identified in the first scan’s annotation and immediately surrounding tissue to assess change. All dMRI CBEs datasets are 288 × 288 × 60 with a voxel volume of 3.84 mm3 (1.25 mm × 1.25 mm × 2.50 mm); the registrations are performed on the fat-suppressed, anisotropic zero diffusion (b0) gradient image (i.e., the T2-weighted, b0 image, acquired using a 7-coil breast receiver array on a Philips 3T magnet, TR = 4720 ms, TE = 50 ms, sense = 2, echo-planar acquisition). The typical signal-to-noise ratio for the b0 image across nine scans on 3 patients in breast parenchyma was measured at 31.6. The tumor volumes across the 9 patients ranged from 5.39 to 57.35 cc as defined by the radiologists’ annotations.
Registration algorithm
We registered the tumor of interest between intervals using a 3D warping registration algorithm. Warping is necessary to accurately capture the potentially heterogeneous deformation of tumor compartments in the breast. All registrations were implemented using MIAMI-Fuse (Mutual Information for Automatic Multimodality Image Fusion), a software program for the automatic alignment of datasets (19). MIAMI-Fuse uses thin plate splines (TPS) (20) for its warping geometric deformation interpolant and the Nelder-Mead simplex for its optimizer. Instead of directly modifying the defining TPS coefficients, the user during initialization, or the optimizer during optimization of the deformation of the floating dataset, moves each of a user-specified number of control points in 3D in the floating dataset, and the TPS coefficients are recomputed for each configuration. These coefficients are then used to map each voxel in the reference dataset to a locus in the floating image. The benefit of this approach is that the optimizer’s stopping threshold criterion can be uniformly defined on the decreasing motion of each of the control points independently of the differing sensitivities of each of the TPS coefficients. Mutual information between the floating and reference dataset is computed via their joint density histogram using 64 bins for each dataset. Position-variant, adaptive Parzen windowing is used to filter joint density histogram bins with too few counts for noise rejection; counts from increasing numbers of adjacent bins are averaged as needed to obtain stable bin count estimates.
For each of the 9 patients with coffee-break examinations, the following procedure was observed:
A radiologist delineated the tumor’s volume of interest (VOI) on a contrast-enhanced anatomic scan, a T1-weighted 3D gradient recalled echo (GRE) fat-suppressed acquisition obtained immediately after a dynamic contrast enhanced (DCE) acquisition during the same dMRI CBE study. One of the two CBE scans was arbitrarily chosen as the reference CBE scan, which then also needed a tumor VOI in its own geometry to register the other CBE’s tumor onto itself. To generate the reference CBE’s VOI, the reference CBE examination was treated as the floating examination, and its tumor was warped onto the anatomic reference scan’s tumor using a slightly dilated VOI version of the radiologist’s VOI as described immediately below. Then, using the inverse of the same warping, the anatomic VOI mask was warped back onto the floating reference CBE scan to serve as the reference CBE tumor’s VOI.
The reference CBE tumor’s VOI was dilated using a 3 × 3 binary structuring element to include regions external to the tumor. The dilated region served as the reference volume and ensured that we did not lose edge information associated with the tumor while keeping the primary focus on registration of the tumor. We chose three different sets of dilations (approximately 50%, 100%, and 200% of the size of the segmented tumor volume) to investigate whether incorporating information external to the tumor improved the registration of the tumor itself.
For each dilation setting in each tumor, there were 10 randomly restarted repetitions of registration.
A set of hexagonally close-packed control points was automatically generated in the 3D reference volume spaced 12 mm apart (Fig. 1a). The control points were also distance-sorted from largest to smallest in the reference volume. Thus, using a registration schedule where the first N distance-sorted control points were used imposed a decreasing scale-space registration as N was monotonically increased.
The registration was initialized by the user’s choosing one approximate homologous control point in the 3D floating volume (the second coffee-break scan) for the first five automatically generated control points as shown in Fig. 1b. All the other steps described above and below were automatically controlled by MIAMI-Fuse.
An optimized, 3D decreasing scale-space warping registration was performed between the two volumes to align the homologous image with the reference image. Two similarity metrics were used separately for registration: mutual information (MI) and normalized cross correlation (NCC). Folding was prevented by monitoring the sign of the Jacobian determinant at the finish of the highest control point density schedule line optimization. If there were any negative Jacobian values, the control point closest to the most negative Jacobian was iteratively removed after each optimization cycle, and the cycle was repeated until there were no negative Jacobian values.
The determinant of the first-order partial derivatives of the deformation tensor F obtained from the registration was used to form a Jacobian map of local scale changes at every voxel (x, y, z) in the reference volume according to eq. 1.
Fig. 1.

Placement of control points. (a) Automatic hexagonal close-packed arrangement of control points in three-dimensional (3D) reference volume after intensity thresholding. (b) Manual placement of first five corresponding control points (only four are visible here) in the 3D homologous volume.
| (1) |
Local expansions and contractions yielded positive Jacobian values JF (x, y, z) >1 and <1 respectively, whereas a value of 1 indicated no volume change in the voxel. The total volume change was estimated by summing up the local scale changes over the volume Utumor annotated by the radiologist in the reference image (v represents the voxel volume of the reference examination) as shown in eq. 2.
| (2) |
Although the coffee-break dataset provided realistic noise at the operating point of zero tumor volume change, it was difficult to obtain clinical scans with nonzero volume change where truth was also unequivocally known. To counter this problem, data sources with known nonzero tumor volume change could be obtained from synthetic scans like phantoms (21) or mathematical models. The registrations of the 30 synthetic pairs of homologous and reference scans followed the same process described previously except that only one similarity measure (MI) and one dilation (200% tumor volume) was used. All 30 TPS warping registrations were automatically started with the same 64 distance-sorted hexagonally close-packed control points placed on the reference scan and the corresponding guess for the first 5 of the 64 control points placed on the homologous scan. Note that because of the way these synthetic datasets were created, a “rotate–isotropic scale–translate” registration algorithm would likely provide a less noisy solution than a higher degrees-of-freedom TPS fit. However, the standard blinded approach was chosen to obtain a fair evaluation of the volume change measurement algorithm.
In this study we synthesized 30 homologous scans by 3D random scaling, rotating, translating, and linearly interpolating one scan of a breast cancer patient chosen from the pool described in eq. 3.
| (3) |
In eq. 3, H and C are the coordinate vectors of the generated synthetic scan and original scan, respectively; s is the isotropic scaling factor chosen randomly from a uniform distribution to create contractions and expansions of the original volume in the range (−80% to 80%); θ, a, and ϕ are yaw, pitch, and roll angles, respectively, and chosen randomly from N (0 degree, (5°)2); tx, ty, and tz are translations in x, y, and z directions, respectively, and chosen randomly from N (0 mm, (2 mm)2). The random rotations and translations caused the tumor in some synthetic scans to end up outside the field of view. Such scans were discarded. Now the radiologist’s segmented VOI in the original scan was dilated by three voxels such that voxels near the tumor’s edge played a role in the subsequent registration. In decorrelating the noise in the synthetic examinations from the reference VOI, 30 reference scans were derived from the masked scan by adding a random Gaussian noise realization, which led to a fivefold decrease in signal to noise ratio. Each pair in the resulting synthetic set of 30 homologous and reference scan pairs now had a random, known, nonzero volume change in the VOI. One such pair is shown in Fig. 2.
Fig. 2.

Sample slice from a synthetically generated dataset. (a) Slice of dilated reference volume of interest (VOI) with added decorrelated noise; masked VOI was 42.19 cc. (b) Scaled, rotated, translated, and interpolated homologous image.
Statistical model
Several linear mixed-effects (lme) models were fitted to the volume change results obtained from the coffee-break data. Model selection was based on the Bayesian information criterion, which in comparison with other metrics is a relatively unbiased estimate of the number of model parameters (i.e., degrees of freedom) required to match the information content of the modeled data (22). The results obtained from MI-based and NCC-based registrations were fitted separately. The following is the lme model fitted to the data with log transformed volume change error as response:
| (4) |
Interactions between predictors were not found to be significant. Another lme model was fitted to the data with percentage volume change error as response:
| (5) |
where i represents one of nine tumors; j represents one of three dilations; k represents one of 10 randomly restarted registration repetitions; Vh and Vr represent estimated homologous tumor volume and manually segmented reference tumor volume, respectively; I is the modeled tumor intercept for a given dilation nested within a given tumor; R is the modeled tumor intercept for a given tumor; θ is a modeled global tumor intercept across all conditions; S is the normalized mutual information (NMI) content of the tumor; and
 is the residual for each unique ijk condition. NMI is used in lieu of the MI or NCC similarity measures because it is less sensitive to overlap (23) and facilitates comparisons across different tumors of differing information content.
For the synthetic data, true, nonzero volume change percentages with respect to the reference volume of 42.19 cc was known. The true, scaled homologous volumes ranged from 8.92 cc to 72.20 cc. Estimated vs. true volume change percentages were compared using Bland-Altman plot analysis and linear regression.
Results
Figure 3 shows checkerboard plots for three registered tumors with alternating squares of the manually segmented and dilated reference tumor and the coffee-break homologous mapped onto reference tumor volume.
Fig. 3.
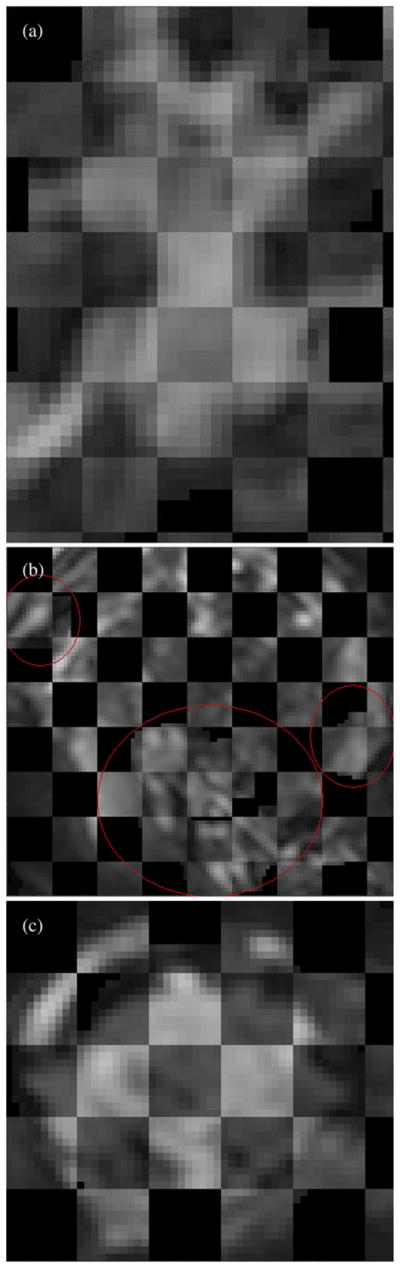
Checkerboard plots of segmented reference tumor and homologous mapped onto reference tumor volume for 3 patients. (a) Patient 1, reference tumor volume = 10.86 cc. (b) Patient 2, total reference tumor volume = 27.74 cc. Red ovals drawn to highlight the diffuse tumors. (c) Patient 3, reference tumor volume = 39.64 cc.
Figures 4 and 5 show the mean percentage volume change error plots with respect to log of annotated tumor volume for coffee-break data using MI and NCC, respectively. Red, green, and black represent the three different dilation settings used for each of the nine tumors. This yielded the 95% confidence interval at a particular dilation setting for a particular tumor as seen from the red, green, and black vertical bars. The mean volume change percentage error for the MI-based registrations (Fig. 4) was 0.78%, with a 95% confidence interval of (−0.17% to 1.73%). The 95% confidence interval of the error was (−8.93% to 10.49%). The mean volume change percentage error for the NCC-based registrations (Fig. 5) was 0.57%, with a 95% confidence interval of (−0.24% to 1.38%). The 95% confidence interval of the error was (−7.69% to 8.83%). Note that zero was not excluded from the 95% confidence intervals for mean error. Thus either the volume change estimation was unbiased across the population, or the experiment was insufficiently powered to observe the bias.
Fig. 4.
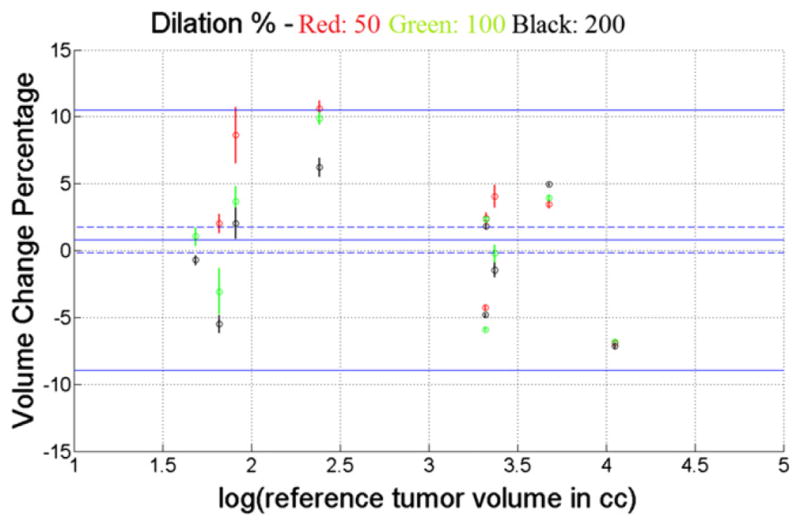
Percentage tumor volume change error plot with 95% confidence intervals for coffee-break data using mutual information as similarity measure. Red, green, and black represent the three different dilations used. Mean error was 0.78% (95% confidence interval, −0.17% to 1.73%); 95% limits of error were −8.93% to 10.49%.
Fig. 5.

Percentage tumor volume change error plot with 95% confidence intervals for coffee-break data using normalized cross-correlation as similarity measure. Red, green, and black represent the three different dilations used. Mean error was 0.57% (95% confidence interval, −0.24% to 1.38%), 95% limits of error were (−7.69% to 8.83%).
Parameter estimates and their 95% confidence intervals are summarized in Tables 1–4 for the fitted lme models. The response variable was tumor volume change error (eq. 4) for Tables 1 and 2 and percentage tumor volume change error (eq. 5) for Tables 3 and 4. Irrespective of the cost function optimized during registration (Tables 1 and 3: MI; Tables 2 and 4: NCC), the similarity measure used for all lme models was the NMI of the registered tumor, as mentioned previously.
Table 1.
Predictor coefficient estimates of linear mixed-effects model for volume change error using mutual information as similarity measure for the registrations
| Predictor | Name and units of predictor | Estimate’s 2.5 percentile | Estimate | Estimate’s 97.5 percentile | Standard error | p value |
|---|---|---|---|---|---|---|
| log Vr | Log of reference volume in cc | 0.6735 | 1.3199 | 1.9662 | 0.2803 | 0.0015 |
| S(U, V) | Normalized mutual information (bits/bits) | −2.2847 | −1.6629 | −1.0412 | 0.3156 | <0.0001 |
Table 4.
Predictor coefficient estimates of linear mixed-effects model for percentage volume change error using normalized cross correlation as similarity measure for the registrations
| Predictor | Name and units of predictor | Estimate’s 2.5 percentile | Estimate | Estimate’s 97.5 percentile | Standard error | p value |
|---|---|---|---|---|---|---|
| S(U, V) | Normalized mutual information (bits/bits) | −71.9693 | −40.5282 | −9.0871 | 15.9670 | 0.0117 |
Table 2.
Predictor coefficient estimates of linear mixed-effects model for volume change error using normalized cross correlation as similarity measure for the registrations
| Predictor | Name and units of predictor | Estimate’s 2.5 percentile | Estimate | Estimate’s 97.5 percentile | Standard error | p value |
|---|---|---|---|---|---|---|
| log Vr | Log of reference volume in cc | 0.7208 | 1.4493 | 2.1779 | 0.3159 | 0.0018 |
| S(U, V) | Normalized mutual information (bits/bits) | −2.6032 | −1.9002 | −1.1871 | 0.3569 | <0.0001 |
Table 3.
Predictor coefficient estimates of linear mixed-effects model for percentage volume change error using mutual information as similarity measure for the registrations
| Predictor | Name and units of predictor | Estimate’s 2.5 percentile | Estimate | Estimate’s 97.5 percentile | Standard error | p value |
|---|---|---|---|---|---|---|
| S(U, V) | Normalized mutual information (bits/bits) | −136.8983 | −83.3752 | −29.8521 | 27.1811 | 0.0024 |
Figure 6 shows the fitted 3D models for MI-based (Table 1) and NCC-based registrations (Table 2). The predictors are log of the annotated reference tumor volume in cubic centimeters and the NMI of the registered tumor. The response is the log of volume change error (i.e., the log of the unsigned difference between the estimated homologous and annotated reference tumor volumes). The points of intersection of the perpendicular black lines on the planes represent the coordinates of the main effects (i.e., NMI of the registered tumor and log of reference tumor volume in cubic centimeters) as obtained from the registrations.
Fig. 6.

Volume change error vs. log of reference tumor volume and normalized mutual information for mutual information–based registrations (a) and for normalized cross-correlation—based registrations (b).
For the synthetic examinations with known nonzero volume change, the Bland Altman plot of the difference vs. the mean of estimated and true volume change percentages is shown in Fig. 7. Limits of agreement (95%) of the difference are included. The dashed blue line is the line of equality. Scatter plot of estimated vs. true volume change percentages together with the mean and limits of agreement derived from the Bland Altman plot are presented in Fig. 8. The regression parameters for estimated vs. true volume change percentage are presented for comparison in Table 5, together with their 95% confidence intervals. The R2 value was 0.9985.
Fig. 7.

Bland Altman plot of the difference vs. the mean of estimated and true volume change percentages. The solid blue line at 0.42% (95% confidence interval, −0.23% to 1.07%) represents the mean difference. Note that the confidence intervals do not exclude zero bias. The 95% limits of agreement are shown with a solid red line. The lower and upper limits are −3.02% (95% confidence interval, −4.14% to −1.90%) and 3.86% (95% confidence interval, 2.74% to 4.98%), respectively.
Fig. 8.
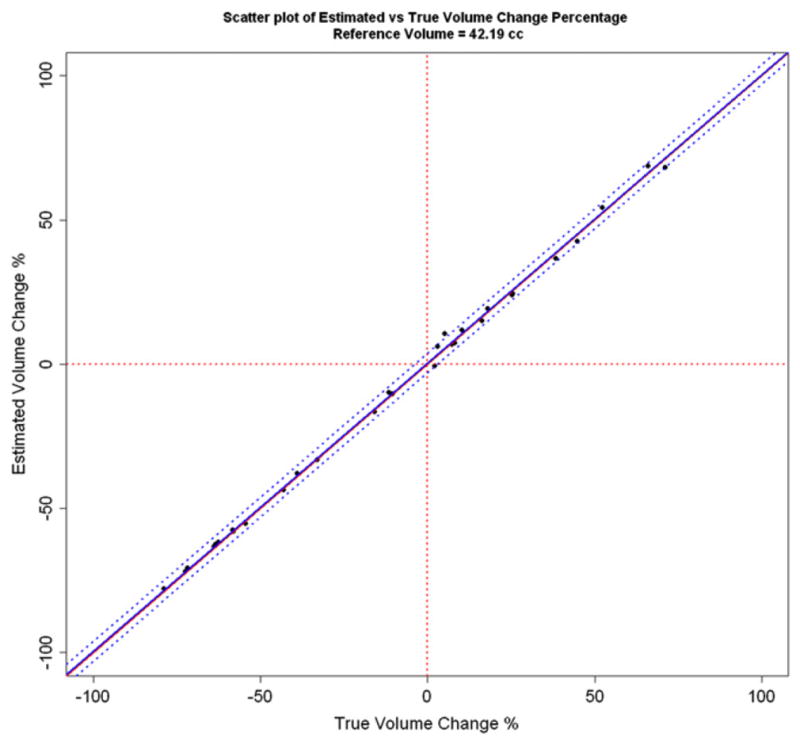
Estimated vs. true volume change percentage for the synthetic examinations. The mean bias and 95% limits of agreement derived from the Bland Altman plot are shown with blue lines. The diagonal red line is the line of equality.
Table 5.
Parameter estimates of linear regression model for the synthetic examinations
| Predictor | Estimate’s 2.5percentile | Estimate | Estimate’s 97.5 percentile | Standard error | p value |
|---|---|---|---|---|---|
| Intercept | −0.3427 | 0.3364 | 1.0156 | 0.3316 | 0.3190 |
| Slope | 0.9779 | 0.9929 | 1.0079 | 0.0073 | <0.0001 |
Discussion
In this study we developed a low-noise, low-bias tumor volume change measurement algorithm using image registration. The good alignment evident from the checkerboard plots (Fig. 3) suggests that our warping registration-based approach is capable of tracking complicated shape evolution of tumors of varying size, morphology, and geometry. To the best of our knowledge, these error bounds are thus far the tightest reported for zero-change in vivo studies (9, 14, 24). This implies that registration-based methods may potentially have higher sensitivity in terms of early detection than indirect segmentation-based change measurement methods. Additional testing needs to be done on common databases with known truth to compare the performance of our developed algorithm with other change measurement methods.
The lme models fitted to the data (Tables 1 and 2) indicate that the error in estimating tumor volume change is a function of both initial tumor volume and the NMI content of the tumor. The positive slope of the parameter estimates (1.32, p < 0.005 for MI and 1.45, p < 0.005 for NCC) associated with tumor size indicate that volume change error increases with increase in tumor size. The negative slope of the parameter estimates associated with the similarity measure (−1.66, p < 0.0001 for MI and −1.90, p < 0.0001 for NCC) show that volume change error decreases with increase in NMI of the tumor across scans even when that is not the similarity measure being optimized during registration. Figure 6 graphically represents the results of Tables 1 and 2 respectively and depicts the same trends outlined above. For example, from Fig. 6a for the MI-based registrations, an error of 0.1 cc for any tumor can be expected to decrease to 0.08 cc when the NMI of the tumor rises from 1.12 to 1.17 (0.08=10(−1.66* (1.17−1.12)+log100.1)). The lme models fitted to the absolute percentage volume change data (Tables 3 and 4) show that percentage volume change error decreases with increase in NMI of the tumor (slope: −83.38, p < 0.01 for MI and slope: −40.53, p < 0.05 for NCC). Given the decreasing error associated with increasing NMI, the method should perform even more accurately with higher spatial resolution and/or signal-to-noise ratio modalities than dMRI, as demonstrated herein.
For synthetic examinations, the estimated volume change percentage was compared with the true volume change percentage using a Bland Altman plot (Fig. 7). The Bland Altman plot suggests a mean bias of 0.42%, but the 95% confidence interval (−0.23% to 1.07%) does not exclude zero. Note that zero is also not excluded (−0.34% to 1.02%) in the 95% confidence interval for the estimate of regression intercept as shown in Table 5. Thus either the volume change estimation is unbiased, or the experiment is insufficiently powered to detect the bias. The 95% limits of agreement for the population of differences between the estimated and true volume change percentages were (−3.02% to 3.86%) from the Bland Altman plot. The mean bias and 95% limits of agreement are low compared with the range of volume change being measured (−80% to 80%) as shown in Figs. 7 and 8 and indicate good agreement.
Conclusion
This investigation developed and tested a low-noise and low-bias tumor volume change measurement algorithm using 3D nonlinear registration. No statistically significant evidence of functional bias was found for the registration-based volume change measurement algorithm. To the best of our knowledge, this investigation using dMRI reports the tightest bounds thus far for zero-change in vivo studies using either computed tomography or magnetic resonance imaging, strongly suggesting that this method can routinely detect smaller tumor volume changes in shorter intervals than other methods when using the same modality/resolution pairing. Linear mixed-effects models were developed to show that error in change measurement is a function of tumor volume and NMI of the interval tumor scans.
Summary.
We present a direct low-noise, low-bias technique for measuring tumor volume change using image registration. The method is validated using dual baseline and synthetic exams as sources of truth. To the best of our knowledge, this investigation using diffusion magnetic resonance imaging reports the tightest error bounds thus far for zero-change in vivo studies using either computed tomography or magnetic resonance imaging. Linear mixed-effects models are developed to show that change measurement error is a function of tumor volume and normalized mutual information of the interval tumor scans
Acknowledgments
Supported by DHHS NIH NCI grant 1P01CA87634 and 1P01CA85878.
Footnotes
Conflict of interest: none.
References
- 1.Eisenhauer EA, Therasse P, Bogaerts J, et al. New response evaluation criteria in solid tumors: Revised RECIST guideline (version 1. 1) Eur J Cancer. 2009;45:228–247. doi: 10.1016/j.ejca.2008.10.026. [DOI] [PubMed] [Google Scholar]
- 2.Hunter RD. WHO handbook for reporting results of cancer treatment. Int J Radiat Biol. 1980;38:481. [Google Scholar]
- 3.Kimura M, Tominaga T. Outstanding problems with Response Evaluation Criteria in Solid Tumors (RECIST) in breast cancer. Breast Cancer. 2002;9:153–159. doi: 10.1007/BF02967580. [DOI] [PubMed] [Google Scholar]
- 4.Fox J, Ford E, Redmond K, et al. Quantification of tumor volume changes during radiotherapy for non-small-cell lung cancer. Int J Radiat Oncol Biol Phys. 2009;74:341–348. doi: 10.1016/j.ijrobp.2008.07.063. [DOI] [PubMed] [Google Scholar]
- 5.Tsien C, Gomez-Hassan D, Haken RKT, et al. Evaluating changes in tumor volume using magnetic resonance imaging during the course of radiotherapy treatment of high-grade gliomas: Implications for conformal dose-escalation studies. Int J Radiat Oncol Biol Phys. 2005;62:328–332. doi: 10.1016/j.ijrobp.2004.10.010. [DOI] [PubMed] [Google Scholar]
- 6.Partridge SC, Gibbs JE, Ly Y, et al. MRI measurements of breast tumor volume predict response to neoadjuvant chemotherapy and recurrence-free survival. AJR Am J Roentgenol. 2005;184:1774–1781. doi: 10.2214/ajr.184.6.01841774. [DOI] [PubMed] [Google Scholar]
- 7.Krishnan K, Ibanez L, Turner WD, et al. An open-source toolkit for the volumetric measurement of CT lung lesions. Opt Express. 2010;18:15256–15266. doi: 10.1364/OE.18.015256. [DOI] [PubMed] [Google Scholar]
- 8.Thirion JP, Calmon G. Deformation analysis to detect and quantify active lesions in 3D medical image sequences. IEEE Trans Med Imaging. 1991;18:429–441. doi: 10.1109/42.774170. [DOI] [PubMed] [Google Scholar]
- 9.Reeves AP, Chan A, Yankelevitz DF, et al. On measuring the change in size of pulmonary nodules. IEEE Trans Med Imaging. 2006;25:435–450. doi: 10.1109/TMI.2006.871548. [DOI] [PubMed] [Google Scholar]
- 10.Sarkar S, Narayanan R, Park H, et al. Proc SPIE. Vol. 6914. San Diego: 2008. Quantitative growth measurement of lesions in hepatic interval CT exams. [Google Scholar]
- 11.Meyer CR, Armato SG, Fenimore CP, et al. Quantitative imaging to assess tumor response to therapy: Common themes of measurement, truth data, and error sources. Transl Oncol. 2009;2:198–210. doi: 10.1593/tlo.09208. [DOI] [PMC free article] [PubMed] [Google Scholar]
- 12.Therasse P, Arbuck SG, Eisenhauer EA, et al. New guidelines to evaluate the response to treatment in solid tumors. J Natl Cancer Inst. 2000;92:205–216. doi: 10.1093/jnci/92.3.205. [DOI] [PubMed] [Google Scholar]
- 13.Kuhnigk JM, Dicken V, Bornemann L, et al. Morphological segmentation and partial volume analysis for volumetry of solid pulmonary lesions in thoracic CT scans. IEEE Trans Med Imaging. 2006;25:417–434. doi: 10.1109/TMI.2006.871547. [DOI] [PubMed] [Google Scholar]
- 14.Gietema HA, Schaefer-Prokop CM, Mali WPTM, et al. Pulmonary nodules: Interscan variability of semiautomated volume measurements with multisection CT—influence of inspiration level, nodule size, and segmentation performance. Radiology. 2007;245:888–894. doi: 10.1148/radiol.2452061054. [DOI] [PubMed] [Google Scholar]
- 15.Wormanns D, Kohl G, Klotz E, et al. Volumetric measurements of pulmonary nodules at multi-row detector CT: In vivo reproducibility. Eur Radiol. 2004;14:86–92. doi: 10.1007/s00330-003-2132-0. [DOI] [PubMed] [Google Scholar]
- 16.Meyer CR, Johnson TD, McLennan G, et al. Evaluation of lung mdct nodule annotation across radiologists and methods. Acad Radiol. 2006;13:1254–1265. doi: 10.1016/j.acra.2006.07.012. [DOI] [PMC free article] [PubMed] [Google Scholar]
- 17.Hamstra DA, Galban CJ, Meyer CR, et al. Functional diffusion map as an early imaging biomarker for high-grade glioma: Correlation with conventional radiologic response and overall survival. J Clin Oncol. 2008;26:3387–3394. doi: 10.1200/JCO.2007.15.2363. [DOI] [PMC free article] [PubMed] [Google Scholar]
- 18.Curvo-Semedo L, Lambregts DMJ, Maas M, et al. Rectal cancer: Assessment of complete response to preoperative combined radiation therapy with chemotherapy—conventional MR volumetry versus diffusion-weighted MR Imaging. Radiology. 2011;260:734–743. doi: 10.1148/radiol.11102467. [DOI] [PubMed] [Google Scholar]
- 19.Meyer CR, Boes JL, Kim B, et al. Demonstration of accuracy and clinical versatility of mutual information for automatic multimodality image fusion using affine and thin-plate spline warped geometric deformations. Med Imag Anal. 1997;1:195–206. doi: 10.1016/s1361-8415(97)85010-4. [DOI] [PubMed] [Google Scholar]
- 20.Bookstein FL. Principal warps: Thin-plate splines and the decomposition of deformations. IEEE Trans Pattern Anal Mach Intell. 1989;11:567–585. [Google Scholar]
- 21.Gavrieldes MA, Kinnard LM, Myers KJ, et al. FDA phantom CT database: A resource for the assessment of lung nodule size estimation methodologies and software development. Proc SPIE. 2010;7624 [Google Scholar]
- 22.Schwarz G. Estimating the dimension of a model. Ann Statist. 1978;6:461–464. [Google Scholar]
- 23.Studholme C, Hill DLG, Hawkes DJ, et al. An overlap invariant entropy measure of 3D medical image alignment. Patt Recog. 1999;32:71–86. [Google Scholar]
- 24.Zhao B, James LP, Moskowitz CS, et al. Evaluating variability in tumor measurements from same-day repeat CT scans of patients with non–small cell lung cancer. Radiology. 2009;252:263–272. doi: 10.1148/radiol.2522081593. [DOI] [PMC free article] [PubMed] [Google Scholar]