

Abstract
Background
There is little consensus on a standard approach to analysing bone scan images. The Bone Scan Index (BSI) is predictive of survival in patients with progressive prostate cancer (PCa), but the popularity of this metric is hampered by the tedium of the manual calculation.
Objective
Develop a fully automated method of quantifying the BSI and determining the clinical value of automated BSI measurements beyond conventional clinical and pathologic features.
Design, setting, and participants
We conditioned a computer-assisted diagnosis system identifying metastatic lesions on a bone scan to automatically compute BSI measurements. A training group of 795 bone scans was used in the conditioning process. Independent validation of the method used bone scans obtained ≤3 mo from diagnosis of 384 PCa cases in two large population-based cohorts. An experienced analyser (blinded to case identity, prior BSI, and outcome) scored the BSI measurements twice. We measured prediction of outcome using pretreatment Gleason score, clinical stage, and prostate-specific antigen with models that also incorporated either manual or automated BSI measurements.
Measurements
The agreement between methods was evaluated using Pearson’s correlation coefficient. Discrimination between prognostic models was assessed using the concordance index (C-index).
Results and limitations
Manual and automated BSI measurements were strongly correlated (ρ = 0.80), correlated more closely (ρ = 0.93) when excluding cases with BSI scores ≥10 (1.8%), and were independently associated with PCa death (p < 0.0001 for each) when added to the prediction model. Predictive accuracy of the base model (C-index: 0.768; 95% confidence interval [CI], 0.702–0.837) increased to 0.794 (95% CI, 0.727–0.860) by adding manual BSI scoring, and increased to 0.825 (95% CI, 0.754–0.881) by adding automated BSI scoring to the base model.
Conclusions
Automated BSI scoring, with its 100% reproducibility, reduces turnaround time, eliminates operator-dependent subjectivity, and provides important clinical information comparable to that of manual BSI scoring.
1. Introduction
Bone is a frequent site of prostate cancer (PCa) metastases [1], and it is well established that the presence and extent of bone metastases are associated with poor outcome [2-4]. Noninvasively monitoring this subset of lesions is fundamentally important to the informed management of advanced PCa.
The preferred method for detecting skeletal lesions is whole-body scanning with a gamma camera following administration of the radionuclide technetium 99m methylenediphosphonate (Tc 99m MDP) [5]. This radiotracer does not locate tumour cells per se but rather demarcates potential sites of metastases by localising to regions of the skeleton that are actively undergoing tissue repair—a hallmark of nearby tumour involvement of bone. Although bone scans are highly sensitive for detection of metastatic lesions [6], there is little consensus on a standard approach to analysing the images. In one instructive study, a meta-analysis of multiple Swedish institutions showed substantial variations in the interpretation of bone scans among 37 observers (mean κ = 0.48), with false-negative errors predominantly contributing to disagreement [7].
We recently developed computer-assisted diagnosis (CAD) software for the automated detection and quantification of imaging data, entirely eliminating the need for operator discretion [8]. Based on these technical advances, we ventured to optimise CAD software for profiling skeletal metastases in PCa. In our experience, the Bone Scan Index (BSI)—a value designed to represent the percentage of the total skeletal mass involved by tumour—is a valuable metric for estimating metastatic burden in patients with advanced PCa [9,10]. However, the popularity of this metric is hampered by the tedium of the manual calculation, which can often take 30 min in patients with a multitude of lesions. Therefore, we sought to develop and test the performance of an automated methodology to assess BSI measurements.
2. Materials and methods
2.1. Training group
Our training group was deliberately chosen, because it had previously been used to develop a CAD system for the interpretation of whole-body bone scans [7]. The training group consisted of 795 patients who had undergone whole-body bone scintigraphy at the Sahlgrenska University Hospital, Gothenburg, Sweden—514 men (70.2 ± 9.7 yr of age; range: 27–91) and 281 women (58.9 ±13.1 yr of age; range: 25–92). A total of 431 patients had PCa, 217 had breast cancer, 27 had kidney cancer, 20 had bladder cancer, and 47 had other types of cancer. Twenty-three patients were not referred with a cancer diagnosis, and the diagnoses of the remaining 30 patients were unknown.
2.2. Evaluation group
Between 1974 and 1996, two large screening programs—the Malmö Preventive Medicine Project (MPP) and the Malmö Diet and Cancer Study (MDCS)—were conducted in Malmö, the third largest city in Sweden, which has approximately 300 000 inhabitants [11,12]. According to the Swedish National Cancer Registry, 1495 of 22 439 male participants in the MPP and 943 of 11 063 participants in the MDCS were diagnosed with PCa through 31 December 2006. A digitally stored whole-body bone scan obtained ≤3 mo from the date of diagnosis was found for 450 patients. A prostate-specific antigen (PSA) analysis within ≤3 mo of the date of diagnosis was available for 333 of these patients. None of the patients had received any type of PCa treatment prior to bone scan. In total, 384 patients were included in our final analysis. According to the registry, 109 of these men died during follow-up; two trained urologists ascertained the cause of death by review of the medical charts for 96 of these men (12% of the charts were not accessible for review; Fig. 1; Table 1).
Fig. 1. Consolidated Standards of Reporting Trials diagram: participant flow of the study.
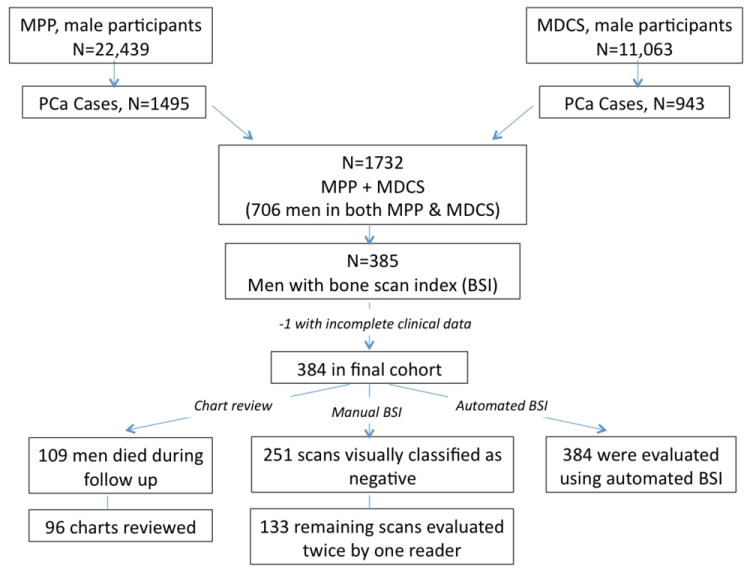
MPP = Malmö Preventive Medicine Project; MCDS = Malmö Diet and Cancer Study; PCa = prostate cancer; BSI = Bone Scan Index.
Table 1.
Patient characteristics
| Characteristic | n = 384 |
|---|---|
| Age at BSI, yr, median (IQR) | 69 (65–73) |
| Total PSA, median (IQR) | 16.8 (8.5–49.4) |
| Clinical T stage, no. (%) | |
| T1 | 82 (21) |
| T2 | 138 (36) |
| T3 | 143 (37) |
| T4 | 21 (5) |
| Gleason grade, no. (%) | |
| ≤6 | 138 (36) |
| 7 | 121 (32) |
| ≥8 | 125 (33) |
BSI = Bone Scan Index; IQR = interquartile range; PSA = prostate-specific antigen.
2.3. Bone scintigraphy
Bone scans were obtained approximately 3 h after an intravenous (IV) injection of 600 MBq Tc 99m MDP (Amersham, UK). Whole-body images and anterior and posterior views (scan speed 10 [training group] or 15 [evaluation group] cm/min, matrix 256 × 1024) were obtained with a gamma camera equipped with low-energy, high-resolution parallel hole collimators (Maxxus, GE Healthcare, Milwaukee, WI, USA [training group] or MultiSPECT2, Siemens Healthcare Diagnostics, Deerfield, IL, USA [evaluation group]). Energy discrimination was provided by a 15% window centred on the 140 keV of Tc 99m.
2.4. Automated Bone Scan Index
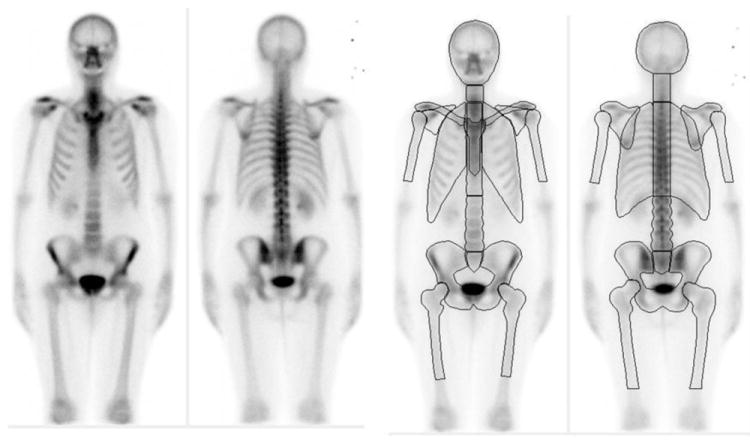
EXINI bone (EXINI Diagnostics, Lund, Sweden) is a commercially available software package that has been previously shown to be capable of learning to detect metastatic lesions in whole-body bone scans. The technology was assembled to (1) identify hotspots, (2) quantify hotspot intensity, and (3) classify hotspots as lesions. The software had been previously trained to classify hotspots as lesions using a collection of >40 000 hotspots derived from bone scans of patients with a variety of metastatic cancers. We adapted this platform to include criteria for anatomic segmentation of the skeleton and for the computation of BSI measurements. The new software analysed images using the protocol outlined in Figure 2. Segmentation of the entire skeleton (except for the distal parts of the arms and legs) in both the anterior and posterior view was carried out by automatically fitting an atlas consisting of one anterior and one posterior image to the skeleton. The atlas is based on 10 normal whole-body bone scans (5 male and 5 female patients) from the training group (Fig. 2), and transformation between atlas and patient skeleton was implemented through Morphon registration for nonrigid image registration. Regions with intensities distinctly higher than those of the surrounding skeleton are defined as hotspots. Quantification of the skeletal involvement of a hotspot, presented as a percentage of the total skeleton, is calculated as follows: The hotspot size divided by the size of the corresponding skeletal region (eg, skull, ribs, lumbar vertebra, pelvis) obtained from the segmentation of the skeleton and multiplied by a weight fraction constant of the present skeletal region with respect to the weight of the total skeleton. These constants, one for each skeletal region, were determined based on International Commission on Radiological Protection (ICRP) publication 23 [13].
Fig. 2. Atlas based on 10 normal bone scans (a) with 12 skeletal regions (b) used for automated segmentation of the patient skeleton.
Hotspot classification was performed using artificial neural networks, a statistical learning method based on examples with a known outcome [14]. Twenty to 30 features describing each hotspot (eg, size, shape, max counts, median counts, shape, localisation) were calculated and used as inputs to the neural networks. The networks were trained using a pool of 44 570 hotspots derived from clinical bone scans retrieved from a mixed cohort of patients with metastases of different cancer types enriched with 10 826 hotspots that had been previously classified as metastases by three experienced nuclear medicine physicians. The BSI measurement was calculated as the sum of the skeletal involvement of all hotspots classified as metastases by the neural network. The method’s ability to reproduce a BSI measurement, retrieved from the same bone scan, was highly consistent (100%). A manual correction was required in approximately 5% of patients to exclude hotspots clearly misclassified, benign hotspots representing a large urinary bladder, a urinary catheter attached to a drainage bag, or urine contamination. No other manual steps were applied.
2.5. Manual Bone Scan Index calculations
To provide a quantitative measure of the extent of metastatic bone disease, the bone scans were analysed according to the following criteria. One hundred fifty-eight individual bones in the body were listed by name. The weight of each bone, expressed as a fraction of the weight of the entire skeleton, was determined based on ICRP publication 23 [13]. The fractional involvement of each bone by tumour was estimated visually from the bone scan. The BSI measurement was then calculated by summing the product of the weight and the fractional involvement of each bone expressed as percentages of the entire skeleton. In the present study, 133 abnormal bone scans were manually quantified twice at different occasions, approximately 6 mo apart, by an experienced analyser who was blinded to patient ID and repetition. The remaining 251 scans were visually classified as having no metastases (BSI = 0).
2.6. Statistical methods
The agreement between the automated and manual BSI measurements as well as among duplicate manual BSI measurements from the same patient was assessed using Pearson’s correlation coefficient. To determine whether BSI measurement (manual or automated) added prognostic value, we compared the discrimination of a base model that included clinical stage, Gleason score, and total PSA in blood at diagnosis to that of base models incorporating either the manual or automated BSI measurements. Discrimination was assessed using the concordance index (C-index). We corrected for statistical overfit by using 10-fold repeated cross-validation. Confidence intervals (CIs) for C-index estimates were obtained with bootstrap methods using 1000 replications. All statistical analyses were conducted using Stata v.11.0 (StataCorp, College Station, TX, USA).
3. Results
The processing time for the automated BSI calculation was <10 s on a standard desktop computer. The manual method generally required 5–30 min, depending on the extent of the disease.
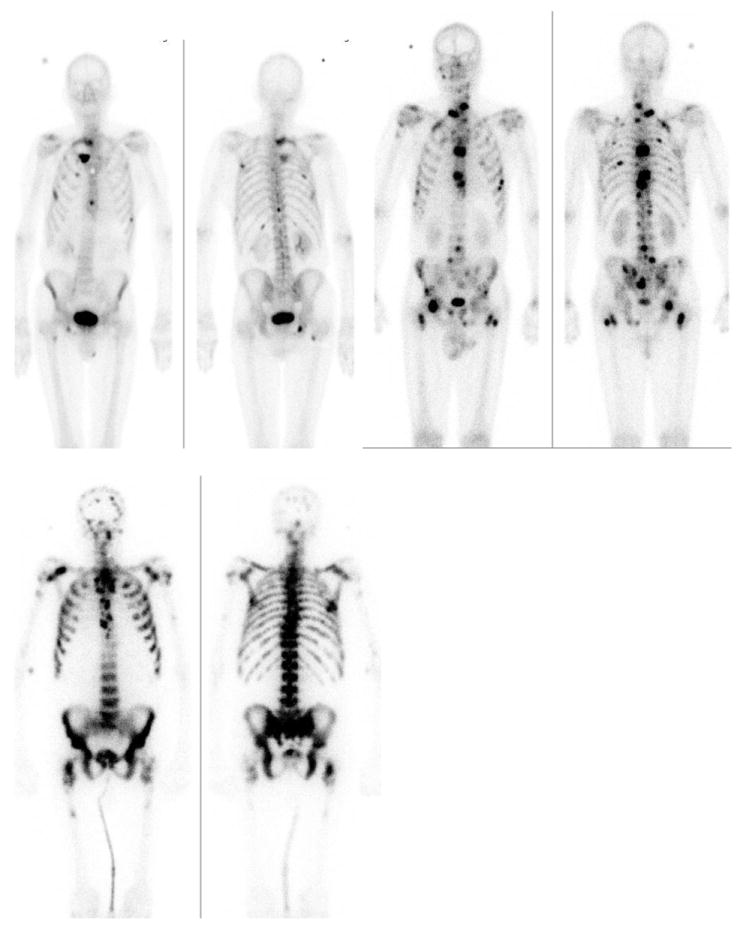
In patients with a small amount of disease, the automated and two separate manual BSI calculations typically agreed well (Fig. 3a), while some discord was found among patients with more extensive disease (Fig. 3b). The largest disagreement was observed for patients with extremely intense and pervasive hotspots on the bone scan, for which automated BSI measurements resulted in lower values compared to manual calculations (Fig. 3c).
Fig. 3. Patients from the evaluation group with automated Bone Scan Index (BSI) measurements of (a, top left) 1.1, (b, top right) 4.4, and (c, bottom) 12.8. The corresponding manual BSI measures were 1.2/1.0, 5.2/3.7, and 40.6/28.2, respectively.
One hundred thirty-three patients had a BSI measurement >0—indicative of metastatic disease—by either manual or automated calculations; 68 were scored as positive for metastatic disease by both methods. Overall, the correlation between manual and automated BSI calculations was high (ρ = 0.80; Fig. 4). Only 22 men had BSI scores that differed by more than 1 unit. The correlation between manual and automatic BSI values for those with manual BSI scores <10 was higher (ρ = 0.93). The intraobserver agreement for the two manual BSI ratings was high (ρ = 0.95; Fig. 5).
Fig. 4. Bland-Altman plot of manual and automated Bone Scan Index (BSI) readings. Two hundred thirty-four men had a negative (zero) score on manual and automated BSI (n = 384).
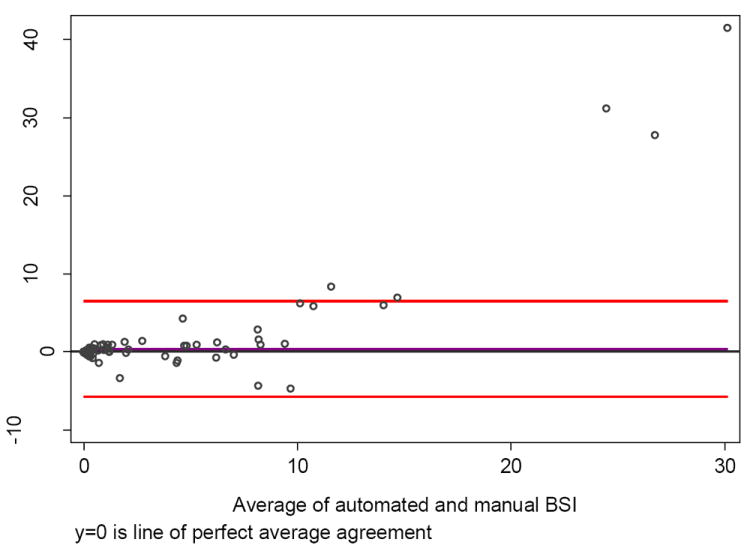
Fig. 5. Bland-Altman plot of two manual Bone Scan Index (BSI) readings. Fifty-one men had a negative (zero) score on manual and automated BSI (n = 133).

We next asked whether automated and manual BSI scores were predictive of outcome in this patient cohort. In total, 57 men died from PCa. The median follow-up of survivors was 6 yr after diagnosis. The 5-yr probability of dying from PCa was 13% (95% CI, 10–17). Those with higher automated BSI levels tended to have worse disease-specific survival than those with lower levels (Fig. 6). Both manual BSI and automated BSI measurements were independently associated with death from disease when individually added to a base model that included total PSA, clinical stage, and Gleason score (p < 0.0001 for both). When added to this base model, both the manual and automated BSI measurements improved the discrimination (C-index improved from 0.768 to 0.794 and 0.825, respectively; Table 2).
Fig. 6. Kaplan-Meier curve for death from prostate cancer among 384 men, stratified by automated Bone Scan Index (BSI) categories.
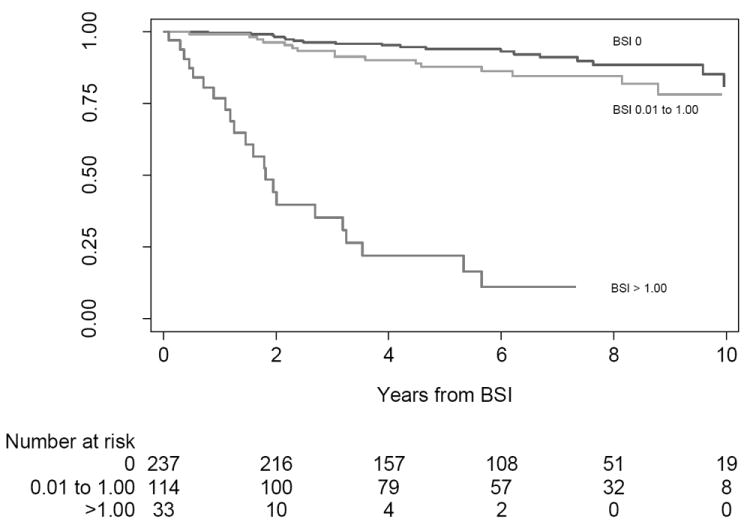
Table 2.
Discrimination of manual and automated Bone Scan Index values for prediction of prostate cancer–specific death, with and without the addition of total prostate-specific antigen and Gleason grade as predictors
| Parameter | C-index (95% CI) |
|---|---|
| Total PSA alone | 0.690 (0.574–0.783) |
| Gleason alone | 0.703 (0.610–0.762) |
| Clinical stage | 0.707 (0.688–0.702) |
| Base model: Total PSA + Gleason + clinical stage | 0.768 (0.702–0.837) |
| Manual BSI alone | 0.788 (0.766–0.798) |
| Automated BSI alone | 0.766 (0.737–0.770) |
| Manual BSI + base model | 0.794 (0.727–0.860) |
| Automated BSI + base model | 0.825 (0.754–0.881) |
| Combined BSI-1* + base model | 0.829 (0.805–0.846) |
| Combined BSI-2** + base model | 0.796 (0.773–0.814) |
C-index = concordance index; CI = confidence interval; PSA = prostate-specific antigen; BSI = Bone Scan Index.
If negative on manual BSI, then the patient was considered negative for metastasis; if positive, then the result from the automated BSI was used.
If negative on manual BSI, then the patient was considered negative for metastasis; if positive, then the result from the automated BSI was used, except if automated BSI was >5, in which case manual BSI was used.
Based on the performance of automated BSI scoring in our initial analyses, we next evaluated two algorithms that combined manual and automated BSI information. The first used the following algorithm: If negative on manual BSI calculation, then the patient was considered negative for metastasis; if positive, then the result from the automated BSI calculation was used. The second combination was the same as the first except that the manual BSI score was used for all men with automatic BSI scores >5 (n = 19). The performance of these combination scores is shown in Table 2. Both combined scores exhibited poorer or equal discrimination compared to a model with either manual or automated BSI scoring (Table 2).
4. Discussion
Owing to the tropism of PCa for bone and the morbidity associated with bone metastases, bone scintigraphy has emerged as a vital diagnostic tool for detecting and monitoring advanced PCa. The development of the BSI as a biomarker for global tumour involvement in bone has enhanced the value of bone scanning, allowing for clearer estimations of patient prognosis [15]. However, the time-consuming and tedious nature of the calculation has limited the widespread use of the BSI. In this report, we addressed these challenges by developing the first fully automated platform for calculating BSI from native imaging data. The software used in the study effectively segmented skeletal anatomy, detected and classified hotspots, and computed BSI scores, with trivial management required from the operator. In addition to the rapid processing times (<10 s) and with a reproducibility of 100% when remeasuring the same scan, automated BSI calculation was strongly and similarly correlated with poor clinical outcome compared to manual BSI, promoting its utility as a valuable tool in both the research and clinical realms.
Although our data show that the automated BSI calculation effectively substitutes for the manual version, we did note that the automated method tended to underestimate BSI scores in patients with extensive bone disease (manual BSI >10). However, exchanging the automatic BSI scores with manual BSI scores for cases with extensive disease (BSI >5) tended to decrease the accuracy in predicting PCa death. We are nonetheless currently refining our technology to minimise this disparity.
We further evaluated the performance of automated BSI scoring as a clinical risk predictor. Our data confirm the findings of earlier studies that manual BSI calculation is an independent marker for prediction of survival, and this finding can now be extended to the automated BSI calculation. Furthermore, we showed that calculation of the BSI at baseline confers incremental value above and beyond that of the established clinical parameters (ie, Gleason score, PSA, clinical stage) for prognostication of PCa-related death. The results from these risk prediction analyses were based on a large, highly representative, unscreened cohort of men with matching data from rigorous ascertainment of the cause of death, detailed and structured review of the medical charts, and extensive length of follow-up.
5. Conclusions
We have shown that automated BSI calculation, like its manual counterpart, is a valuable clinical parameter in patients with progressive PCa. Distinct advantages of the automated BSI calculation are its 100% reproducibility and rapid processing time. Although cost–benefit analyses are needed, we assume that automatic BSI calculations will most likely result in sufficient cost reductions, as manual BSI measurements require costly and extensive training of specialised personnel. Automated BSI measurements may prove complementary to PSA measures in blood, which fail to predict survival benefit in patients with castration-resistant PCa [16]. It is worth noting that the BSI does incorporate the intrinsic limitations of bone scans, most notably, the algorithm measures osteoblastic response to tumour rather than changes in tumour health itself. Also, the BSI relies on an estimate of healthy skeletal mass, which is certainly variable among men. Nevertheless, our results add to the growing body of work showing that useful prognostic information can be obtained by calculating the BSI. Future studies will focus on the ability of this automated software to accurately detect changes in the skeletal tumour burden over time, in particular, after therapy. If successful, automated BSI measurements will most likely be an applicable tool in the context of multicentre clinical trials for novel PCa therapies, where systematic markers of efficacy are sorely needed.
Take-home message.
We developed and evaluated the first unbiased, fully automated software system to systematically calculate skeletal tumour burden in patients with metastatic cancer in the bone, simplifying a valuable but cumbersome technology with shortcomings that had prevented its widespread clinical use.
Acknowledgments
Funding/Support and role of the sponsor: This study was supported by grants from the Swedish Research Council Medicine-20095, Swedish Cancer Society [3455], The Tegger Foundation, Lund University Medical Faculty ALF grants, the National Cancer Institute (grant numbers R33 CA 127768-02, P50-CA92629), the Sidney Kimmel Center for Prostate and Urologic Cancers, and David H. Koch through the Prostate Cancer Foundation.
Footnotes
Author contributions: Steven M. Larson had full access to all the data in the study and takes responsibility for the integrity of the data and the accuracy of the data analysis.
Study concept and design: Larson, Ulmert, Edenbrandt.
Acquisition of data: Ulmert, Fox, Yu, Gerdtsson, Lomsky, Richter, Sadik, Suurküla, Björk.
Analysis and interpretation of data: Savage, Höglund, Ohlsson, Ulmert, Edenbrandt, Yu.
Drafting of the manuscript: Ulmert, Larson, Fox, Morris, Evans, Edenbrandt, Lilja, Bjartell, Abrahamsson, Scher, Kaboteh.
Critical revision of the manuscript for important intellectual content: Ulmert, Evans, Larson, Edenbrandt, Lilja, Savage, Fox, Morris.
Statistical analysis: Savage, Höglund.
Obtaining funding: Ulmert, Edenbrandt, Larson, Lilja, Bjartell, Abrahamsson.
Administrative, technical, or material support: Edenbrandt, Lilja, Bjartell, Ohlsson, Richter, Sadik, Björk, Sjöstrand.
Supervision: Edenbrandt, Larson.
Other (specify): None.
Financial disclosures: I certify that all conflicts of interest, including specific financial interests and relationships and affiliations relevant to the subject matter or materials discussed in the manuscript (eg, employment/affiliation, grants or funding, consultancies, honoraria, stock ownership or options, expert testimony, royalties, or patents filed, received, or pending), are the following: Lars Edenbrandt, Mattias Ohlsson, Jens Richter, and Karl Sjöstrand are shareholders in EXINI Diagnostics AB (Lund, Sweden), which provides software for nuclear medicine studies.
Publisher's Disclaimer: This is a PDF file of an unedited manuscript that has been accepted for publication. As a service to our customers we are providing this early version of the manuscript. The manuscript will undergo copyediting, typesetting, and review of the resulting proof before it is published in its final citable form. Please note that during the production process errors may be discovered which could affect the content, and all legal disclaimers that apply to the journal pertain.
References
- 1.Jacobs SC. Spread of prostatic cancer to bone. Urology. 1983;21:337–44. doi: 10.1016/0090-4295(83)90147-4. [DOI] [PubMed] [Google Scholar]
- 2.Soloway MS, Hardeman SW, Hickey D, et al. Stratification of patients with metastatic prostate cancer based on extent of disease on initial bone scan. Cancer. 1988;61:195–202. doi: 10.1002/1097-0142(19880101)61:1<195::aid-cncr2820610133>3.0.co;2-y. [DOI] [PubMed] [Google Scholar]
- 3.Cooper CR, Chay CH, Gendernalik JD, et al. Stromal factors involved in prostate carcinoma metastasis to bone. Cancer. 2003;97:739–47. doi: 10.1002/cncr.11181. [DOI] [PubMed] [Google Scholar]
- 4.Carlin BI, Andriole GL. The natural history, skeletal complications, and management of bone metastases in patients with prostate carcinoma. Cancer. 2000;88:2989–94. doi: 10.1002/1097-0142(20000615)88:12+<2989::aid-cncr14>3.3.co;2-h. [DOI] [PubMed] [Google Scholar]
- 5.Mease RC. Radionuclide based imaging of prostate cancer. Curr Top Med Chem. 2010;10:1600–16. doi: 10.2174/156802610793176774. [DOI] [PubMed] [Google Scholar]
- 6.Schaffer DL, Pendergrass HP. Comparison of enzyme, clinical, radiographic, and radionuclide methods of detecting bone metastases from carcinoma of the prostate. Radiology. 1976;121:431–4. doi: 10.1148/121.2.431. [DOI] [PubMed] [Google Scholar]
- 7.Sadik M, Suurkula M, Hoglund P, Järund A, Edenbrandt L. Quality of planar whole-body bone scan interpretations—a nationwide survey. Eur J Nucl Med Mol Imaging. 2008;35:1464–72. doi: 10.1007/s00259-008-0721-5. [DOI] [PubMed] [Google Scholar]
- 8.Sadik M, Hamadeh I, Nordblom P, et al. Computer-assisted interpretation of planar whole-body bone scans. J Nucl Med. 2008;49:1958–65. doi: 10.2967/jnumed.108.055061. [DOI] [PubMed] [Google Scholar]
- 9.Sabbatini P, Larson SM, Kremer A, et al. Prognostic significance of extent of disease in bone in patients with androgen-independent prostate cancer. J Clin Oncol. 1999;17:948–57. doi: 10.1200/JCO.1999.17.3.948. [DOI] [PubMed] [Google Scholar]
- 10.Imbriaco M, Larson SM, Yeung HW, et al. A new parameter for measuring metastatic bone involvement by prostate cancer: the Bone Scan Index. Clin Cancer Res. 1998;4:1765–72. [PubMed] [Google Scholar]
- 11.Manjer J, Carlsson S, Elmståhl S, et al. The Malmö Diet and Cancer Study: representativity, cancer incidence and mortality in participants and non-participants. Eur J Cancer Prev. 2001;10:489–99. doi: 10.1097/00008469-200112000-00003. [DOI] [PubMed] [Google Scholar]
- 12.Berglund G, Eriksson KF, Israelsson B, et al. Cardiovascular risk groups and mortality in an urban Swedish male population: the Malmö Preventive Project. J Intern Med. 1996;239:489–97. doi: 10.1046/j.1365-2796.1996.483819000.x. [DOI] [PubMed] [Google Scholar]
- 13.International Commission on Radiological Protection. Report of the Task Group on the Reference Man. ICRP Publication 23. New York, NY: Pergamon Press; 1975. [Google Scholar]
- 14.Cross SS, Harrison RF, Kennedy RL. Introduction to neural networks. Lancet. 1995;346:1075–9. doi: 10.1016/s0140-6736(95)91746-2. [DOI] [PubMed] [Google Scholar]
- 15.Erdi YE, Humm JL, Imbriaco M, Yeung H, Larson SM. Quantitative bone metastases analysis based on image segmentation. J Nucl Med. 1997;38:1401–6. [PubMed] [Google Scholar]
- 16.Ulmert D, O’Brien MF, Bjartell AS, Lilja H. Prostate kallikrein markers in diagnosis, risk stratification and prognosis. Nat Rev Urol. 2009;6:384–91. doi: 10.1038/nrurol.2009.123. [DOI] [PMC free article] [PubMed] [Google Scholar]