

Abstract
Ubiquitous and unobtrusive in-home monitoring has the potential to detect physical and mental decline earlier and with higher precision than current clinical methods. However, given that this field is in its infancy, the specific metrics through which these changes are detected are not well defined. The work presented here offers room-transitions, the act of physically moving from one area of a home to another, as a quantifiable measure for total daily activity that can be inferred from a network of passive infrared sensors. We describe a method to calculate this value from raw sensor data and validate this method on an acute health event: an 18-day quarantine at a retirement community that was initiated in the midst of a norovirus outbreak. The results from this case study show that room-transition values increased significantly as subjects remained in their homes during the quarantine, demonstrating a mean increase of 12 transitions per day. Furthermore, a time-adjusted measure of room-transitions is examined that did not significantly change across the group. Finally, the healthy subjects and those that fell ill were analyzed separately, and significant differences were found between them for both the raw and time-adjusted metrics. As detection algorithms improve, these types of measures may be useful in the early detection of a change in health status.
I. INTRODUCTION
Telehealth or eHealth is a primary component of the paradigm shift in our modern heath care system; a transition from relying solely on in-person visits to providing assessments based on multiple streams of information delivered from remote locations [1]. The advantages of adopting such a system are clear: by increasing the frequency of testing and decreasing the overhead required to make these assessments patients can receive better care at a lower cost [2]. While these potential advantages alone justify telehealth research, a rapidly aging nation makes the matter more urgent. As more baby boomers reach retirement age they may place an unprecedented strain on the current system that could manifest itself as a noticeable decrease in the expected quality of care [3]. For this reason it is especially vital to examine telehealth solutions in the context of eldercare.
Within the telehealth field there exists a subset of research focused on monitoring in-home activities with the goal of detecting long-term and/or short-term changes in cognitive and/or physical health. The specific tools and configurations vary widely between groups, but tend to employ some combination of passive infrared (PIR) sensors, pressure sensors, video cameras, microphones, radio-frequency-identification (RFID) tags, and computer tracking software [4,5]. These approaches may be generally applied to a home or may be more device specific (e.g., instrumented scales or medication dispensers). Data from these sources are typically collected continuously to provide exhaustive information on the habits and activities of the resident(s) where they are installed. Accordingly, one of the main challenges in this area is determining which incoming information is useful and which can be ignored.
In order to intelligently assess the information from these ubiquitous and persistent data streams, metrics have been introduced that correlate either with established clinical tests or significant clinical outcomes. For example, keystroke data collected from home computers has shown that the pace of typing familiar login sequences is correlated with performance on a finger tapping test [6]. Other research has shown that an array of spatially restricted PIR sensors can measure walking speeds and that these values are predictors of physical and cognitive decline [7]. Finally, it has been demonstrated that the activities of daily living (ADLs) can be inferred from a network of RFID detectors [8]. These studies serve as a reminder that the usefulness of a connected home is limited by the quality of the metrics that can be extracted.
One important indicator of cognitive and physical health is daily activity, a loosely defined term that, in essence, measures the energy expended by a person as they conduct their daily lives. To some extent, clinical measures such as the Human Activity Profile (HAP) quantify activity levels, but these tend to focus on one's self-reported capabilities rather than real-life data [9]. At face value, an assessment of actual daily activity seems like a good candidate for the early detection of a decline in health, as these patterns may change when a person subconsciously adjusts a routine; however, daily activity is especially prone to the cyclical nature of our lives – as what we do is largely driven by the day of the week and the time of the year – and, thus, must be measured in short intervals for a proper analysis.
Previous studies utilizing PIR sensors have assessed daily activity as the sum of all sensor activations [10, 11]. These values can be meaningful in a longitudinal analysis, or in those homes where the layout is consistent and well defined, but suffers from a serious drawback: a sensor firing alone does not suggest activity requiring effort. Depending on the layout and orientation of the furnishings and equipment, a sensor will fire intermittently as a person eats, reads, watches television, or even sleeps. The accumulation of these firings over an extended period of time may overestimate these periods as ones of high activity, masking the data derived from more physically demanding, but more episodic or briefly occurring, events. Accordingly, we hypothesized that larger physical movements represented by room-to-room transitions of residents in their home would be a simple, but valid measure of daily activity requiring movement about the home.
In this paper, we test this hypothesis and validity of this approach by examining patterns of behavior derived from PIR sensor data before and during a period of quarantine at a retirement community that was put in place to suppress an outbreak of the norovirus. By detecting an across-the-board within-person change in activity during an acute event we show that room-transitions are a robust measure of daily activity that can be applied in cross-sectional and longitudinal analyses. Additionally, a measure of room-transitions adjusted for the time spent at home is presented to show that those subjects affected by illness had significant changes in their daily patterns while the others did not.
II. BACKGROUND
The Intelligent Systems for Assessing Aging Changes (ISAAC) study is comprised of 225 elders living in and around the Portland, Oregon (USA) area. Each participant is monitored via an un-obtrusive system of PIR sensors. This system consists of the following: one motion sensor in each room of the house or apartment, one set of four restricted view motion sensors placed in series in a narrow, high-traffic area in order to evaluate walking speeds, and contact sensors on each exiting door and refrigerator. Additionally, subjects are provided with a personal computer that tracks their logins and computer use statistics. We also collect a weekly online questionnaire pertaining to the residents' health and activities. Full details of study enrollment and assessment procedures are provided elsewhere [12].
Among the ISAAC cohort, 58 homes are installed at the same retirement community. The sizes and layouts of these homes vary widely from single bedroom apartments to fully detached single family homes. As a result, the group within this set is not homogenous. At this location meals are provided and a number of activities are offered, so the typical resident lives an active lifestyle.
In March of 2010 an acute gastrointestinal virus began to spread throughout this retirement community, quickly accelerating into an outbreak. On March 24th a community-wide activity restriction was requested of all residents to quell further proliferation; residents were informed that meals would be delivered to their apartments and all group activities were cancelled. The quarantine lasted until April 11th. This acute health event provides a unique and valuable set of data on which to test a room-transitions algorithm, as one would expect to find a significant increase in total activity in the homes of the residents within this community. Furthermore, one would expect to find little change in an activity measure adjusted for the time spent at home for those subjects that did not suffer from the virus.
III. METHODS
The first objective in our analysis is to clearly define the method for evaluating room-transitions from PIR motion data, a task done in four steps: collapsing subsequent firings from the same sensor, filtering data to remove extraneous events, collapsing subsequent firings a second time, and calculating room-transitions as the cardinality of the remaining set. These will now be described in detail.
Raw PIR activity is collected as pairs of data: a timestamp describing when motion has occurred and a code mapped to specific areas of the home describing where motion has occurred. An example of this data is given in Table I; this exemplary set will be used throughout the methods section.
TABLE I.
EXAMPLE OF RAW PIR MOTION DATA
| Timestamp | Code | Mapped Room |
|---|---|---|
| 2010-03-10, 13:25:30.145 | H8 | Dining Room |
| 2010-03-10, 13:25:45.681 | H8 | Dining Room |
| 2010-03-10, 13:26:05.275 | H8 | Dining Room |
| 2010-03-10, 13:35:21.792 | J10 | Living Room |
| 2010-03-10, 13:45:13.134 | J10 | Living Room |
| 2010-03-10, 13:46:50.054 | K11 | Bedroom |
Symbolically, raw PIR activity data is described as a series of timestamps subscripted with an associated area, r. This is shown in (1) without dates and milliseconds for clarity.
| (1) |
As a first step in the processing of this raw signal, we collapse subsequent firings from the same mapped area; the idea being that repeat firings reinforce our confidence that the subject is present in the room being reported, but do not suggest movement between rooms. Information regarding the amount of consolidation is stored as a superscript, c, in the newly reduced series. This is given in (2).
| (2) |
This collapsed set is then filtered for extraneous firings to create a new set f. In this work we exclude entries where the dwell time is less than 30 seconds and only one firing has occurred, or
| (3) |
After applying this filter, the data is consolidated once more, in an identical way to the first step, as removed entries may have introduced new sections where subsequent elements have matching areas.
We now define room-transitions as the cardinality of this set and examine the results on a per-day basis. That is to say, room-transitions, s, is a new series, indexed by the date, d, and extracted from the set f where the date portion of the timestamp is equal to the date in question, or
| (4) |
Finally, it is important to introduce one more measure: time spent at home per day, a series denoted by h and subscripted by the date d. It varies from 0 to 1 and represents the fraction of the day spent inside the home or apartment. This data is extracted from the PIR activity data and the methods for its calculation are described in detail elsewhere [13]. We will use it in this analysis as we examine not only raw room-transition values, sd, but also a time-normalized measure,
| (5) |
IV. ANALYSIS
Before applying the room-transitions method to the 58 homes at the retirement community with the quarantine, a number of exclusionary criteria were set and applied. Because of the preliminary nature of this analysis, these criteria were quite strict and required that homes have complete and consistent data. Specifically, the requirements were
Subjects must be living alone.
Subjects must have been living at home for the duration of the quarantine and the 18 days before the period of quarantine.
Sensors from each room and the front door must have been operating reliably during the periods before and during the quarantine.
Of the 58 total homes, 20 failed to meet the first requirement, 9 failed to meet the second, and 11 failed to meet the third, leaving a cohort of 18 clean and complete homes on which to test the room-transitions method.
Room-transition values were calculated for each home for the 17 day period before the initiation of the quarantine and the 17 days after the initiation of the quarantine. The actual day that the quarantine began is not included in the analysis. This results in 18 pairs of data sets, representative of total activity before and during event. These will be referred to as sb and sa for the periods before and after, respectively.
To determine how activity patterns changed, we calculated the difference between the median values of the metrics, room-transitions and time-adjusted room-transitions, before and after the quarantine, as well as the percentage increase. Additionally, we examined information on which subjects reported an illness or depression during the period of quarantine. These data are given in Table II.
TABLE II.
CHANGE IN THE MEDIAN OF ROOM-TRANSITIONS AND TIME-ADJUSTED ROOM-TRANSITIONS FOR EACH HOME
| Home | Percent Change | Percent Change | Healthy | ||
|---|---|---|---|---|---|
| 1 | 32 | 23 | 7.2 | 4 | Yes |
| 2 | 25 | 17 | 10.7 | 7 | Yes |
| 3 | 3 | 3 | 4.5 | 5 | Yes |
| 4 | −15 | −31 | −22.1 | −40 | No |
| 5 | 11 | 22 | −4.6 | −6 | Yes |
| 6 | 14 | 26 | 9.3 | 15 | Yes |
| 7 | −8 | −10 | −17.8 | −20 | No |
| 8 | 9 | 12 | −3.0 | −3 | Yes |
| 9 | 3 | 3 | 0.4 | <1 | Yes |
| 10 | 2 | 4 | −8.8 | −11 | Yes |
| 11 | 15 | 9 | −24.1 | −11 | Yes |
| 12 | 18 | 21 | 5.5 | 5 | Yes |
| 13 | 27 | 33 | 27.0 | 33 | Yes |
| 14 | −20 | −20 | −41.6 | −34 | No |
| 15 | 57 | 36 | 42.0 | 24 | Yes |
| 16 | 16 | 20 | 15.9 | 16 | Yes |
| 17 | 5 | 4 | −4.4 | −3 | Yes |
| 18 | 19 | 44 | 17.5 | 39 | Yes |
From this set of data, we now test the following hypotheses. First, among the entire group, regardless of how they were affected by the virus, we expect an increase in the number of total room-transitions, as the residents spent more time in their homes. Second, we examine the time-adjusted room-transitions values across the entire group, with the expectation that these measures would not change significantly during the quarantine. Finally, we check for differences in both metrics between the 15 healthy subjects and the 3 that fell ill, in order to assess the ability of a room-transitions measure to detect changes in activity due to health problems.
The change in median room-transition values increased by a mean value of 12 transitions per day for the 18 residents and a two sided t-test at the 5% level found this increase to be significant, with a p-value of 0.01; conversely, the time-adjusted room-transition value increased by only 1 transition per day, a change that was not found to be significant by the same t-test. The p-value for this second test was 0.87. These findings are consistent with our expectations.
By extracting homes 4, 7, and 14 from the larger set, we can now compare the differences between room-transition values of a healthy cohort (n=15) and an unhealthy one (n=3). Both the healthy and unhealthy sets were modeled as having a normal distribution. The healthy set had a mean increase in room-transitions of 17 rooms per day and the unhealthy set had a decrease of 14 rooms per day. A two-sample, one-sided, t-test, assuming unequal variance and conducted at the 5% level, found this to be a significant difference with a p-value of 0.0002. These results are shown graphically in Fig. 1.
Fig. 1.
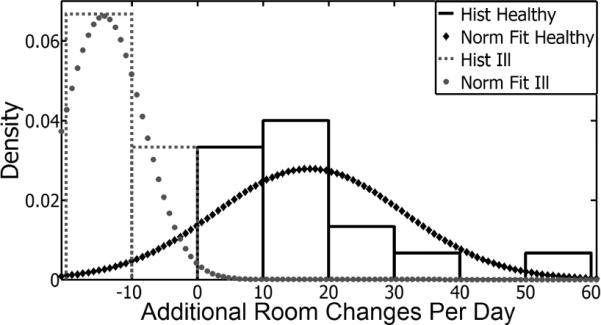
An examination of the median room-transition values during and before the quarantine shows that activity levels changed differently between the healthy and unhealthy groups.
An identical analysis was performed on the time-adjusted room-transition values. In this case, the healthy set had a mean increase of 6 transitions per day and the unhealthy set had a mean decrease of 27 transitions per day. Once again, a two-sample, one-sided t-test at the 5% level and assuming unequal variance found this change to be significant, with a p-value of 0.011. These results are given graphically in Fig. 2.
Fig. 2.
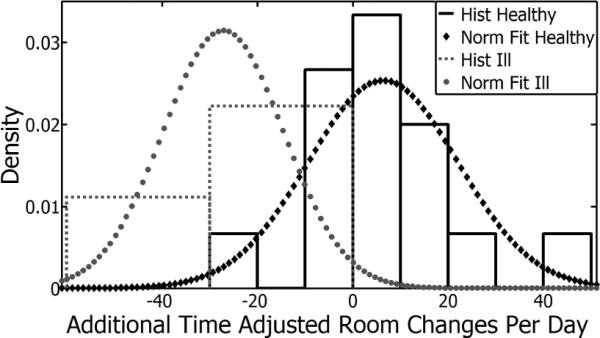
Room-transition values that were adjusted for the amount of time spent at home also varied between the set of healthy and unhealthy subjects.
These findings suggest that room-transitions are a meaningful measure of activity, and that this measure is sensitive to a subject's physical and mental wellbeing. Although work is still required to define a threshold to alert these changes, separation between the sets in this case study suggests feasability.
V. DISCUSSION
By examining activity patterns surrounding the initiation of a period of quarantine in a retirement community, we showed that raw room-transition values are a reasonable metric for daily activity. Overall, an average increase of 12 room transitions per day was calculated and this change was found to be statistically significant. Additionally, a time-adjusted room-transitions measure was analyzed and found to be characteristic of subject behavior. Across the entire group this measure did not change, as at-home behaviors only changed slightly.
Additionally, the room-transitions and time-adjusted room-transitions metrics were found to be significantly different between the population that remained healthy, and those subjects affected by the virus. Raw room-transition values had greater separation in this case, but it may be more realistic to assess time-adjusted room-transition values as a pervasive eHealth solution, as the data here was collected under unique circumstances.
Ultimately, one goal of this work is to create algorithms that can predict, or quickly detect, physical and/or mental decline. By examining room-transitions in the context of an acute heath event, we have shown the potential for PIR motion data to contain information about activity patterns across a group and for single subjects. This type of measure may be a major component to future detection methods.
Acknowledgment
The authors would like to thank the participating retirement community and all of their residents for their cooperation in this project.
This work was supported in part by the National Institute of Health and the National Institute on Aging under Grants R01AG024059, P30 AG024978, and P30AG008017. This work was also partially funded by Intel Corporation. Dr. Hayes has a significant financial interest in Intel Corporation, a company that may have a commercial interest in the results of this research and technology.
Footnotes
This potential conflict has been reviewed and managed by OHSU.
References
- [1].Pagliari C, Sloan D, Gregor P, Sullivan F, Detmer D, Kahan J, et al. What is eHealth (4): A Scoping Exercise to Map the Field. Journal of Medical Internet Research. 2005;7:e9. doi: 10.2196/jmir.7.1.e9. [DOI] [PMC free article] [PubMed] [Google Scholar]
- [2].Kaye JA, Zitzelberger TA. Overview of Healthcare, Disease, and Disability. In: Bardram JE, Mihailidis A, Wan D, editors. Pervasive Computing in Healthcare. CRC Press; 2006. [Google Scholar]
- [3].Schneider E. Aging in the third millennium. Science. 1999;283:796–797. doi: 10.1126/science.283.5403.796. [DOI] [PubMed] [Google Scholar]
- [4].Hayes TL, Abendroth F, Adami A, Pavel M, Zitzelberger TA, Kaye JA. Unobtrusive assessment of activity patterns associated with mild cognitive impairment. Alzheimer's and Dementia. 2008;4:395–405. doi: 10.1016/j.jalz.2008.07.004. [DOI] [PMC free article] [PubMed] [Google Scholar]
- [5].Skubic M, Alexander G, Popescu M, Rantz M, Keller J. A smart home application to eldercare: Current status and lessons learned. Technology and Healthcare. 2009;17:183–201. doi: 10.3233/THC-2009-0551. [DOI] [PubMed] [Google Scholar]
- [6].Austin D, Jimison H, Hayes TL, Mattek N, Kaye JA, Pavel M. Measuring motor speed through typing: a surrogate for the finger tapping test. Behavior Research Methods. doi: 10.3758/s13428-011-0100-1. To be published. [DOI] [PMC free article] [PubMed] [Google Scholar]
- [7].Hagler S, Austin D, Hayes TL, Kaye JA, Pavel M. Unobtrusive and Ubiquitous In-Home Monitoring: A Methodology for Continuous Assessment of Gait Velocity in Elders. IEEE Transations on Biomedical Engineering. 2010;57:813–820. doi: 10.1109/TBME.2009.2036732. [DOI] [PMC free article] [PubMed] [Google Scholar]
- [8].Philipose M, Fishkin KP, Perkowitz M, Patterson DJ, Fox D, Kautz H, Hahnel D. Inferring activities from interactions with objects. IEEE Pervasive Computing. 2004;3:50–57. [Google Scholar]
- [9].Davidson M, de Morton N. A systematic review of the Human Activity Profile. Clinical Rehabilitation. 2007;21:151–162. doi: 10.1177/0269215506069475. [DOI] [PubMed] [Google Scholar]
- [10].Banerjee S, Steenkeste F, Couturier P, Debray M, France A. Telesurveillance of elderly patients by use of passive infra-red sensors in a `smart' room. Journal of Telemedicine and Telecare. 2003;9:23–29. doi: 10.1258/135763303321159657. [DOI] [PubMed] [Google Scholar]
- [11].Wang S, Skubic M. Density map visualization from motion sensors for monitoring activity level. Intelligent Environment, 2008 IET 4th International Conference. [Google Scholar]
- [12].Kaye JA, Maxwell SA, Mattek N, Hayes TL, Dodge H, Pavel M, et al. Intelligent Systems for Assessing Aging Changes: Home-Based, Unobtrusive and Continuous Assessment of Aging. Journal of Gerontology. doi: 10.1093/geronb/gbq095. To be published. [DOI] [PMC free article] [PubMed] [Google Scholar]
- [13].Hayes TL, Riley T, Pavel M, Kaye JA. Comparison of Novel Daily Objective Sleep Measure and Self-Report. poster session presented at the 24th Annual Meeting of the Associated Professional Sleep Societies; USA. Jun, 2010. [Google Scholar]