

Abstract
The effect of separation by biogeographic features followed by secondary contact can blur taxonomic boundaries and produce complex genetic signatures. We analyzed population structure and gene flow across the range of the long-tailed finch (Poephila acuticauda) in northern Australia (1) to test the hypothesis that Ord Arid Intrusion acted as the causative barrier that led to divergence of P. acuticauda subspecies, (2) to determine whether genetic data support the presence of a gradual cline across the range or a sudden shift, both of which have been suggested based on morphological data, and (3) to estimate levels of contemporary gene flow within this species complex. We collected samples from 302 individuals from 10 localities. Analyses of 12 microsatellite loci and sequence data from 333 base pairs of the mitochondrial control region were used to estimate population structure and gene flow, using analysis of molecular variance (AMOVA), haplotype network analysis, frequency statistics, and clustering methods. Mitochondrial sequence data indicated the presence of three genetic groups (regions) across the range of P. acuticauda. Genetic diversity was highest in the east and lowest in the west. The Ord Arid Intrusion appears to have functioned as a biogeographic barrier in the past, according to mtDNA evidence presented here and evidence from previous studies. The absence of isolation by distance between adjacent regions and the lack of population genetic structure of mtDNA within regions indicates that genetic changes across the range of P. acuticauda subspecies are characterized by discrete breaks between regions. While microsatellite data indicate a complete absence of genetic structure across this species’ range, it appears unlikely that this results from high levels of gene flow. Mitochondrial data do not support the presence of contemporary gene flow across the range of this species.
Keywords: Long-tailed finch, microsatellite, mitochondrial control region, northern Australian biogeography, Ord Arid Intrusion, Poephila acuticauda
Introduction
Australia's northern tropics harbor a wide range of species associated with distinct biogeographic areas and the range boundaries of many of these species are often concordant, suggesting vicariance (Keast 1961; Ford 1978; Bowman et al. 2010). However, current species distributions are the result of a multitude of processes operating over various time scales, impeding a clear understanding of their history. This is especially true in cases where a biogeographic barrier separated a taxonomic group for a period of time and then subsided, allowing secondary contact. Analysis of genetic data in the context of biogeography offers an approach that can elucidate the history of these species (Bowman et al. 2010), especially if genetic markers are chosen that reflect population history over multiple time scales (York et al. 2008; Taylor et al. 2011; Zarza et al. 2011).
The genetics of many extant species reflect events that occurred during the most recent glacial maximum, when advancing ice sheets resulted in the formation of refugia (Hewitt 2004). However, in Australia, species’ range contractions into refugia were in response to aridity (Keast 1961), which was extreme during this period (De Deckker 2001). In northern Australia, two refugia were proposed by Keast (1961), the “northwest” and the “northeast.” The northwest refugium was bounded by the Great Sandy Desert to the west and an arid zone at the head of the Gulf of Carpentaria to the east. Further east of Carpentarian barrier was the northeast refugium in Cape York. Phylogenetic analyses across many taxa support the Carpentarian barrier (Macdonald 1969; Cracraft 1991; Lee and Edwards 2008; Toon et al. 2010), although exceptions exist (Kearns et al. 2010). Ford (1978) proposed a “minor” biogeographic barrier splitting Arnhem Land and the Kimberley (Bonaparte barrier), more recently termed the “Ord Arid Intrusion” (Bowman et al. 2010). Many vicariant pairs of bird species and subspecies are located to either side of this barrier (Ford 1978). However, the precise boundaries of this barrier have not been defined.
One species complex that demonstrates divergence across the Carpentarian barrier and the Ord Arid Intrusion is found in the Australian grass finch genus Poephila. Poephila cincta (black-throated finch) are found to the east of the Carpentarian barrier and P. acuticauda (long-tailed finch, Fig. 1) are found to the west, ranging from Barkly Tableland in western Queensland, throughout the Northern Territory and the Kimberley region of western Australia (Higgins et al. 2006). Two subspecies of P. acuticauda are recognized: these are phenotypically similar except in regard to bill color, those in the east of the range (P. a. hecki) have red bills and those to the west (P. a. acuticauda) have yellow bills. Divergence between P. cincta and P. acuticauda has been dated at approximately 0.6 million years ago, while the divergence between P. a. acuticauda and P. a. hecki has been estimated at 0.3 million years ago based on multiple nuclear gene trees (Jennings and Edwards 2005).
Figure 1.
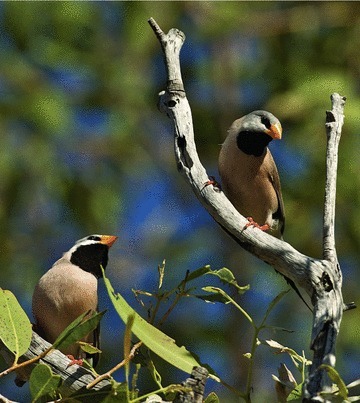
Pair of long-tailed finches (Poephila acuticauda), Western Australia. Photo by Sarah Pryke.
The subspecies designation of P. acuticauda has been debated by Keast (1958) and many others since, primarily based on bill coloration. Mayr et al. (1968) and Immelmann (1982) suggested that bill coloration was clinal, possibly signifying a single taxonomic group whereas others indicate that coloration changes abruptly near the eastern edge of the Kimberley (Harrison 1974; Boles 1988; Schodde and Mason 1999), which coincides with location of the Ord Arid Intrusion. Additionally, intergradation between yellow and red forms (expressed intermediate phenotypes) occurs in the vicinity of the Ord Arid Intrusion (Schodde and Mason 1999) and, in captivity, crosses between the two forms produce orange-billed offspring (Higgins et al. 2006) suggesting that coloration is genetically based. In addition to differences in bill-color, distinct differences in song structure between the two forms (sampled from either side of the Ord Arid Intrusion) have been identified (Zann 1976).
Genetic analyses of P. acuticauda are limited to Jennings and Edwards’ (2005) phylogeographic study of 30 nuclear loci in a single individual of each form, taken from locations in western Queensland and the western Kimberley (near Chidna and Mt. House, respectively, Fig. 2) from the extreme ends of the species distribution. While their study provided well-supported evidence for historical divergence between the two forms, their approach was not intended to address contemporary population structure. Here, we use mitochondrial DNA (mtDNA) sequence and microsatellite genotyping of multiple individuals sampled across the range of P. acuticauda to address the following questions: (1) did the Ord Arid Intrusion act as an agent of vicariance in this species complex, (2) is there evidence to support a gradual genetic mixing of populations sampled across the range or do genetic data support the presence of a discrete break in population structure resulting in either two genetic groups separated by the geographical area upon which the Ord Arid Intrusion was situated or three groups comprised of localities from the vicinity of the Ord Arid Intrusion and those to the east and west of this area (Fig. 2), and (3) is there evidence of current gene flow across the range of this species complex? We place the genetic results of the current study, those from Jennings and Edwards (2005) and evidence of phenotypic difference, in the context of whether the Ord Arid Intrusion has shaped and continues to shape the history of this species.
Figure 2.
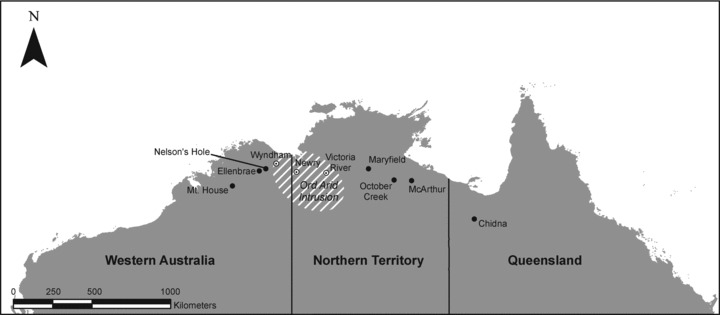
Map of sampling localities across the range of P. acuticauda (northern Australia). Open circles indicate localities in the vicinity of the Ord Arid Intrusion.
Materials and Methods
Field sampling and laboratory procedures
Blood samples were collected from 302 long-tailed finches from 10 localities across the species’ range (Fig. 2). This included three localities from the vicinity of the historical Ord River Intrusion (Bowman et al. 2010) hereafter referred to as the “central” region (Wyndham, Newry, Victoria River), three to the west of this putative barrier (“western”; Mt. House, Ellenbrae, Nelson's Hole), and four to the east (“eastern”; Maryfield, October Creek, McArthur, Chidna). Global Positioning System readings were taken at each sampling locality. DNA was extracted using a Gentra PureGene kit (Qiagen, Valencia, CA, USA) following manufacturer's instructions.
A segment of the mtDNA control region was sequenced in 30 individuals per population where available (Table 1) using primers paCRL1 (5′-TGT-AGG-ATA-GCC-AAT-GTC-ATA-CG) and paCRH1 (5′-CGC-CTG-AAG-CCA-ATA-ACC-TA). These primers were designed in Primer3 (Rozen and Skaletsky 2000) using consensus sequence between the zebra finch (Taeniopygia guttata, GenBank #DQ453512-5) and the black-throated finch (GenBank #AY324294). PCR reactions for the mtDNA sequence contained approximately 30 ng of genomic DNA, 2 pmoles of each primer, 1× buffer, 3.5 mM MgCl, 200 µM dNTPs, and 0.2 units of AmpliTaq Red (Applied Biosystems, Foster City, CA, USA). Cycling conditions included a five-min step at 94°C; 30 cycles of 94°C for 30 sec, 53°C for 15 sec, and 72°C for 30 sec; and a final extension step for 10 min at 72°C. PCR products were cleaned using ExoSAP-IT (USB Corporation, Cleveland, OH, USA). Big-Dye chemistry (Applied Biosystems) was used in sequencing reactions and products were ethanol precipitated and run on an Applied Biosystems 3730. A subset of samples was sequenced in the reverse direction to assure accuracy of nucleotide identification. All individuals assigned singleton haplotypes were sequenced twice to rule out sequencing error. Sequences were edited in ChromasLite version 2.0 and any samples having unclear electropherograms were sequenced again. Accepted sequences were aligned using ClustalX2 version 2.0.5 (Thompson et al. 1997) and trimmed to a uniform length of 333 base pairs (bp). We considered this sequence to be genuine mitochondrial DNA because double peaks were not identified in any position and because of the close match between the central haplotype in our network (Hap A, see below and Fig. 3) and to previously identified control region sequence of the congener P. cincta (95% match, GenBank #AY324294).
Table 1.
Mitochondrial sequence diversity for each sampling locality including sample size (N), number of private haplotypes (NPH), number of haplotypes (NH), haplotype richness (HR), and haplotype diversity (h) with standard errors (SE).
| Locality | N | NPH | NH | HR | h (±SE) |
|---|---|---|---|---|---|
| Western | |||||
| Mt. House | 32 | 1 | 4 | 2.1 | 0.33 (0.10) |
| Ellenbrae | 18 | 0 | 1 | 0 | 0 |
| Nelson's Hole | 30 | 1 | 5 | 3.1 | 0.46 (0.11) |
| Central | |||||
| Wyndham | 30 | 1 | 6 | 4.0 | 0.73 (0.05) |
| Newry | 24 | 1 | 6 | 4.2 | 0.73 (0.06) |
| Victoria River | 20 | 0 | 3 | 2.0 | 0.62 (0.08) |
| Eastern | |||||
| Maryfield | 30 | 6 | 12 | 8.2 | 0.89 (0.04) |
| October Creek | 30 | 1 | 6 | 4.5 | 0.83 (0.03) |
| McArthur | 30 | 4 | 9 | 5.6 | 0.81 (0.04) |
| Chidna | 30 | 4 | 8 | 5.4 | 0.75 (0.07) |
Figure 3.

Network depicting evolutionary relationships between mitochondrial DNA haplotypes of P. acuticauda samples from northern Australia. Circle size indicates proportion of individuals assigned that haplotype. Solid lines connecting haplotypes are proportional to the number of mutations separating them. Dotted lines represent resolved network ambiguities, each representing a single mutational step. Open squares denote positions of unsampled intermediate haplotypes. Black shading represents proportions from the eastern localities, gray represents proportions in central localities, and white represents the proportions in the west. The network is rooted to the congener P. cincta.
We analyzed 12 cross-specific microsatellites including: Indigo41 (Sefc et al. 2001); TG01–000, TG02–088, TG03–031, TG04–012, TG05–046, TG11–011, TG22–001 (Dawson et al. 2010); Tgu1, Tgu3, Tgu12 (Forstmeier et al. 2007); and Titgata02 (Wang et al. 2005). Microsatellites were amplified in three multiplex PCR reactions using a Qiagen Multiplex Kit. One multiplex contained Dawson et al. (2010) primers and followed their protocol. The second multiplex contained Indigo41, Tgu1, Tgu3, and Tgu12 and was run using a step-down PCR program consisting eight cycles each at the following annealing temperatures: 70°C, 64°C, 58°C, 54°C, and 50°C. A third PCR contained Titgata02 and was run using a step-down program containing nine cycles each at the following annealing temperatures: 64°C, 60°C, 56°C, 53°C, and 50°C. The second and third reactions were combined prior to genotyping. Samples were genotyped on an ABI 3730 (Applied Biosystems) using GS-500 (Liz) in each capillary as a size standard. Allele sizes were estimated on GeneMapper version 3.7 (Applied Biosystems). A subset of individuals (N= 112) from Mt. House, Nelson's Hole, and October Creek (Fig. 2) were sexed using multiplexed sex-linked markers 3007F, 2987F, and 3112R (Fridolfsson and Ellegren 1999) following Gilby et al. (2011).
Statistical analyses
Mitochondrial DNA sequence
We examined genetic diversity by calculating for each sample the number of haplotypes (NH) and haplotype diversity (h) (the probability that two haplotypes randomly chosen from the sample are different) in Arlequin version 3.5 (Excoffier et al. 2005). We also calculated haplotype richness (HR) in Contrib version 1.02 (Petit et al. 1998), which uses a rarefaction procedure to adjust for unequal sample sizes. The number of private haplotypes (NPH) (i.e., those found in only one locality) was calculated manually. We used Network version 4.6.0.0 (Bandelt et al. 1999) to construct a median-joining network to investigate evolutionary relationships among haplotypes. This method combines a minimum spanning approach representing all possible shortest trees with a maximum parsimony algorithm that removes superfluous links. Network ambiguities were solved following Pfenninger and Posada (2002).
Pairwise FST values between sampling localities were calculated in Arlequin using the Kimura 2-parameter model and P-values were Bonferroni corrected for multiple testing. Due to the presence of significant FST values between localities (see below), we used analysis of molecular variance (AMOVA) (Excoffier et al. 1992) to determine which of the following hypotheses our data best fit: (1) sampling localities would represent two genetic groups divided by the historical Ord Arid Intrusion or (2) sampling localities would be divided into three genetic groups represented by one to the eastern, central, and western regions defined above. For the former hypothesis, we separated localities to the east and west of the estimated geographic center of the Ord Arid Intrusion (i.e., a division between Victoria River and Newry, Fig. 2). The AMOVA having the lowest amount of variance among regions would indicate which hypothesis was most likely. Mantel tests implemented in ARLEQUIN were used to determine if there was evidence for a relationship between genetic (Slatkin's linear FST) and geographic distance (kilometers).
Microsatellite analyses
Microsatellite data were checked for departures from Hardy– Weinberg in Arlequin and for linkage disequilibrium using Genepop version 4.0 (Rousset 2008). Fstat version 2.9.3.2 (Goudet 1995; 2001) was used to calculate the total number of alleles (NA), the number of private alleles (NPA), allelic richness (R), gene diversity (GD), and allele frequencies. The method used to calculate R incorporates a rarefaction method (Mousadik and Petit 1996) to compensate for unequal sample sizes. Population pairwise RST values (Slatkin 1995) were calculated in Arlequin and P-values were Bonferroni corrected for multiple comparisons. As a second method of assessing population structure, we used the Bayesian clustering approach implemented in Structure version 2.3.3 (Pritchard et al. 2000; Falush et al. 2003), which determines the number of genetic groups present (K). We analyzed Structure results using the ΔK method (Evanno et al. 2005) to infer the number of genetic groups sampled. Because ΔK is a measure of the rate of change, this method cannot calculate a ΔK value for the smallest and the largest K included in the run. Therefore, in order to determine if our data had a true K= 1, we examined plots of the log posterior probability of the data (Ln P(D)) for each value of K to determine if the Ln P(D) value was maximum for K= 1. If alpha plots are unstable across all values of K and if Q-plots show all individuals as equally admixed, true K= 1 can also be inferred (Pritchard et al. 2007). In Structure, we chose the admixture model with correlated allele frequencies and ran 10 replicates of each run (K= 1 though 6). Each run consisted of a burn-in period of 100,000 Markov chain Monte Carlo steps followed by 106 iterations. We examined a subset of individuals for the presence of sex-biased dispersal using a test based on the variance of the assignment index (Goudet et al. 2002) in Fstat and generated P-values based on 10,000 randomizations.
Results
Mitochondrial DNA sequence
Across all samples, a total of 30 haplotypes (Fig. 3; GenBank JQ255398–JQ255427) were identified containing 20 polymorphic sites. Genetic diversity was highly variable across localities with the number of haplotypes per locality ranging from one (Ellenbrae) to 12 (Maryfield) (Table 1). Only four haplotypes (A, H, L, and R) were common across all sampling localities and 78% of all individuals carried one of these haplotypes. However, the frequencies of these haplotypes within regions were skewed: haplotype R was absent in the east although it had a frequency of 0.35 across all individuals sampled, haplotype A was absent in the west although it had a frequency of 0.18 across all individuals sampled, and haplotypes H and L had frequencies of 0.09 and 0.16, respectively, but each was only found in a single individual in the west. Eighteen haplotypes were found in only one individual. In general, genetic diversity was greatest in the east (Table 1).
Pairwise FST values ranged from zero to 0.72 and clearly indicated genetic breaks between eastern (Chidna, McArthur, October Creek, Maryfield), central (Victoria River, Newry, Wyndham), and western (Nelson's Hole, Ellenbrae, Mt. House) sampling localities: all comparisons of localities within these regions had low and nonsignificant FST values (0–0.07) whereas all comparisons of localities between regions had high and significant FST values (0.13–0.72). Average FST values between eastern and western localities were high (0.66), whereas those between the central localities and those to the east (0.36) or to the west (0.28) were intermediate. AMOVA results for the two-region hypothesis (separated by the geographic center of the historical Ord Arid Intrusion) indicated there was significant structuring at all levels: 35.7% of the variation was among regions (P= 0.03), 14.3% of the variation was among populations within regions (P < 0.001), 50% of the variation was within populations (P < 0.001). However, for the three-region hypothesis, the variation among regions increased to 47.4% of the total variation (P < 0.001), the variation among populations within regions was no longer significant and only accounted for 1% of the total variation (P= 0.07), and the within-population variation accounted for 51.6% of the total variation. These results indicate the three-region hypothesis is more likely. Although there was a significant positive relationship between geographic and genetic distance when all pairwise comparisons were included (r= 0.65, P= 0.001), this relationship was not consistent across the range of P. acuticauda (Fig. 4). Post-hoc Mantel tests including combinations of two of the three regions supported by AMOVA (three tests: western/central, eastern/central, western/eastern) indicated that no relationship could be detected between geographic and genetic distance between adjacent regions: for eastern and central samples, the correlation coefficient was 0.37 (P= 0.08) and for central and western samples the correlation coefficient was 0.22 (P= 0.12). However, a significant relationship was detected between geographic and genetic distance when eastern and western samples were tested (correlation coefficient 0.83, P= 0.01). Within-region pairwise comparisons (Fig. 4, filled squares) had the lowest genetic distances, although these comparisons had geographic distances overlapping all across-range comparisons.
Figure 4.
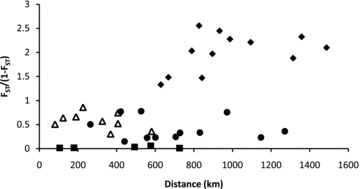
Graph illustrating the relationship between geographic and genetic distance using mitochondrial DNA sequence data for each pair of sampling localities (all pairs: r= 0.65, P= 0.001). This relationship is not significant between adjacent regions (eastern/central = filled circles, r= 0.37, P= 0.08; western/central = open triangles, r= 0.22, P= 0.12) but is significant between eastern and western sampling localities (filled diamonds, r= 0.83, P= 0.01). Within-region comparisons (filled squares) had the lowest values of genetic distance, despite having geographic distances overlapping those of all other across-region comparisons.
Microsatellite analyses
No departures from Hardy–Weinberg or linkage dis-equilibrium were detected in any of our microsatellite markers. Microsatellites were highly polymorphic with a mean of 16.4 alleles per locus (range 6–42) but showed no differences in genetic diversity across sampling locations (Table 2). Population pairwise RST values were generally low (mean RST= 0.03, range 0–0.10) and few had significant P-values (three out of 45: Nelson's Hole/Wyndham; Nelson's Hole/Victoria River; Newry/Victoria River). The general lack of population differentiation indicated by pairwise RST comparisons from microsatellite data was mirrored in the results of Structure analyses. The maximum value of Ln P(D) corresponded to K= 1 (Fig. 5), alpha plots were unstable across runs and Q-plots indicated all individuals were equally admixed for all values of K. In combination, this evidence suggests the presence of a single genetic group across northern Australia. The variance assignment test showed no evidence of sex-biased dispersal (P= 0.82).
Table 2.
Microsatellite diversity for each sampling locality including sample size (N), average number of alleles (NA) per locus, number of private alleles (NPA), allelic richness (R), and gene diversity (GD).
| Locality | N | NA | NPA | R | GD |
|---|---|---|---|---|---|
| Western | |||||
| Mt. House | 40 | 8.4 | 6 | 7.1 | 0.69 |
| Ellenbrae | 18 | 8.0 | 6 | 8.0 | 0.76 |
| Nelson's Hole | 40 | 9.1 | 7 | 7.3 | 0.68 |
| Central | |||||
| Wyndham | 30 | 8.1 | 1 | 7.2 | 0.70 |
| Newry | 24 | 9.0 | 5 | 8.1 | 0.70 |
| Victoria River | 22 | 7.5 | 3 | 7.1 | 0.72 |
| Eastern | |||||
| Maryfield | 30 | 8.7 | 2 | 7.5 | 0.71 |
| October Creek | 32 | 8.6 | 4 | 7.4 | 0.72 |
| McArthur | 36 | 9.3 | 7 | 7.7 | 0.73 |
| Chidna | 30 | 8.3 | 6 | 7.1 | 0.70 |
Figure 5.
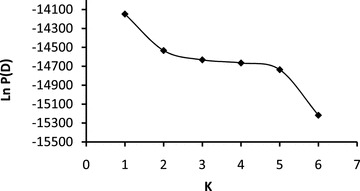
Graph illustrating the log posterior probabilities of the micro-satellite data (Ln P(D)) for each number of genetic groups (K) tested. Maximum value of Ln P(D) corresponds to K= 1 indicating data represent a single population.
Discussion
Our results support previous morphological and phylogenetic evidence suggesting that the subspecies of P. acuticauda were separated by the Ord Arid Intrusion. However, mtDNA analyses presented here indicate the presence of three (not two) distinct genetic groups of P. acuticauda in Australia: one to either side of the Ord Arid Intrusion and a third group located in the vicinity of this biogeographic barrier. In contrast, microsatellite data show no evidence of population structure across the range of this species. Because this collection of evidence addresses different time spans, we are able to construct a more complete history of this species with respect to the effect of the Ord Arid Intrusion than previous studies.
Phylogenetic data from nuclear markers provide information regarding a species’ history in the more distant past than mitochondrial markers. Using nuclear markers, Jennings and Edwards (2005) concluded that P. a. hecki and P. a. acuticauda diverged approximately 0.3 million years before present, which is consistent with the time scale over which the Ord Arid Intrusion was present. Incomplete lineage sorting, common in recently isolated taxa, was found in P. acuticauda subspecies and explained by a large population size relative to divergence time (Jennings and Edwards 2005). However, mtDNA has one-quarter the effective population size of the nuclear genome (Birky et al. 1989), resulting in more rapid lineage sorting following separation (Avise 2000). For this reason, Edwards et al. (2005) have criticized the sole use of mtDNA as a measure of separation, suggesting that the rapidity with which it segregates may prematurely indicate divergence. However, in this study, mtDNA haplotypes were not private to putative subspecies, which may be the result of introgression following secondary contact, but may also be due to incomplete lineage sorting. This may indicate that the divergence identified by Jennings and Edwards (2005) using nuclear DNA analyses has also been too recent for reciprocal monophyly to form in the mitochondrial genome. If the Ord Arid Intrusion is the biogeographic barrier responsible for Pleistocene separation of these subspecies and secondary contact/interbreeding has not occurred, then we would expect to see two genetic groups represented in mtDNA. Instead, we identified three groups, with the central group being geographically centered on the historical Ord Arid Intrusion and genetically intermediate to those to either side. This may suggest that individuals from the central region are the result of secondary contact and interbreeding between eastern and western regions. However, an alternate explanation for the mtDNA patterns we have identified exists. It is possible that individuals from our eastern and central regions are representative of two groups that were separated at one point in time by the Ord Arid Intrusion and that have not had sufficient time to become reciprocally monophyletic. The population in the western region may have been subsequently founded from a small number of individuals from the central region expanding the range westward when arid conditions abated. Levels of genetic diversity support this concept: samples from the western region had the lowest level of genetic diversity (Table 1; Fig. 3). The highest levels of genetic diversity were found within mtDNA from the eastern region, consistent with larger post-separation population sizes in this area. Additionally, the topology of the haplotype network (Fig. 3) supports this alternative explanation. Haplotypes found in the western region were mostly terminal, suggestive of a more recent origin whereas the most common haplotypes found in the central and eastern regions (A, H, L) appear to be ancestral as they located at the center of a star-shaped radiations typical of evolutionarily recent population expansion (Slatkin and Hudson 1991). Furthermore, only in the western region are haplotype proportions highly skewed toward a single haplotype (85% of individuals carry haplotype R), which is indicative of a small founding population and subsequent genetic drift.
Evidence of gene flow
Nuclear microsatellite data can provide different information about population structure than sequence data from either the nuclear or mitochondrial genome. This class of genetic markers will coalesce at the same rate as nuclear sequence data, but due to high rates of mutation and homoplasy, data from microsatellites may obscure population history, making them less than ideal for phylogenetic studies (Zink and Barrowclough 2008). However, the high mutation rates of microsatellites may result in greater statistical power to identify even small genetic differences between populations (Hedrick 1999). If population differentiation can be identified, it then can be used for estimating contemporary gene flow through several methods that detect recent dispersal (Pritchard et al. 2000; Wilson and Rannala 2003; Piry et al. 2004). These methods can be highly useful for detecting gene flow following secondary contact (e.g., Jones et al. 2005). However, both our study and that of Vallender et al. (2007) failed to find any evidence of population structure across species contact zones using microsatellite loci, despite evidence of structure from mtDNA. Many other avian studies have found substantially less structure at microsatellites than mtDNA (Haavie et al. 2000; Tiedemann et al. 2004; Wright et al. 2005). The absence of substantial structure in microsatellite data between populations prevents the use of the methods mentioned above to assess contemporary gene flow.
The studies discussed above indicate that contrasting patterns of population structure from microsatellite and mtDNA loci are not unusual, and cases where mtDNA show greater population structure have often been explained as resulting from male-biased dispersal (reviewed in Zink and Barrowclough 2008). However, in most species of birds, dispersal is female-biased (Greenwood 1980). We found no evidence of sex-biased dispersal in P. acuticauda in concordance with recapture data from birds banded as nestlings (van Rooij and Griffith 2011). Zink and Barrowclough (2008) suggested these differences are more parsimoniously explained by differences in coalescent times, such that nuclear markers reflect structure in the more distant past than those from mtDNA. While the pattern we have observed could be the result of recent divergence, which is only evident in mtDNA, this seems unlikely based on the findings of Jennings and Edwards (2005) that divergence was evident using nuclear markers. It is more likely that the inconsistency of our results across marker classes is related to issues specific to microsatellites, such as homoplasy, which can obscure signals of structure. The use of microsatellite markers in studies attempting to separate historical from contemporary processes has been the subject of recent debate (Zink 2010; Zink et al. 2010; 2011; Barr et al. 2011) and will continue to require careful interpretation.
Two alternate explanations suggest the presence of current gene flow with differential introgression of marker classes. First, Haldane's rule states that when hybrid offspring have differential fertility or viability according to their sex, the heterogametic sex is more affected (Haldane 1922). If Haldane's rule applies to hybrids of P. a. acuticauda and P. a. hecki, then we would expect to see introgression of nuclear DNA (biparental) in the absence of introgression of mtDNA (maternal) because females are the heterogametic sex in birds. Second, Petit and Excoffier (2009) suggest that markers associated with the more dispersive sex (i.e., mtDNA in our case) should provide better discrimination between species across hybrid zones than those associated with both sexes. While this at first appears counterintuitive, it is explained by higher levels of within-species gene flow at markers associated with the more dispersive sex counteracting the effects of genetic drift. Petit and Excoffier (2009) cite numerous examples of species having female-biased dispersal showing higher levels of introgression across hybrid zones in nuclear markers than those from the mitochondrial genome, suggesting that mtDNA is more useful in identifying subspecies. It is clear that if either of these explanations is correct, only a small number of individuals need to be exchanged in order to prevent drift from creating population divergence (Wright 1969; Mills and Allendorf 1996).
While the effect of a low level of exchange between populations is predicted to result in genetic homogeneity, this may not be representative of demographic connectivity. The relative contributions of effective population size and dispersal rate to estimates of genetic differentiation have recently been examined by Chapuis et al. (2011). Using genetic data from Australia plague locust (Chortoicetes terminifera) populations, they demonstrated that when effective population sizes are very large, a nonsignificant result from genotype frequency comparisons cannot be interpreted as evidence of demographic connectivity. Demographic connectivity is driven by migration rate, whereas genetic connectivity is driven by the product of migration rate and effective population size (Waples and Gaggiotti 2006). Therefore, very large effective population sizes combined with low levels of migration may homogenize populations genetically while they remain demographically independent. Historical population sizes for P. acuticauda are estimated to have been in the hundreds of thousands (Jennings and Edwards 2005) and currently this species is described as “common” (Clement 1999). Therefore, it is possible that our microsatellite data are not useful in drawing conclusions regarding contemporary connectivity between subspecies of P. acuticauda.
Little is known about dispersal in P. acuticauda. High levels of adult site fidelity and natal philopatry have been reported for this species (van Rooij and Griffith 2011), suggesting restricted dispersal. This is also supported by previous conclusions regarding levels of gene flow in this species (Jennings and Edwards 2005). Further, observations regarding bill color support restricted dispersal. Crosses between red- and yellow-billed forms produce offspring having orange bills (Higgins et al. 2006). Therefore, it would be expected that high levels of long-distance dispersal would result in an eventual loss of differential coloration, in the absence of assortative mating or selection, yet strong color divergence persists across the range. However, in the presence of either assortative mating or selection, differential coloration may be maintained in the face of high levels of long-distance dispersal. Breeding experiments between the two morphs are required to better understand assortative mating and selection on bill color in this species complex. We did identify several individuals carrying mtDNA haplotypes that were uncommon in the region where they were sampled. For instance, a single western individual was assigned haplotype L and a single western individual was assigned haplotype H. These haplotypes are common in the east and are also found in the central region. Similarly, two individuals sampled in the central region carried haplotypes unique to other regions (one carried S, unique to the western region barring this individual; one carried F, unique to the eastern region barring this individual). It is possible that these individuals are dispersers, although we cannot rule out the possibility that this is simply the result of incomplete lineage sorting. Even low levels of dispersal should result in genetic homogenization of populations, which is not supported by mitochondrial or bill color data from this species complex. Therefore, if these individuals are genuine dispersers, they do not appear to be reproductively successful. We found no evidence of genetic differentiation when analyzing mtDNA within regions, which does support gene flow at these scales.
Conclusions
In this study, we aimed to provide genetic evidence regarding the role of the Ord Arid Intrusion in shaping populations of P. acuticauda. First, we asked if this geographical feature functioned as an agent of vicariance between the subspecies P. a. acuticauda and P. a. hecki. Our mtDNA data support the presence of three genetically distinct regions (Fig. 2): one to the east of the Ord Arid Intrusion, one in the vicinity of this historical feature, and one to the west. The division we identified between the eastern and central regions using genetic data coincides with morphological data regarding bill color changes (Higgins et al. 2006) and song variation (Zann 1976), suggesting that the Ord Arid Intrusion has functioned as a biogeographic barrier in this species complex resulting in vicariance. The population in the western region appears to have been founded by individuals from the central region. Not only were western haplotypes terminal to network branches (Fig. 3), but genetic diversity was reduced in this region (Table 1). Further, western individuals only shared haplotypes with those from the central region, barring two individuals that may be dispersers.
Second, we asked which of two hypotheses based on morphological observations was better supported by genetic data: that differences in bill coloration represent a gradual genetic cline across the range of P. acuticauda or an abrupt morphological shift in the vicinity of the historical Ord Arid Intrusion (Harrison 1974; Boles 1988; Schodde and Mason 1999). The relationship between geographic and genetic distance (mtDNA) was not significant across adjacent regions or within regions (Fig. 4). These results support a complete absence of population genetic structure within regions (up to 726 km between localities), as do results of AMOVA (1% of the variation within regions). Additionally, comparisons between the central/eastern regions (up to 1271 km between localities) and the central/western regions (up to 581 km between localities) do not support the presence of isolation by distance, although genetic distances between these regions were greater than genetic distances within them. We conclude that mtDNA data show no evidence of a gradual cline, but are more indicative of three discrete groups with individuals from the central region being genetically intermediate to those from the eastern and western regions.
Third, we looked for evidence of contemporary gene flow across the Ord Arid Intrusion. Given the extreme phenotypes found at the range extremities (bill color) and the short dispersal distances reported by banding studies, we expected to detect population structure using microsatellites. However, 12 polymorphic microsatellite loci showed no evidence of population structuring (Fig. 5), nor did these markers display reduced diversity in populations from the western region (Table 2). We were, therefore, unable to quantify gene flow because methods that use individual microsatellite genotypes to infer contemporary dispersal are inappropriate in the absence of population structure. Although microsatellite results such as those we present here are often interpreted as evidence of high levels of gene flow (e.g., Feijoo et al. 2011; Finnegan et al. 2011; Reudink et al. 2011), this seems an extremely unlikely explanation in this study given what is known about the biology and history of the species. It is possible that the contrasting genetic patterns we have identified result from the effects of Haldane's rule or from differential introgression of the marker classes we utilized. Alternatively, large population sizes may obscure our ability to detect biologically relevant differentiation using microsatellites. In any case, it does seem plausible that the Ord Arid Intrusion has served as biogeographic barrier historically, but now acts as a zone of secondary contact between these subspecies.
Acknowledgments
We thank E. Bolund, M. Mariette, E. van Rooij, and C. Wiley for help with fieldwork, H. Flores for assistance with mapping, and B. Sherwin and two anonymous reviewers for useful comments on the manuscript. This work was supported by a QEII Fellowship (DP0881019) to S. C. G. from the Australian Research Council, and a Postdoctoral Fellowship to N. S. from the Research Council FORMAS.
References
- Avise JC. Phylogeography: the history and formation of species. Cambridge, MA: Harvard Univ. Press; 2000. [Google Scholar]
- Bandelt HJ, Forster P, Rohl A. Median-joining networks for inferring intraspecific phylogenies. Mol. Biol. Evol. 1999;16:37–48. doi: 10.1093/oxfordjournals.molbev.a026036. [DOI] [PubMed] [Google Scholar]
- Barr KR, Athrey G, Lindsay DL, Lance RF, Hayden TJ, Tweddale SA, Leberg PL. Missing the forest for the gene trees: conservation genetics is more than the identification of distinct population segments. Auk. 2011;128:792–794. [Google Scholar]
- Birky CW, Fuerst P, Maruyama T. Organelle gene diversity under migration, mutation, and drift: equilibrium expectations, approach to equilibrium, effects of heteroplasmic cells, and comparison to nuclear genes. Genetics. 1989;121:613–627. doi: 10.1093/genetics/121.3.613. [DOI] [PMC free article] [PubMed] [Google Scholar]
- Boles WE. Comments on the subspecies of Australian native and introduced finches. Emu. 1988;88:20–24. [Google Scholar]
- Bowman DMJS, Brown GK, Braby MF, Brown JR, Cook LG, Crisp MD, Ford F, Haberle S, Hughes J, Isagi Y, et al. Biogeography of the Australian monsoon tropics. J. Biogeogr. 2010;37:201–216. [Google Scholar]
- Chapuis M-P, Popple J-AM, Berthier K, Simpson SJ, Deveson E, Spurgin P, Steinbauer MJ, Sword GA. Challenges to assessing connectivity between massive populations of the Australian plague locust. Proc. R. Soc. B Biol. Sci. 2011;278:3152–3160. doi: 10.1098/rspb.2010.2605. [DOI] [PMC free article] [PubMed] [Google Scholar]
- Clement P. Finches and sparrows: an identification guide. Princeton, NJ: Princeton Univ. Press; 1999. [Google Scholar]
- Cracraft J. Patterns of diversification within continental biotas: hierarchical congruence among the areas of endemism of Australian vertebrates. Aust. Syst. Bot. 1991;4:211–227. [Google Scholar]
- Dawson D, Horsburgh G, Kupper C, Stewart I, Ball A, Durrant K, Hansson B, Bacon I, Bird S, Klein A. New methods to identify conserved microsatellite loci and develop primer sets of high utility—as demonstrated for birds. Mol. Ecol. Res. 2010;10:475–494. doi: 10.1111/j.1755-0998.2009.02775.x. [DOI] [PubMed] [Google Scholar]
- De Deckker P. Late Quaternary cyclic aridity in tropical Australia. Palaeogeogr. Palaeoclimatol. Palaeoecol. 2001;170:1–9. [Google Scholar]
- Edwards SV, Kingan SB, Calkins JD, Balakrishnan CN, Jennings WB, Swanson WJ, Sorensen MD. Speciation in birds: genes, geography, and sexual selection. Proc. Natl. Acad. Sci. USA. 2005;102:6550–6557. doi: 10.1073/pnas.0501846102. [DOI] [PMC free article] [PubMed] [Google Scholar]
- Evanno G, Regnaut S, Goudet J. Detecting the number of clusters of individuals using the software structure: a simulation study. Mol. Ecol. 2005;14:2611–2620. doi: 10.1111/j.1365-294X.2005.02553.x. [DOI] [PubMed] [Google Scholar]
- Excoffier L, Smouse PE, Quattro JM. Analysis of molecular variance inferred from metric distances among DNA haplotypes: application to human mitochondrial DNA restriction data. Genetics. 1992;131:479–491. doi: 10.1093/genetics/131.2.479. [DOI] [PMC free article] [PubMed] [Google Scholar]
- Excoffier L, Laval G, Schneider S. Arlequin ver. 3.0: an integrated software package for population genetics data analysis. Evol. Bioinform. Online. 2005;1:47–50. [PMC free article] [PubMed] [Google Scholar]
- Falush D, Stephens M, Pritchard JK. Inference of population structure using multilocus genotype data: linked loci and correlated allele frequencies. Genetics. 2003;164:1567–1587. doi: 10.1093/genetics/164.4.1567. [DOI] [PMC free article] [PubMed] [Google Scholar]
- Feijoo M, Lessa E, Loizaga de Castro R, Crespo E. Mitochondrial and microsatellite assessment of population structure of South American sea lion (Otaria flavescens) in the Southwestern Atlantic Ocean. Mar. Biol. 2011;158:1857–1867. [Google Scholar]
- Finnegan L, Wilson P, Price G, Lowe S, Patterson B, Fortin MJ, Murray D. The complimentary role of genetic and ecological data in understanding population structure: a case study using moose (Alces alces. Eur. J. Wildl. Res. 2011;58:415–423. [Google Scholar]
- Ford J. Geographical isolation and morphological and habitat differentiation between birds of the Kimberley and the Northern Territory. Emu. 1978;78:25–35. [Google Scholar]
- Forstmeier W, Schielzeth H, Schneider M, Kempenaers B. Development of polymorphic microsatellite markers for the zebra finch (Taeniopygia guttata. Mol. Ecol. Notes. 2007;7:1026–1028. [Google Scholar]
- Fridolfsson AK, Ellegren H. A simple and universal method for molecular sexing of non-ratite birds. J. Avian Biol. 1999;30:116–121. [Google Scholar]
- Gilby AJ, Mainwaring MC, Rollins LA, Griffith SC. Parental care in wild and captive zebra finches: measuring food delivery to quantify parental effort. Anim. Behav. 2011;81:289–295. [Google Scholar]
- Goudet J. FSTAT (version 1.2): a computer program to calculate F-statistics. J. Hered. 1995;86:485–486. [Google Scholar]
- Goudet J. FSTAT, a program to estimate and test gene diversities and fixation indices (version 2.9.3). Lausanne, Switzerland. 2001. Available at: http://www2.unil.ch/popgen/softwares/fstat.htm.
- Goudet J, Perrin N, Waser P. Tests for sex-biased dispersal using bi-parentally inherited genetic markers. Mol. Ecol. 2002;11:1103–1114. doi: 10.1046/j.1365-294x.2002.01496.x. [DOI] [PubMed] [Google Scholar]
- Greenwood PJ. Mating systems, philopatry and dispersal in birds and mammals. Anim. Behav. 1980;28:1140–1162. [Google Scholar]
- Haavie J, Sætre GP, Moum T. Discrepancies in population differentiation at microsatellites, mitochondrial DNA and plumage colour in the pied flycatcher—inferring evolutionary processes. Mol. Ecol. 2000;9:1137–1148. doi: 10.1046/j.1365-294x.2000.00988.x. [DOI] [PubMed] [Google Scholar]
- Haldane JBS. Sex ratio and unisexual sterility in hybrid animals. J. Genet. 1922;12:101–109. [Google Scholar]
- Harrison CJO. Estrildidae. In: Hall BP, editor. Birds of the Harold Hall Australian expeditions 1962–1970. London: British Museum (Natural History); 1974. pp. 319–327. [Google Scholar]
- Hedrick P. Highly variable loci and their interpretation in evolution and conservation. Evolution. 1999;53:313–318. doi: 10.1111/j.1558-5646.1999.tb03767.x. [DOI] [PubMed] [Google Scholar]
- Hewitt GM. Genetic consequences of climatic oscillations in the Quaternary. Philos. Transac. R. Soc. Lond. Ser. B Biol. Sci. 2004;359:183–195. doi: 10.1098/rstb.2003.1388. [DOI] [PMC free article] [PubMed] [Google Scholar]
- Higgins PJ, Peter JM, Cowling SJ, editors. Handbook of Australian, New Zealand & Antarctic birds. Vol. 7: boatbills to starlings. Melbourne: Oxford Univ. Press; 2006. [Google Scholar]
- Immelmann K. Australian finches in bush and aviary. Sydney: Angus & Robertson; 1982. [Google Scholar]
- Jennings WB, Edwards SV. Speciational history of Australian grass finches (Poephila) inferred from thirty gene trees. Evolution. 2005;59:2033–2047. [PubMed] [Google Scholar]
- Jones KL, Krapu GL, Brandt DA, Ashley MV. Population genetic structure in migratory sandhill cranes and the role of Pleistocene glaciations. Mol. Ecol. 2005;14:2645–2657. doi: 10.1111/j.1365-294X.2005.02622.x. [DOI] [PubMed] [Google Scholar]
- Kearns AM, Joseph L, Cook LG. The impact of Pleistocene changes of climate and landscape on Australian birds: a test using the Pied Butcherbird (Cracticus nigrogularis. Emu. 2010;110:285–295. [Google Scholar]
- Keast A. Infraspecific variation in the Australian finches. Emu. 1958;58:219–246. [Google Scholar]
- Keast A. Bird speciation on the Australian continent. Bull. Mus. Comp. Zool. Harvard. 1961;123:305–495. [Google Scholar]
- Lee JY, Edwards SV. Divergence across Australia's Carpentarian barrier: statistical phylogeography of the red-backed fairy wren (Malurus melanocephalus. Evolution. 2008;62:3117–3134. doi: 10.1111/j.1558-5646.2008.00543.x. [DOI] [PubMed] [Google Scholar]
- Macdonald JD. Notes on the taxonomy of Neositta (Results of the Harold Hall Australian Expedition, No.18) Emu. 1969;69:169–174. [Google Scholar]
- Mayr E, Paynter JRA, Traylor MA. Family Estrildidae. In: Paynter JRA, editor. Check-list of birds of the world, vol. 14. Cambridge, MA: Museum of Comparative Zoology; 1968. pp. 306–390. [Google Scholar]
- Mills LS, Allendorf FW. The one-migrant-per-generation rule in conservation and management. Conserv. Biol. 1996;10:1509–1518. [Google Scholar]
- Mousadik A, Petit RJ. High level of genetic differentiation for allelic richness among populations of the argan tree [Argania spinosa (L.) Skeels] endemic to Morocco. Theor. Appl. Genet. 1996;92:832–839. doi: 10.1007/BF00221895. [DOI] [PubMed] [Google Scholar]
- Petit RJ, Excoffier L. Gene flow and species delimitation. Trends Ecol. Evol. 2009;24:386–393. doi: 10.1016/j.tree.2009.02.011. [DOI] [PubMed] [Google Scholar]
- Petit RJ, El Mousadik A, Pons O. Identifying populations for conservation on the basis of genetic markers. Conserv. Biol. 1998;12:844–855. [Google Scholar]
- Pfenninger M, Posada D. Phylogeographic history of the land snail Candidula unifasciata (Helicellinae, Stylommatophora): fragmentation, corridor migration, and secondary contact. Evolution. 2002;56:1776–1788. doi: 10.1111/j.0014-3820.2002.tb00191.x. [DOI] [PubMed] [Google Scholar]
- Piry S, Alapetite A, Cornuet JM, Paetkau D, Baudouin L, Estoup A. GeneClass2: a software for genetic assignment and first-generation migrant detection. J. Hered. 2004;95:536–539. doi: 10.1093/jhered/esh074. [DOI] [PubMed] [Google Scholar]
- Pritchard JK, Stephens M, Donnelly P. Inference of population structure using multilocus genotype data. Genetics. 2000;155:945–959. doi: 10.1093/genetics/155.2.945. [DOI] [PMC free article] [PubMed] [Google Scholar]
- Pritchard JK, Wen X, Falush D. Documentation for structure software: version 2.2. 2007. Available at: http://pritch.bsd.uchicago.edu/software.
- Reudink MW, Kyle CJ, Nocera JJ, Oomen RA, Green MC, Somers CM. Panmixia on a continental scale in a widely distributed colonial waterbird. Biol. J. Linn. Soc. 2011;102:583–592. doi: 10.1093/jhered/esr055. [DOI] [PubMed] [Google Scholar]
- Rousset F. genepop’007: a complete re-implementation of the genepop software for Windows and Linux. Mol. Ecol. Res. 2008;8:103–106. doi: 10.1111/j.1471-8286.2007.01931.x. [DOI] [PubMed] [Google Scholar]
- Rozen S, Skaletsky H. Primer3 on the WWW for general users and for biologist programmers. In: Krawetz S, Misener S, editors. Bioinformatics methods and protocols: methods in molecular biology. Totowa, NJ: Humana Press; 2000. pp. 365–386. [DOI] [PubMed] [Google Scholar]
- Schodde R, Mason IJ. The directory of Australian birds. Canberra: CSIRO Publishing; 1999. [Google Scholar]
- Sefc KM, Payne RB, Sorenson MD. Characterization of microsatellite loci in village indigobirds Vidua chalybeata and cross-species amplification in estrildid and ploceid finches. Mol. Ecol. Notes. 2001;1:252–254. [Google Scholar]
- Slatkin M. A measure of population subdivision based on microsatellite allele frequencies. Genetics. 1995;139:457–462. doi: 10.1093/genetics/139.1.457. [DOI] [PMC free article] [PubMed] [Google Scholar]
- Slatkin M, Hudson RR. Pairwise comparisons of mitochondrial DNA sequences in stable and exponentially growing populations. Genetics. 1991;129:555–562. doi: 10.1093/genetics/129.2.555. [DOI] [PMC free article] [PubMed] [Google Scholar]
- Taylor SA, Maclagan L, Anderson DJ, Friesen VL. Could specialization to cold-water upwelling systems influence gene flow and population differentiation in marine organisms? A case study using the blue-footed booby, Sula nebouxii. J. Biogeogr. 2011;38:883–893. [Google Scholar]
- Thompson JD, Gibson TJ, Plewniak F, Jeanmougin F, Higgins HG. The CLUSTAL_X windows interface: flexible strategies for multiple sequence alignment aided by quality analysis tools. Nucleic Acids Res. 1997;25:4876–4882. doi: 10.1093/nar/25.24.4876. [DOI] [PMC free article] [PubMed] [Google Scholar]
- Tiedemann R, Paulus KB, Scheer M, Von Kistowski KG, Skírnisson K, Bloch D, Dam M. Mitochondrial DNA and microsatellite variation in the eider duck (Somateria mollissima) indicate stepwise postglacial colonization of Europe and limited current long-distance dispersal. Mol. Ecol. 2004;13:1481–1494. doi: 10.1111/j.1365-294X.2004.02168.x. [DOI] [PubMed] [Google Scholar]
- Toon A, Hughes JM, Joseph L. Multilocus analysis of honeyeaters (Aves: Meliphagidae) highlights spatio-temporal heterogeneity in the influence of biogeographic barriers in the Australian monsoonal zone. Mol. Ecol. 2010;19:2980–2994. doi: 10.1111/j.1365-294X.2010.04730.x. [DOI] [PubMed] [Google Scholar]
- Vallender R, Robertson RJ, Friesen VL, Lovette IJ. Complex hybridization dynamics between golden-winged and blue-winged warblers (Vermivora chrysoptera and Vermivora pinus) revealed by AFLP, microsatellite, intron and mtDNA markers. Mol. Ecol. 2007;16:2017–2029. doi: 10.1111/j.1365-294X.2007.03282.x. [DOI] [PubMed] [Google Scholar]
- van Rooij EP, Griffith SC. Breeding ecology of an Australian estrildid, the Long-tailed Finch (Poephila acuticauda. Emu. 2011;111:297–303. [Google Scholar]
- Wang M-T, Hsu Y-C, Yao C-T, Li S-H. Isolation and characterization of 12 tetranucleotide repeat microsatellite loci from the green-backed tit (Parus monticolus. Mol. Ecol. Notes. 2005;5:439–442. [Google Scholar]
- Waples RS, Gaggiotti O. INVITED REVIEW: what is a population? An empirical evaluation of some genetic methods for identifying the number of gene pools and their degree of connectivity. Mol. Ecol. 2006;15:1419–1439. doi: 10.1111/j.1365-294X.2006.02890.x. [DOI] [PubMed] [Google Scholar]
- Wilson GA, Rannala B. Bayesian inference of recent migration rates using multilocus genotypes. Genetics. 2003;163:1177–1191. doi: 10.1093/genetics/163.3.1177. [DOI] [PMC free article] [PubMed] [Google Scholar]
- Wright S. Evolution and genetics of populations. Vol 2. Chicago, IL: Univ. of Chicago Press; 1969. [Google Scholar]
- Wright TF, Rodriguez AM, Fleischer RC. Vocal dialects, sex-biased dispersal, and microsatellite population structure in the parrot Amazona auropalliata. Mol. Ecol. 2005;14:1197–1205. doi: 10.1111/j.1365-294X.2005.02466.x. [DOI] [PubMed] [Google Scholar]
- York KL, Blacket MJ, Appleton BR. The Bassian Isthmus and the major ocean currents of southeast Australia influence the phylogeography and population structure of a southern Australian intertidal barnacle Catomerus polymerus (Darwin) Mol. Ecol. 2008;17:1948–1961. doi: 10.1111/j.1365-294X.2008.03735.x. [DOI] [PubMed] [Google Scholar]
- Zann RA. Variation in the songs of three species of Estrildine grassfinches. Emu. 1976;76:97–108. [Google Scholar]
- Zarza E, Reynoso VH, Emerson BC. Discordant patterns of geographic variation between mitochondrial and microsatellite markers in the Mexican black iguana (Ctenosaura pectinata) in a contact zone. J. Biogeogr. 2011;38:1394–1405. [Google Scholar]
- Zink RM. Drawbacks with the use of microsatellites in phylogeography: the song sparrow Melospiza melodia as a case study. J. Avian Biol. 2010;41:1–7. [Google Scholar]
- Zink RM, Barrowclough GF. Mitochondrial DNA under siege in avian phylogeography. Mol. Ecol. 2008;17:2107–2121. doi: 10.1111/j.1365-294X.2008.03737.x. [DOI] [PubMed] [Google Scholar]
- Zink RM, Jones AW, Farquhar CC, Westberg MC, Rojas JIG. Comparison of molecular markers in the endangered black-capped Vireo (Vireo atricapilla) and their interpretation in conservation. Auk. 2010;127:797–806. [Google Scholar]
- Zink RM, Jones AW, Farquhar CC, Westberg MC, Rojas JIG. Endangered species management and the role of conservation genetics: a response to Barr et al. Auk. 2011;128:794–797. [Google Scholar]