

Abstract
We studied the influence of glacial oscillations on the genetic structure of seven species of white-headed gull that breed at high latitudes (Larus argentatus, L. canus, L. glaucescens, L. glaucoides, L. hyperboreus, L. schistisagus, and L. thayeri). We evaluated localities hypothesized as ice-free areas or glacial refugia in other Arctic vertebrates using molecular data from 11 microsatellite loci, mitochondrial DNA (mtDNA) control region, and six nuclear introns for 32 populations across the Holarctic. Moderate levels of genetic structure were observed for microsatellites (FST= 0.129), introns (ΦST= 0.185), and mtDNA control region (ΦST= 0.461), with among-group variation maximized when populations were grouped based on subspecific classification. Two haplotype and at least two allele groups were observed across all loci. However, no haplotype/allele group was composed solely of individuals of a single species, a pattern consistent with recent divergence. Furthermore, northernmost populations were not well differentiated and among-group variation was maximized when L. argentatus and L. hyberboreus populations were grouped by locality rather than species, indicating recent hybridization. Four populations are located in putative Pleistocene glacial refugia and had larger τ estimates than the other 28 populations. However, we were unable to substantiate these putative refugia using coalescent theory, as all populations had genetic signatures of stability based on mtDNA. The extent of haplotype and allele sharing among Arctic white-headed gull species is noteworthy. Studies of other Arctic taxa have generally revealed species-specific clusters as well as genetic structure within species, usually correlated with geography. Aspects of white-headed gull behavioral biology, such as colonization ability and propensity to hybridize, as well as their recent evolutionary history, have likely played a large role in the limited genetic structure observed.
Keywords: Genetic structure, hybridization, Larus, Pleistocene glacial refugia, white-headed gulls
Population and species divergence in Arctic breeding species often reflect the climatic oscillations of the Pleistocene (Hewitt 2004). Glacial activity had profound effects on the distribution of Arctic taxa through these major climatic shifts. During glacial maxima, ice sheets subdivided ancestral populations into temperate or high-latitude ice-free areas, often resulting in the formation of phenotypically similar species with shallow genetic differentiation (Schmitt 2007). Warming during interglacial periods allowed species to expand their distributions into newly available habitat, resulting in clinal variation in genetic diversity (Hewitt 2004). This pattern of expansion and contraction of species distributions occurred many times in the Pleistocene; more than 20 glacial cycles have been recorded (Williams et al. 1998). Following the glacial maxima, many species that were isolated in southern and northern refugia expanded, came into secondary contact, and hybridized to varying extents (Hewitt 2001). This likely resulted in cycles of isolation and hybridization throughout the Pleistocene. Concordance of secondary contact zones (suture zones) has been observed across several Arctic species, which suggests a commonality in the location and persistence of glacial refugia during the last glacial maximum (Hewitt 2000).
Over the past decade, molecular markers have aided in the identification of cryptic glacial refugia and substantiated previously hypothesized refugia (Waltari and Cook 2005; Schafer et al. 2010; Sonsthagen et al. 2011). Previously, identification of the location of Pleistocene glacial refugia required knowledge of species distributions prior to glaciations or were inferred from paleoecological data. However, population contractions and expansions as a result of glacial cycling left predictable genetic signatures (Avise 2000). Populations arising via postglacial colonization of a region through successive founder events are expected to show reduced genetic diversity relative to populations residing in nonglaciated areas and to exhibit a genetic signature of population expansion from low-diversity founder populations (Galbreath and Cook 2004). However, current or past hybridization among closely related taxa may make it difficult to assess genetic relationships among Arctic populations. Introgression would likely have maintained or increased genetic diversity when a recently deglaciated area was colonized, and, therefore, would not be expected to produce a genetic signature of population expansion.
White-headed gulls (Larus spp.) are a geographically widespread clade of 18 species (Liebers et al. 2004; Olsen and Larsson 2004; Pons et al. 2005). Included in this clade is a subclade of 13 very closely related species of large white-headed gulls (Pons et al. 2005), which present particularly vexing problems to biologists. Some species within the white-headed gull complex have a circumpolar distribution (L. argentatus, L. canus, and L. hyperboreus; Fig. 1), while others are restricted to more circumscribed areas at high latitude (L. glaucoides, L. schistisagus, and L. thayeri; Fig. 1; Olsen and Larsson 2004). Previous assessments of relationships among white-headed gull populations revealed low to moderate genetic structure based on mitochondrial DNA (mtDNA), microsatellite, and amplified fragment length polymorphism (AFLP) loci (Liebers et al. 2001; Liebers and Helbig 2002; Crochet et al. 2003; Liebers et al. 2004; Pons et al. 2005; Gay et al. 2007; Vigfúsdóttir et al. 2008; Sternkopf et al. 2010). However, these studies focused largely on populations in Europe where climatic oscillations of the late Quaternary were significantly different than those in North America (Hewitt 1996), notably in the extensive glacial advances in North America (Velichko et al. 1997) and the likely absence of long-term high-latitude glacial refugia in Europe (Schmitt 2007). The presence of several white-headed gull species restricted to northern latitudes, coupled with the relatively low genetic differentiation observed among taxa, suggests that glacial oscillations associated with the late Pleistocene may have played a large role in the diversification of this group.
Figure 1.
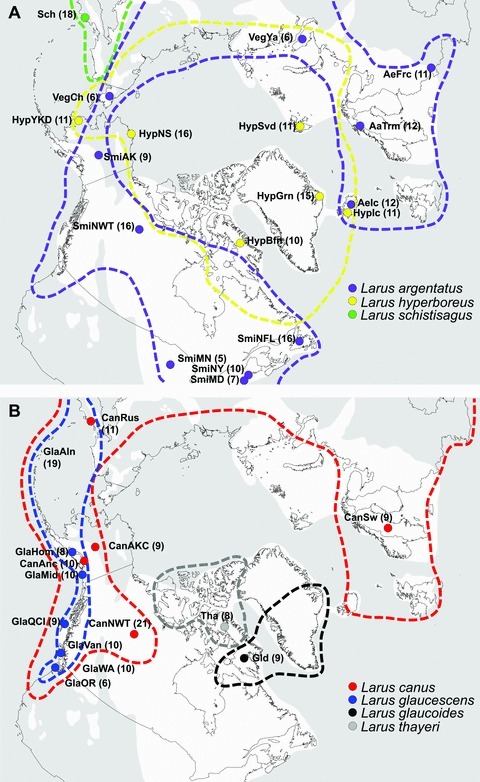
Seven Arctic gull species distributions and localities of 32 populations used in this study: (A) Larus argentatus (Aa, Ae, Smi, and Veg), L. hyperboreus (Hyp), L. schistisagus (Sch), and (B) L. canus (Can), L. glaucescens (Gla), L. glaucoides (Gld), and L. thayeri (Tha). Extent of the most recent glacial ice sheets is illustrated in white, and unglaciated regions are illustrated in gray (Hewitt 2004). Sample sizes are in parentheses. See Appendix S1 for physical descriptions of the localities.
We studied the influence of glacial oscillations on the genetic structure of seven species of white-headed gull that breed at high latitudes (L. argentatus, L. canus, L. glaucescens, L. glaucoides, L. hyperboreus, L. schistisagus, and L. thayeri) using microsatellite genotypes from 11 autosomal loci, intron sequences from six autosomal nuclear genes, and mtDNA sequences from the control region. We evaluated Holarctic localities that have been hypothesized as ice-free areas or glacial refugia in other Arctic vertebrates, including the southern edge of the Bering Land Bridge, northern Beringia, Haida Gwaii, Newfoundland Bank, Spitsbergen Bank, and northwest Norway. Specifically, we employed traditional frequency-based and coalescent-based analyses to test if populations residing at high latitudes have the genetic signature of refugia. Populations formed through postglacial colonization are characterized by lower levels of nucleotide and haplotype diversity (Avise 2000), later times of expansion relative to other sampled populations, and genetic signatures of population growth based on the coalescent (Lessa et al. 2004). Inclusion of multiple taxa that occupy the Arctic allow us to examine whether geographically concordant contact regions suggestive of secondary contact are observed among populations expanding out of different Pleistocene refugia (i.e., suture zones) (Avise 2000).
Methods
Sampling and DNA extraction
Tissue samples of breeding-season adults, representing seven species and 32 populations of white-headed gulls, were collected or obtained through tissue loans (Fig. 1; Appendix S1): L. argentatus argentatus (Norway), L. a. argenteus (France, Iceland, and United Kingdom), L. a. smithsonianus (Canada and United States), L. canus brachyrhynchus (Canada and United States), L. c. canus (Sweden and United Kingdom), L. c. kamtschatschensis (Russia), L. glaucescens (Canada and United States), L. glaucoides kumlieni (Canada), L. hyperboreus barrovianus (United States), L. h. hyperboreus (Canada, Greenland, Iceland, and Norway), L. h. pallidissimus (Russia), L. schistisagus (Russia and United States), and L. thayeri (Canada and United States). Because of the limited number of breeding individuals of L. thayeri in tissue collections, nonbreeding adults of this species were included in this study. Care was taken to ensure that plumage characteristics were consistent with pure species, given the tendency for hybridization in this group (Pierotti 1987; Olsen and Larsson 2004 and citations therein). Species classifications follow the American Ornithologists’ Union Checklist of North American Birds (Banks et al. 2008); individuals were diagnosed to subspecies based on morphological characteristics (Olsen and Larsson 2004). Total genomic DNA was extracted from each sample using an AutoGen animal tissue extraction kit (AutoGen, Holliston, Maine). Genomic DNA concentrations were quantified using spectrophotometry and diluted to 50 ng µL–1 working solutions.
Microsatellite genotyping
Twenty-four individuals were screened at 30 microsatellite loci known to be variable for gull species (Laridae). Of these, 11 polymorphic loci containing dinucleotide repeat motifs were selected for further analyses of all tissue samples: Hg16, Hg18, Hg25 (Crochet et al. 2003), K16 (Tirard et al. 2002), LarZAP12, LarZAP19, LarSNX24, LarZAP26 (Gregory and Quinn 2006), Rbg13, Rbg18, and Rbg29 (Given et al. 2002). Polymerase chain reaction (PCR) amplifications followed Sonsthagen et al. (2007) with two modifications. The forward primer was end-labeled with one of two fluorescent phosphoramidite dyes (FAM or HEX). Fluorescently labeled PCR products were electrophoresed on an automated DNA sequencer (ABI 3130XL; Applied Biosystems, Foster City, CA) and sized using GENEMAPPER® version 4.0 (Applied Biosystems) with a universal ROX-labeled size standard (DeWoody et al. 2004). Ten percent of the samples were amplified and sized in duplicate for quality control purposes.
MtDNA and nuclear intron sequencing
We followed Liebers et al. (2001) and amplified a 2500 base pair (bp) fragment of the mtDNA genome to avoid amplifying nuclear pseudogenes observed in this group. From this, we directly sequenced 430 bp of domain I of the control region. Twenty nuclear autosomal introns were screened for variability and six selected for further analysis: α–enolase intron 8, ghrelin (ghrel) intron 3, ornithine carboxylase (od) intron 7, clathrin heavy-chain (chc) intron 5, myelin proteolipid protein (mpp) intron 4, and glyceraldehyde-3-phosphate dehydrogenase (gapdh) intron 11. Ghrel had two insert/deletions. To obtain sequence information from the entire fragment for individuals that are heterozygous for both insert/deletions, two internal sequencing primers were developed. See Appendix S2 for primer information. PCR amplifications, cycle sequencing, and postsequencing protocols followed Sonsthagen et al. (2007). ExoSAP-IT® (USB Corporation, Cleveland, OH) was used to remove excess primers and dNTPs in PCR products. Sequences are accessioned in GenBank (JQ708216–JQ710335).
Estimation of genetic diversity
Allelic phases of nuclear introns were inferred from diploid sequence data using PHASE 2.0 (Stephens et al. 2001). PHASE uses a Bayesian approach to reconstruct haplotypes from population genotypic data and allows for recombination and the decay of linkage disequilibrium with distance. The accuracy of haplotypes reconstructed by PHASE has been validated and shown to be greater than that of cloning with large datasets (Harrigan et al. 2008). The PHASE analysis (1000 iterations with a 1000 iteration burn-in period) was repeated three times and was consistent across runs. MtDNA and nuclear intron sequences were analyzed in NETWORK 4.5.0.0 (Fluxus Technology Ltd. 2008) using the median joining method (Bandelt et al. 1995), to illustrate possible reticulations in the gene trees because of homoplasy or recombination.
We calculated allelic frequencies, inbreeding coefficient (FIS), and expected and observed heterozygosities for each microsatellite locus, mtDNA, and the six nuclear introns in FSTAT 2.9.3 (Goudet 1995). Hardy–Weinberg equilibrium (HWE) and linkage disequilibrium were tested in FSTAT 2.9.3 for microsatellite and nuclear intron loci, adjusting for multiple comparisons using Bonferroni corrections (α= 0.05). We verified the selective neutrality for mtDNA control region sequence data using Tajima's D (Tajima 1989), implemented in ARLEQUIN 3.11 (Schneider et al. 2000).
Detecting spatial genetic structure
Levels of population structure among sampled sites were assessed with pairwise FST, RST, ΦST, overall F-statistics, and R-statistics calculated in ARLEQUIN, adjusting for multiple comparisons using Bonferroni correction (α= 0.05). We used Hedrick's (2005) method, implemented in RecodeData version 1.0 (Meirmans 2006) to calculate the maximum value of FST obtainable for our suite of microsatellite loci. Interallelic and interhaplotypic sequence divergences were used to calculate pairwise ΦST (Excoffier et al. 1992), and nuclear intron alleles were paired by individual. MODELTEST 3.06 (Posada and Crandall 1998) was used to determine the minimum parameter nucleotide substitution model that best fit the nuclear intron and mtDNA sequence data under Akaike's information criterion (Appendix S2; Akaike 1974).
Genotypic nuclear data (microsatellite and intron) were analyzed in STRUCTURE 2.2.3 (Pritchard et al. 2000) to detect the occurrence of population structure without a priori knowledge of putative populations. A series of analyses were performed (1) among large white-headed gull individuals (excludes L. canus individuals; Pons et al. 2005), and (2) within species represented by multiple populations. Data were analyzed using an admixture model assuming correlated frequencies to probabilistically assign individuals to putative populations (parameters: burn-in 10,000 iterations; 500,000 Markov chain Monte Carlo iterations) with the possible populations (K) ranging from 1 to 15. Analyses were repeated five times and were consistent across runs. We used the method of Evanno et al. (2005) to determine the most likely number of clusters.
Hierarchical analyses of molecular variance (AMOVA) were conducted in ARLEQUIN to test for significance of geographic and taxonomic (subspecies and species) partitioning of a priori hypothesized genetic units using microsatellite, nuclear intron, and mtDNA loci. Populations were grouped to test (1) specific designations, (2) subspecific designations, (3) geographic proximity irrespective of species status, and (4) geographic proximity and species status. We assumed that groupings that maximized the among-group variance (ΦCT) and were significantly different from random distributions constituted the most probable subdivision (Sonsthagen et al. 2011). L. glaucoides, L. schistisagus, and L. thayeri were not included in AMOVA comparisons because these species were represented by a single population.
Estimation of population demography
Evidence for historical fluctuations in population size was evaluated for 11 microsatellite loci using BOTTLENECK 1.2.02 (Cornuet and Luikart 1996) and for sequence data using LAMARC 2.1.2b (Kuhner 2006; Kuhner and Smith 2007). Fluctuations in population size inferred from microsatellite data were assessed using a Wilcoxon sign-rank test in BOTTLENECK. The probability distribution was established using 1000 permutations under two models: stepwise mutation model (SMM) and two-phase model of mutation (TPM; parameters: 79% SMM, variance 9; Rousset 1996). Heterozygote deficiency relative to the number of alleles indicates recent population growth, whereas heterozygote excess indicates a recent population bottleneck (Cornuet and Luikart 1996). It is important to note that BOTTLENECK compares heterozygote deficiency and excess relative to genetic diversity, not to HWE expectation (Cornuet and Luikart 1996). LAMARC was run using Bayesian search parameters: 10 short chains (1000 trees used out of 20,000 sampled) and three long chains (10,000 trees used out of 2,000,000 sampled). Data were analyzed three times and parameters converged across runs. Finally, mismatch distributions of mtDNA haplotype data were calculated in ARLEQUIN to gain further insight into historical population demography (Rogers and Harpending 1992).
Results
Genetic diversity
Multilocus microsatellite genotypes were collected from 343 individuals representing seven species. The number of alleles per locus ranged from 4 to 18. Allelic richness ranged from 1.62 to 2.86 with a mean of 2.62 across all populations (Table 1). Observed heterozygosities ranged from 22.7% to 70.7%; the mean across all populations was 52.0% (Table 1). In general, L. hyperboreus and populations of L. argentatus from Europe had lower levels of heterozygosity than did other species. Two populations (AeFrc and CanNWT) exhibited heterozygote deficiency and did not conform to HWE (Table 1). The population of L. canus from the Northwest Territories (CanNWT) was in linkage disequilibrium at nine loci pairs (Lar24xK16, Lar24xHg18, Lar12xLar19, Lar12xK16, Lar12xHg18, Lar12xRbg29, Lar26xHg18, Lar19xHg18, K16xHg18), but the overall comparison was not significant. The remaining populations and loci were in linkage equilibrium and HWE and all loci were retained for subsequent analyses. The inbreeding coefficient (FIS) ranged from –0.098 to 0.286 across populations; mean value was 0.112. The inbreeding coefficient for CanNWT was significantly larger than expected (α > 0.05) (Table 1).
Table 1.
Expected (He) and observed heterozygosities (Ho), haplotype (h) and nucleotide (π) diversity, with standard deviation (SD), allelic richness (AR) or number of haplotypes (H), and sample size (n) estimated from Arctic gull populations based on 11 microsatellite, six nuclear introns, and mtDNA control region loci. Significant estimates (α= 0.05) are in bold text.
| Microsatellites | Nuclear introns | mtDNA | ||||||||||||
|---|---|---|---|---|---|---|---|---|---|---|---|---|---|---|
| AR | He/Ho | FIS | n | AR | He/Ho | FIS | h | π | n | H | h | π | n | |
| Sch | 2.58 | 67.2/59.5 | 0.118 | 18 | 1.65 | 79.4/76.4 | 0.039 | 0.995 | 0.003 | 18 | 10 | 0.882 | 0.014 | 18 |
| (0.009) | (0.002) | (0.063) | (0.008) | |||||||||||
| Tha | 2.55 | 66.0/63.2 | 0.045 | 8 | 1.75 | 79.1/74.4 | 0.064 | 1.000 | 0.003 | 8 | 6 | 0.929 | 0.005 | 8 |
| (0.009) | (0.002) | (0.084) | (0.004) | |||||||||||
| Gld | 2.31 | 56.7/47.0 | 0.181 | 9 | 1.75 | 75.4/65.7 | 0.137 | 1.000 | 0.005 | 9 | 5 | 0.806 | 0.005 | 9 |
| (0.019) | (0.003) | (0.120) | (0.004) | |||||||||||
| VegYa | 2.34 | 59.8/52.1 | 0.154 | 6 | 1.79 | 61.5/70.3 | 0.138 | 1.000 | 0.009 | 5 | 4 | 0.900 | 0.007 | 5 |
| (0.045) | (0.005) | (0.161) | (0.005) | |||||||||||
| VegCh | 2.68 | 71.4/58.1 | 0.206 | 6 | 1.79 | 79.0/69.4 | −0.171 | 0.989 | 0.004 | 6 | 5 | 0.933 | 0.017 | 6 |
| (0.031) | (0.002) | (0.122) | (0.011) | |||||||||||
| SmiAK | 2.45 | 61.0/52.7 | 0.144 | 9 | 1.75 | 64.1/51.4 | 0.237 | 1.000 | 0.004 | 4 | 3 | 0.833 | 0.007 | 4 |
| (0.063) | (0.003) | (0.222) | (0.006) | |||||||||||
| SmiNWT | 2.45 | 62.1/56.0 | 0.101 | 16 | 1.64 | 71.4/73.3 | −0.028 | 1.000 | 0.004 | 17 | 11 | 0.882 | 0.006 | 17 |
| (0.004) | (0.003) | (0.072) | (0.004) | |||||||||||
| SmiMN | 2.50 | 64.4/50.4 | 0.245 | 5 | 1.60 | 60.2/61.4 | −0.029 | 1.000 | 0.003 | 5 | 3 | 0.700 | 0.016 | 5 |
| (0.044) | (0.002) | (0.218) | (0.011) | |||||||||||
| SmiMD | 2.28 | 57.0/62.1 | −0.098 | 7 | 1.62 | 69.8/69.7 | 0.004 | 0.989 | 0.004 | 7 | 5 | 0.857 | 0.016 | 7 |
| (0.031) | (0.002) | (0.137) | (0.010) | |||||||||||
| SmiNY | 2.24 | 55.4/45.9 | 0.180 | 10 | 1.62 | 70.7/53.2 | 0.308 | 1.000 | 0.006 | 7 | 2 | 0.286 | 0.001 | 7 |
| (0.027) | (0.003) | (0.196) | (0.001) | |||||||||||
| SmiNFL | 2.14 | 50.9/44.8 | 0.123 | 16 | 1.60 | 71.4/77.3 | −0.089 | 1.000 | 0.004 | 15 | 5 | 0.638 | 0.003 | 15 |
| (0.009) | (0.002) | (0.129) | (0.002) | |||||||||||
| AeIc | 1.96 | 44.5/43.2 | 0.029 | 12 | 1.56 | 56.2/48.6 | 0.141 | 0.996 | 0.003 | 12 | 8 | 0.924 | 0.018 | 12 |
| (0.013) | (0.002) | (0.058) | (0.010) | |||||||||||
| AeFrc | 2.21 | 52.6/45.8 | 0.134 | 11 | 1.67 | 67.1/63.7 | 0.114 | 0.957 | 0.002 | 11 | 9 | 0.946 | 0.011 | 11 |
| (0.029) | (0.001) | (0.066) | (0.007) | |||||||||||
| AaTrm | 2.17 | 53.4/50.0 | 0.067 | 10 | 1.60 | 59.9/52.7 | 0.126 | 1.000 | 0.003 | 12 | 5 | 0.667 | 0.015 | 12 |
| (0.016) | (0.002) | (0.141) | (0.009) | |||||||||||
| HypYKD | 2.35 | 59.6/58.7 | 0.015 | 11 | 1.58 | 74.7/65.7 | 0.131 | 1.000 | 0.005 | 11 | 8 | 0.891 | 0.005 | 11 |
| (0.014) | (0.003) | (0.092) | (0.004) | |||||||||||
| HypRus | 2.20 | 53.4/46.9 | 0.126 | 16 | 1.64 | 63.6/59.8 | 0.062 | 0.994 | 0.004 | 16 | 11 | 0.908 | 0.009 | 16 |
| (0.010) | (0.002) | (0.063) | (0.006) | |||||||||||
| HypBfn | 2.09 | 51.4/53.3 | −0.040 | 10 | 1.69 | 62.4/59.3 | 0.054 | 1.000 | 0.003 | 10 | 7 | 0.867 | 0.008 | 10 |
| (0.016) | (0.002) | (0.107) | (0.005) | |||||||||||
| HypGrn | 2.17 | 54.3/47.0 | 0.140 | 15 | 1.68 | 60.4/55.9 | 0.079 | 0.998 | 0.004 | 15 | 7 | 0.827 | 0.013 | 15 |
| (0.009) | (0.003) | (0.082) | (0.008) | |||||||||||
| HypIc | 1.62 | 30.9/22.7 | 0.274 | 11 | 1.57 | 60.4/59.1 | 0.023 | 1.000 | 0.003 | 11 | 4 | 0.490 | 0.005 | 11 |
| (0.016) | (0.002) | (0.175) | (0.004) | |||||||||||
| HypSvd | 2.09 | 50.1/45.0 | 0.107 | 10 | 1.55 | 62.3/55.0 | 0.122 | 1.000 | 0.004 | 11 | 5 | 0.756 | 0.004 | 10 |
| (0.014) | (0.002) | (0.130) | (0.003) | |||||||||||
| GlaAln | 2.34 | 58.0/50.6 | 0.131 | 19 | 1.71 | 69.3/60.6 | 0.131 | 0.999 | 0.000 | 19 | 12 | 0.935 | 0.015 | 18 |
| (0.007) | (0.000) | (0.041) | (0.008) | |||||||||||
| GlaHom | 2.40 | 60.1/59.8 | 0.005 | 8 | 1.79 | 67.9/52.1 | 0.249 | 1.000 | 0.004 | 8 | 6 | 0.929 | 0.010 | 8 |
| (0.022) | (0.002) | (0.084) | (0.006) | |||||||||||
| GlaMid | 2.40 | 61.5/55.0 | 0.113 | 10 | 1.62 | 57.5/56.4 | 0.019 | 1.000 | 0.004 | 10 | 10 | 1.000 | 0.021 | 10 |
| (0.016) | (0.002) | (0.045) | (0.012) | |||||||||||
| GlaQCI | 2.34 | 60.0/56.4 | 0.065 | 9 | 1.66 | 54.6/50.0 | 0.088 | 1.000 | 0.003 | 9 | 9 | 1.000 | 0.014 | 9 |
| (0.019) | (0.002) | (0.052) | (0.008) | |||||||||||
| GlaVan | 2.19 | 53.5/45.4 | 0.161 | 9 | 1.70 | 57.5/51.4 | 0.110 | 0.995 | 0.000 | 10 | 6 | 0.889 | 0.013 | 9 |
| (0.018) | (0.000) | (0.091) | (0.008) | |||||||||||
| GlaWA | 2.29 | 57.2/52.8 | 0.080 | 10 | 1.71 | 64.6/58.3 | 0.103 | 1.000 | 0.006 | 10 | 8 | 0.956 | 0.019 | 10 |
| (0.016) | (0.003) | (0.059) | (0.011) | |||||||||||
| GlaOR | 2.04 | 48.0/35.4 | 0.286 | 6 | 1.68 | 64.4/69.4 | −0.087 | 1.000 | 0.006 | 6 | 4 | 0.800 | 0.004 | 6 |
| (0.034) | (0.003) | (0.172) | (0.003) | |||||||||||
| CanAKC | 2.86 | 75.6/70.7 | 0.068 | 9 | 1.64 | 67.5/63.7 | 0.061 | 1.000 | 0.004 | 9 | 7 | 0.964 | 0.024 | 8 |
| (0.019) | (0.002) | (0.077) | (0.014) | |||||||||||
| CanAnc | 2.79 | 73.3/67.7 | 0.080 | 10 | 1.70 | 66.1/47.7 | 0.299 | 0.996 | 0.003 | 11 | 10 | 0.982 | 0.021 | 11 |
| (0.015) | (0.002) | (0.046) | (0.012) | |||||||||||
| CanNWT | 2.74 | 71.7/60.3 | 0.162 | 21 | 1.60 | 69.5/64.3 | 0.077 | 0.996 | 0.004 | 21 | 14 | 0.986 | 0.010 | 20 |
| (0.006) | (0.002) | (0.022) | (0.006) | |||||||||||
| CanSw | 2.38 | 58.3/43.9 | 0.274 | 5 | 1.71 | 74.9/60.7 | 0.208 | 1.000 | 0.004 | 9 | 3 | 0.700 | 0.004 | 5 |
| (0.019) | (0.002) | (0.218) | (0.003) | |||||||||||
| CanRus | 2.55 | 66.2/62.6 | 0.056 | 11 | 1.71 | 71.0/49.7 | 0.311 | 1.000 | 0.004 | 11 | 7 | 0.818 | 0.014 | 11 |
| (0.014) | (0.002) | (0.119) | (0.008) | |||||||||||
| Overall | 2.62 | 58.7/52.0 | 0.112 | 343 | 1.76 | 75.6/61.3 | 0.088 | – | – | 343 | 6.84 | – | – | 334 |
Nuclear introns were 323–665 bp in length and contained 15–46 variable sites (Appendix S2). PHASE reconstructed 24–117 alleles for the individual introns (Fig. 2A–F; Appendix S2). Probabilities of reconstructed haplotypes ranged primarily from 0.80 to 1.00, although a minority of individuals had probabilities ranging from 0.50% to 0.78 (5% of individuals for chc, 2% for enolase, 12% for gapdh, 2% for ghrel, 17% for mpp, and 2% for od7). We attribute the lower probabilities of reconstructed haplotypes for gapdh and mpp to the high occurrence of autapomorphies (single novel polymorphisms occurring on one allele in one individual) in these loci; 30% and 18% of individuals had novel polymorphisms for gapdh and mpp, respectively. Private alleles were observed for most species at most loci; however, private alleles were only observed in two (enolase and gapdh) or three (chc, enolase, and gapdh) nuclear introns, respectively, for L. glaucoides and L. thayeri (Fig. 2A–F). Observed heterozygosities ranged from 47.7% to 77.3%, with a mean of 61.3% across all populations (Table 1). Populations and loci were in linkage equilibrium and HWE. The inbreeding coefficient (FIS) ranged from –0.171 to 0.311, mean value was 0.088. Inbreeding coefficients for CanAnc and CanRus were significantly larger than expected (α > 0.05) (Table 1). Haplotype (h) and nucleotide (π) diversity ranged from 0.957 to 1.000 and 0.000 to 0.009, respectively (Table 1).
Figure 2.
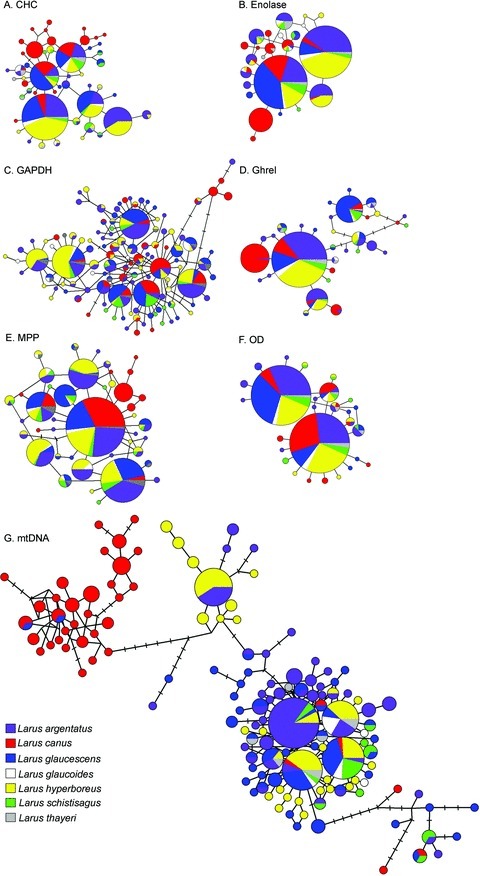
Parsimony networks illustrating relationships of (A) 49 CHC alleles, (B) 24 enolase alleles, (C) 117 GAPDH alleles, (D) 32 ghrel alleles, (E) 42 MPP alleles, (F) 27 OD-7 alleles, and (G) 134 mtDNA control region haplotypes from Arctic gulls, with the size of the circle node corresponding to the frequency of each allele. Each sampled species has a unique color. Tick marks denote unsampled alleles or haplotypes.
We assayed a 392 bp fragment of the mtDNA control region characterized by 54 variable sites among 134 unique haplotypes (Appendix S2; Fig. 2G). Number of haplotypes per population ranged from 2 to 14 (mean = 6.48; Table 1). Private haplotypes were observed for all species (Fig. 2G). Haplotype (h) and nucleotide (π) diversity were high for most populations, with values ranging from 0.286 to 1.000 and 0.001 to 0.024, respectively (Table 1). Five populations had significant Tajima's D estimates (CanRus D=–1.562, P= 0.05; HypIc D=–1.809, P= 0.02; HypNS D=–1.867, P= 0.02; HypYKD D=–1.627, P= 0.04; SmiNWT D=–1.583, P= 0.04); the remaining estimates were not significant.
Spatial genetic structure
Analyses among species
Overall estimates of population subdivision were significant across all marker types (microsatellites FST= 0.129, RST= 0.211; nuclear introns FST= 0.133, ΦST= 0.185; mtDNA FST= 0.122, ΦST= 0.461; Table 2). RecodeData calculated an upper FST limit of 0.415 for the microsatellite data. Therefore, the overall FST of 0.129 accounts for 31.1% of the maximum possible level of genetic structure. Moderate levels of population structure were observed among species at the 11 microsatellite loci and six nuclear loci (Table 2; Appendix S3). Most of the significant inter-population comparisons among species were observed between L. glaucescens populations and all other populations and between L. canus populations and all other populations; values were typically higher when a mutation model was applied to the dataset (RST and ΦST; Appendix S3). In contrast to the nuclear data, high levels of variance in mtDNA haplotypic frequency were observed between most population pairs. As with the nuclear data, most interpopulation comparisons between L. canus and all other species were significant (Appendix S3).
Table 2.
Overall estimates of population genetic structure (FST, RST, and ΦST) calculated within species with multiple populations and among all species of Arctic gull for 11 microsatellite loci, six nuclear introns, and mtDNA control region. Significant values (α= 0.05) are shown in bold text.
| Microsatellites | Introns | mtDNA | ||||
|---|---|---|---|---|---|---|
| FST | RST | FST | ΦST | FST | ΦST | |
| Larus argentatus | 0.056 | 0.051 | 0.114 | 0.075 | 0.117 | 0.218 |
| Larus canus | 0.062 | 0.160 | 0.069 | 0.033 | 0.080 | 0.407 |
| Larus glaucescens | 0.007 | 0.048 | 0.074 | 0.005 | 0.032 | 0.076 |
| Larus hyperboreus | 0.056 | 0.030 | 0.037 | 0.017 | 0.537 | 0.160 |
| Overall | 0.129 | 0.211 | 0.133 | 0.185 | 0.121 | 0.461 |
Our STRUCTURE analyses indicated that ΔK was maximized among all large white-headed gull individuals when K equaled 2 (ΔK= 327.5) and 4 (ΔK= 16.4) for the microsatellite and nuclear intron loci, respectively (Fig. 3). Patterns of individual assignment differed slightly between marker types: L. glaucescens and L. schistisagus individuals were assigned predominantly to one cluster and L. argentatus and L. hyperboreus individuals to the other cluster based on microsatellite data (Fig. 3A). Gulls representing L. thayeri, L. glaucoides, and northern populations of L. argentatus (AaTrm, SmiAK, SmiMN, VegCh, VegYa) and L. hyperboreus (HypYKD) were assigned in approximately equal proportions to both clusters based on microsatellite data (Fig. 3A), a signal consistent with hybridization at the northern locales. Similarly, L. glaucescens individuals were predominantly assigned to a single cluster (blue) based on the nuclear intron data, with L. hyperboreus and some individuals representing L. argentatus (AeFrc, AeIc, AaTrm) predominantly assigned to another cluster (red) (Fig. 3B). The remaining individuals were assigned to the four clusters in approximately equal portions (Fig. 3B).
Figure 3.
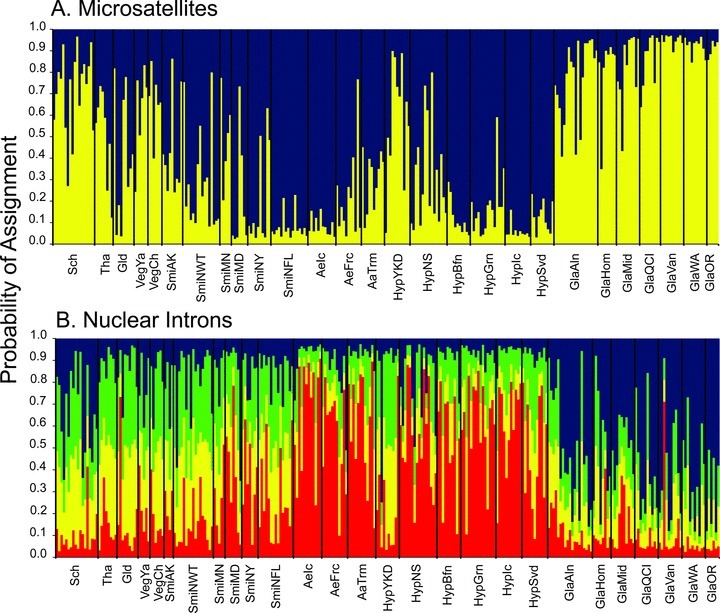
Assignment of Arctic large white-headed gull individuals into (A) two clusters inferred from 11 microsatellite loci and (B) four clusters inferred from six nuclear intron loci in STRUCTURE.
Partitions in the nuclear and mitochondrial genomes appear to conform to subspecific classifications (Fig. 4). Among-group variation (FCT) based on the microsatellite data was maximized when populations were grouped by subspecies or a combination of subspecies and geographic proximity for FST and RST estimates, respectively (Fig. 4). Similarly, among-group variation based on nuclear intron and mtDNA data (FST and ΦST) was maximized by subspecies. Because the high level of structure between L. glaucescens and L. canus populations and all other populations is likely driving variance estimates, we ran additional AMOVAs including only populations of L. argentatus and L. hyperboreus, the other two species represented by multiple populations, to gain additional insight into the partitioning of genetic variation in these species. Among-group variation, as estimated from microsatellite (FST and RST) and nuclear intron frequency data (FST; Fig. 4), was maximized when L. argentatus and L. hyperboreus populations were grouped by geographic proximity regardless of specific or subspecific classification. This is suggestive of contemporary hybridization. In contrast, among-group variance estimates calculated from the mtDNA (FST and ΦST) and nuclear intron (ΦST) sequence data were maximized when populations were grouped by subspecies (Fig. 4).
Figure 4.
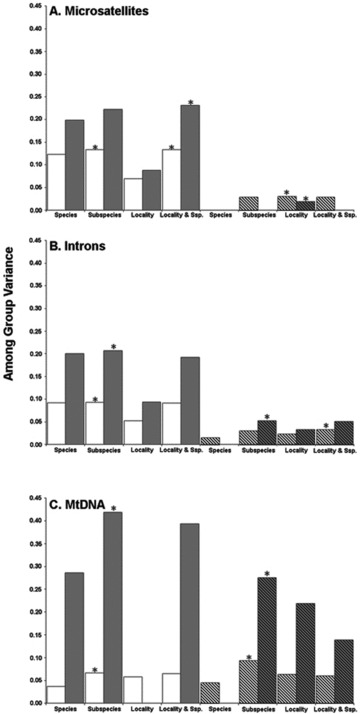
Among group variance (FCT) calculated from (A) 11 micro-satellite loci, (B) six nuclear introns, and (C) mtDNA control region for populations grouped to assess the partitioning of genetic variation in Arctic gulls. FST-based estimates are shown in white and ΦST based estimates are in gray. Significant FCT values are shown with asterisks denoting population groupings maximizing FCT values. Diagonal bars denote variance estimates based on Larus argentatus and L. hyperboreus populations only.
Analyses within species
Variance in microsatellite and nuclear intron allelic frequencies (FST, RST, and ΦST) ranged from 0.030 to 0.114 (Table 2). In contrast to interspecies comparisons, FST values were typically greater than RST values for the microsatellite data, with a few exceptions: between northern and southern populations of L. glaucescens, between the L. argentatus population from Tromsø and other L. argentatus populations, and between populations of L. canus from North America and from Russia populations (Appendix S3). However, we observed few significant interpopulation comparisons based on the nuclear intron data (Appendix S3). Variance in mtDNA haplotypic frequencies (FST) calculated over all populations ranged from 0.080 to 0.537, with larger values observed for most species when the nucleotide substitution model was applied to the data set (ΦST= 0.076–0.406; Table 2).
Across all within taxa analyses, the likelihood generated for the nuclear intron genotypic data was maximized when K equaled 1. In contrast, genetic partitioning was observed based on microsatellite data. Within L. argentatus, ΔK was maximized when K equaled 3 (ΔK= 223.7) (Fig. 5A). Larus argentatus individuals from Alaska and Russia clustered together (blue), individuals breeding on the eastern coast of North America grouped together (yellow), and individuals from Iceland, Tromsø, and France clustered together (red) (Fig. 5A). Larus argentatus individuals from the Northwest Territories were assigned to the blue and yellow clusters in approximately equal frequencies (Fig. 5A). Within L. canus, ΔK was maximized when K equaled 2 (ΔK= 368.4); these two groups corresponded to subspecific classifications, with individuals from North America assigned to one cluster and those from Sweden and Russia to the other (Fig. 5B). ΔK also was maximized when K equaled 2 (ΔK= 452.9) within L. glaucescens, although the assignment of individuals did not correspond to sample locality (Fig. 5C). For L. hyperboreus, ΔK was maximized when K equaled 4 (ΔK= 96.9) (Fig. 5D). The assignment of individuals appeared to correspond loosely to sample locality, although the signal was not strong; individuals from the Yukon-Kuskokwim Delta were assigned predominately to the green cluster, those from Iceland to the yellow cluster, those from northern Alaska and Baffin Island to the blue cluster, and individuals from Greenland and Svalbard to the red cluster (Fig. 5D).
Figure 5.
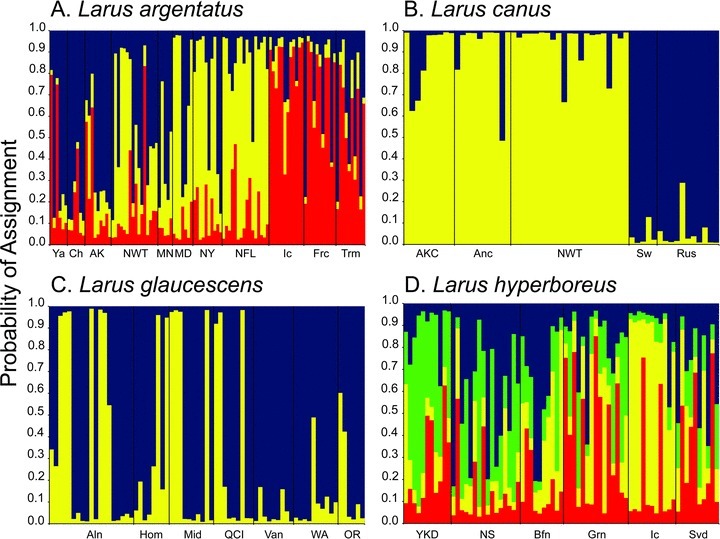
Assignment of (A) Larus argentatus individuals into three clusters, (B) L. canus individuals into two clusters, (C) L. glaucescens individuals into two clusters, and (D) L. hyperboreus individuals into four clusters inferred from 11 microsatellite loci in STRUCTURE.
Population demography
Evidence for significant fluctuations in historical population demography was detected based on microsatellite genotypes. Under the SMM (Table 3), population growth (heterozygote deficiency) was observed for populations of L. schistisagus from Kamchatka Peninsula; L. glaucoides; L. argentatus from Tromsø, France, and Iceland; L. hyperboreus from Greenland, Iceland, Chukotka Peninsula, and Yukon-Kuskokwim Delta; L. glaucescens from Aleutian Islands, Homer, and Middleton Island; and L. canus from south-central Alaska and Northwest Territories. Similar results were observed under the TPM, though fewer populations had signatures of population growth (Table 3).
Table 3.
Results of demographic analyses for 11 microsatellite loci under the stepwise mutation model (SMM), and two-phased model of mutation (TPM), and for sequence data from six introns and the mitochondrial control region calculated from assayed Arctic gull populations. Parameter estimates θ (4Neµ for nuclear DNA, 2Nfµ for mtDNA), exponential growth rate (g), and time of expansion (τ) calculated from mismatch distributions with standard deviations (SD) are provided for each Arctic gull population.
| Microsatellites* | Nuclear introns | mtDNA | |||||
|---|---|---|---|---|---|---|---|
| SMM | TPM | θ | g | θ | g | τ | |
| Sch | H.def. | Eq. | 0.014 | 892.6 | 0.019 | 868.4 | 0.9 |
| (0.010–0.021) | (539.4–943.3) | (0.007–0.076) | (−453.2–1031.0) | (0.3–4.3) | |||
| Tha | Eq. | Eq. | 0.009 | 876.1 | 0.015 | 912.9 | 2.4 |
| (0.005–0.015) | (468.7–932.7) | (0.003–0.147) | (−66.7–1014.9) | (0.5–3.3) | |||
| Gld | H.def. | H.def. | 0.006 | 866.8 | 0.022 | 839.6 | 0.7 |
| (0.004–0.010) | (385.5–922.5) | (0.004–7.764) | (−484.5–990.5) | (0.0–1.5) | |||
| SmiAK | Eq. | Eq. | 0.002 | 851.3 | 0.007 | 882.2 | 3.9 |
| (0.001–0.005) | (174.3–938.7) | (0.001–0.059) | (−297.1–1012.0) | (1.2–6.7) | |||
| SmiMD | Eq. | Eq. | 0.003 | 848.3 | 0.065 | 845.4 | 16.5 |
| (0.002–0.005) | (217.8–934.5) | (0.007–9.030) | (−468.7–1011.4) | (3.3–69.5) | |||
| SmiMN | Eq. | Eq. | 0.003 | 849.4 | 0.006 | 851.3 | 0.0 |
| (0.001–0.008) | (146.8–935.0) | (0.001–6.916) | (−435.8–1020.3) | (0.0–0.5) | |||
| SmiNFL | Eq. | Eq. | 0.005 | 849.0 | 0.010 | 850.0 | 1.1 |
| (0.004–0.007) | (235.2–937.0) | (0.002–0.057) | (−398.3–1008.4) | (0.0–1.9) | |||
| SmiNWT | Eq. | Eq. | 0.012 | 861.3 | 0.110 | 831.1 | 1.2 |
| (0.011–0.017) | (321.5–944.0) | (0.014–8.709) | (−477.0–997.7) | (0.2–2.2) | |||
| SmiNY | Eq. | Eq. | 0.003 | 849.9 | 0.001 | 856.7 | 3.0 |
| (0.002–0.006) | (173.1–932.6) | (0.000–0.122) | (−398.5–1019.6) | (0.0–50.6) | |||
| AaTrm | H.def. | Eq. | 0.003 | 537.7 | 0.006 | 753.1 | 0.0 |
| (0.002–0.005) | (31.4–914.5) | (0.001–0.020) | (−426.9–1002.6) | (0.0–0.0) | |||
| AeFrc | H.def. | H.def. | 0.002 | 843.3 | 4.979 | −287.2 | 0.6 |
| (0.001–0.005) | (159.3–930.7) | (0.021–10.158) | (−496.5–956.8) | (0.0–1.2) | |||
| AeIc | H.def. | Eq. | 0.003 | 862.4 | 0.017 | 496.0 | 10.9 |
| (0.002–0.005) | (201.9–938.3) | (0.006–0.121) | (−416.7–977.7) | (6.0–14.7) | |||
| VegCh | Eq. | Eq. | 0.011 | 846.9 | 0.011 | 784.3 | 2.3 |
| (0.005–0.028) | (251.3–935.4) | (0.002–0.411) | (−472.6–992.0) | (0.2–11.4) | |||
| VegYa | Eq. | Eq. | 0.003 | 849.9 | 0.007 | 884.1 | 6.1 |
| (0.002–0.008) | (123.1–931.8) | (0.001–1.878) | (−369.4–1018.4) | (0.5–9.3) | |||
| HypBfn | Eq. | Eq. | 0.006 | 874.6 | 0.010 | 868.4 | 2.9 |
| (0.004–0.009) | (386.9–953.7) | (0.003–0.085) | (−410.0–1032.4) | (0.9–4.9) | |||
| HypGrn | H.def. | Eq. | 0.005 | 861.9 | 0.007 | 830.8 | 11.4 |
| (0.003–0.008) | (311.2–942.9) | (0.002–0.027) | (−453.8–1000.9) | (0.12–14.7) | |||
| HypIc | H.def. | H.def. | 0.002 | 866.6 | 0.002 | 828.3 | 0.0 |
| (0.001–0.004) | (309.1–948.7) | (0.001–0.010) | (−454.5–1007.1) | (0.0–0.0) | |||
| HypRus | H.def. | Eq. | 0.004 | 869.3 | 0.032 | 867.4 | 1.1 |
| (0.003–0.007) | (316.4–946.3) | (0.009–5.242) | (−422.8–1030.7) | (0.0–4.6) | |||
| HypSvd | Eq. | Eq. | 0.003 | 843.5 | 0.001 | 841.5 | 2.1 |
| (0.003–0.004) | (216.5–932.1) | (0.000–0.013) | (−425.7–1008.5) | (0.7–4.2) | |||
| HypYKD | H.def. | H.def. | 0.010 | 868.3 | 0.017 | 880.4 | 2.3 |
| (0.005–0.014) | (353.5–947.6) | (0.005–0.216) | (−365.4–1022.5) | (0.9–3.5) | |||
| GlaAln | H.def. | H.def. | 0.005 | 814.1 | 0.053 | 371.4 | 1.2 |
| (0.003–0.009) | (226.3–926.2) | (0.015–6.378) | (−471.8–998.5) | (0.0–6.2) | |||
| GlaHom | H.def. | H.def. | 0.006 | 846.7 | 0.008 | 910.9 | 5.8 |
| (0.004–0.012) | (234.7–937.7) | (0.001–0.078) | (−246.1–1013.6) | (1.4–9.7) | |||
| GlaMid | H.def. | H.def. | 0.005 | 860.5 | 1.149 | 541.6 | 11.1 |
| (0.005–0.007) | (300.9–946.2) | (0.039–9.569) | (−493.7–971.9) | (5.1–15.1) | |||
| GlaOR | Eq. | Eq. | 0.002 | 845.6 | 0.005 | 795.8 | 2.0 |
| (0.001–0.005) | (936.3–248.1) | (0.001–0.029) | (−224.4–1000.3) | (0.4–3.5) | |||
| GlaQCI | Eq. | Eq. | 0.002 | 850.2 | 0.067 | 850.2 | 6.6 |
| (0.001–0.003) | (286.6–940.5) | (0.012–7.384) | (−460.2–1031.6) | (3.3–9.5) | |||
| GlaVan | Eq. | Eq. | 0.004 | 853.2 | 0.008 | 94.6 | 6.8 |
| (0.004–0.007) | (166.4–927.5) | (0.003–0.056) | (−471.0–919.3) | (3.1–10.0) | |||
| GlaWA | Eq. | Eq. | 0.005 | 860.9 | 0.025 | 238.0 | 2.1 |
| (0.003–0.008) | (355.7–977.0) | (0.006–0.308) | (−428.2–970.2) | (0.6–6.3) | |||
| CanAKC | Eq. | Eq. | 0.004 | 861.5 | 0.065 | −323.4 | 1.1 |
| (0.003–0.007) | (360.3–944.4) | (0.001–6.146) | (−508.7–972.0) | (0.00–10.1) | |||
| CanAnc | H.def. | Eq. | 0.004 | 871.1 | 0.135 | 279.5 | 12.9 |
| (0.003–0.008) | (425.0–950.8) | (0.018–6.256) | (−441.2–952.9) | (5.1–16.7) | |||
| CanNWT | H.def. | Eq. | 0.007 | 865.9 | 0.052 | 506.9 | 4.1 |
| (0.006–0.008) | (380.7–946.8) | (0.019–0.261) | (−375.7–975.7) | (2.6–4.9) | |||
| CanRus | Eq. | Eq. | 0.006 | 860.5 | 0.006 | 835.8 | 2.5 |
| (0.003–0.009) | (298.7–941.5) | (0.002–0.025) | (−422.2–1005.6) | (0.4–5.4) | |||
| CanSw | Eq. | Eq. | 0.005 | 857.3 | 0.001 | 839.3 | 2.3 |
| (0.003–0.010) | (301.2–939.6) | (0.000–0.014) | (−366.9–1001.2) | (0.0–4.3) | |||
Significant heterozygote deficiency (H.def.) indicates population growth and nonsignificant estimates indicate the population is at equilibrium (Eq).
Significant population growth based on nuclear intron sequences was detected, using LAMARC, for all populations, with theta (4Neµ) ranging from 0.002 to 0.014 (Table 3). In contrast, all populations had a signal of population stability when g was estimated from mtDNA sequence data, consistent with a pattern of populations located in glacial refugia (Lessa et al. 2004). Theta (2Nfµ) ranged from 0.001 to 4.979 (Table 3). Mismatch distributions estimated from mtDNA sequence data failed to reject the sudden expansion model, based on Harpending's raggedness index (Harpending 1994), for any population. Parameter estimates for time of expansion (τ) ranged from 0.0 to 16.5 (Table 3). The smallest values were observed for populations of L. hyperboreus from Iceland, L. argentatus from Minnesota, Tromsø, and France, and L. glaucoides; the largest estimates for populations of L. glaucescens from Middleton Island, L. hyperboreus from Greenland, L. argentatus from Maryland and Iceland, and L. canus from south-central Alaska (Table 3).
Discussion
Multilocus genetic structure within and among species
Despite extensive allele and haplotype sharing among white-headed gull species, genetic substructure was observed within and among species across all marker types. Species and populations at high latitude exhibited lower genetic differentiation then their southern counterparts. Furthermore, individuals breeding at northern latitudes clustered together regardless of species designation, consistent with contemporary hybridization. At least two haplotype/allele groups were observed at each locus; however no haplotype/allele group was represented by a single species at any of the loci. Private alleles and haplotypes were observed for most species at most loci; however, private alleles were only observed in two or three nuclear introns, respectively, for L. glaucoides and L. thayeri (Fig. 2).
Genetic evidence for contemporary hybridization among northern populations of Arctic white-headed gulls is corroborated by field reports (e.g., L. glaucescens×L. hyperboreus; L. argentatus×L. hyperboreus; L. argentatus×L. glaucescens; L. glaucescens×L. schistisagus; L. argentatus×L. schistisagus; L. glaucoides×L. thayeri; Olsen and Larsson 2004 and citations therein). Hybridization would be expected to homogenize allelic frequencies by locality, as neutral loci will remain similar because of introgression and recombination (Mallet 2005). Species appear to have been isolated long enough to have accumulated unique mutations, as indicated by the partitions in the nuclear and mtDNA genomes. Therefore, we contend that hybridization has occurred only recently in Arctic white-headed gull evolutionary history, likely from secondary contact following contemporary range expansion. Introgression of species-specific alleles may be maintained through local adaptation to intermediate habitat types where species coexist, as hybrids have been reported to display adaptive traits of both parental species (L. glaucescens×L. occidentalis; Good et al. 2000).
Recent speciation and contemporary hybridization likely both play a role in the magnitude of allele and haplotype sharing observed among white-headed gulls. Of particular interest is the extent of introgression/hybridization occurring at the northern limits of species’ ranges and among white-headed gulls that breed exclusively at high latitudes. Long-term stable hybrid zones have been reported in temperate areas for several white-headed gull taxa (L. occidentalis×L. glaucescens, Bell 1996; 1997; Good et al. 2000; L. argentatus×L. marinus, Crochet et al. 2003) and may be maintained by hybrid superiority at the hybrid zone (Moore 1977). In contrast, white-headed gull species appear to hybridize pervasively throughout northern latitudes (L. argentatus×L. hyperboreus, Vigfúsdóttir et al. 2008; L. argentatus×L. glaucescens, Williamson and Peyton 1963; L. argenatus×L. schistisagus, Olsen and Larsson 2004; L. glaucoides×L. thayeri, Weir et al. 2000; L. glaucescens×L. schistisagus, Olsen and Larsson 2004) and discrete hybrid zones appear to be absent. Differences in the degree of hybridization may be attributable to the stability of the habitat where these areas of secondary contact occur. Stable secondary contact zones for gulls are observed at temperate latitudes, where presumably habitat has remained relatively stable throughout the last glacial maximum, allowing species to diverge in allopatry without coming into secondary contact during interglacial periods. Conversely, Arctic species reside in more stochastic environments, where suitable habitat repeatedly contracted and expanded during the Pleistocene glacial cycles (Hewitt 2004). These highly variable climatic conditions likely resulted in a cycle of isolation during glacial periods and secondary contact during interglacial periods, potentially limiting species divergence and development of pre- and postzygotic isolating mechanisms.
Comparatively higher estimates of population structure observed for mtDNA than nuclear DNA markers are consistent with Haldane's rule. Haldane's rule states that hybrids of the heterogametic sex will experience reduced fitness (i.e., greater inviability or sterility) relative to those of the homogametic sex (Coyne and Orr 2004). In birds, females are heterogametic; therefore, if hybrid females were experiencing a strong disadvantage relative to hybrid males, observed genetic differentiation would be greater in mtDNA than nuclear markers. In a study of mainly European white-headed gull populations, researchers proposed that the large discrepancy in interspecific comparisons (mtDNA estimates were 3.3–14.5 times greater than estimates using microsatellites) between marker types could be attributed to a strong disadvantage for hybrid females (Crochet et al. 2003). We did observe high levels of interpopulation comparisons among species for mtDNA (ΦST= 0.130–0.821; Appendix S3) with no significant comparisons at nuclear markers. However, Haldane's rule would presumably have the greatest influence at secondary contact zones. In these areas, 23% (5/22; Appendix S3) of the comparisons had significant mtDNA estimates. Of those five, only two comparisons (HypYKD × VegCh, HypIc × AeIc) had proportionally greater degree of divergence than can be explained by differences in the effective population size between genomes (Zink and Barrowclough 2008) and maximum possible FST value (Meirmans 2006), although differences were slight (HypYKD × VegCh, FSTExp. = 0.039, FSTObs. = not significant; HypIc × AeIc, FSTExp. = 0.051, FSTObs. = not significant). Therefore, Haldane's rule does not appear to apply to the white-headed gull species studied here.
The lower FST values observed at nuclear fragment assays (i.e., microsatellites) relative to mtDNA sequence data among species may be attributable to fragment length homoplasy, through not identifying unique alleles because fragments of the same length may have different sequences or may have mutated back to the ancestral state. Both types of homoplasy could pose problems when assessing population structure with fragment analysis based on detecting allelic frequency differences among populations. Most interpopulation comparisons among species have higher RST than FST estimates, indicating that the mutation process, and therefore homoplasy, is having an effect on estimators of population subdivision. Caution should be taken when interpreting pairwise population comparisons of allelic variance among species. Rousset (1996) showed that there are no simple effects of homoplasy on estimators of population differentiation (FST and RST) for loci evolving under the SMM and island model of migration, making it difficult to assess potential biases in estimates. However, we observed similar signals of population structure based on microsatellite and nuclear intron data. Therefore, the differences in the degree of population structure observed between the genomes studied here may be more attributable to introgression reducing the rate of lineage sorting in the nuclear genome and, to a lesser extent, fragment length homoplasy, although experimental evidence is needed to test this hypothesis.
Pleistocene refugia and comparisons with other taxa
Two distinct mtDNA haplotype groups were observed within L. argentatus, L. canus, and L. hyperboreus, the three sampled taxa with circumpolar distributions, consistent with other studies on white-headed gulls (Fig. 2G; Liebers et al. 2004; Sternkopf et al. 2010). A pattern of at least two allele groups was also observed for the nuclear intron loci (Fig. 2A–F). Concordance in haplotype and allele groups suggests that white-headed gulls were subdivided into at least two refugia that persisted for extended periods of time during the Pleistocene. Furthermore, substructuring observed within mtDNA corresponds to locality. The small central haplotype group is represented by L. argentatus individuals from Iceland and Tromsø and L. hyperboreus individuals from Iceland, Greenland, Svalbard, and a single individual from northern Alaska (Fig. 2G, population data not shown). All populations of L. argentatus are represented in the large haplotype group; however, only North American and Greenland L. hyperboreus individuals (and a single individual from Iceland) are observed within this group (Fig. 2G, population data not shown). These findings differ from those of Sternkopf et al. (2010), who identified genetic similarity between L. hyperboreus and L. a. smithsonianus (the North American subspecies); we did not observe a haplotype group restricted to North America in L. argentatus. The presence of a primarily Scandinavian/Greenland/Iceland haplotype group indicates the restriction of at least L. argentatus and L. hyperboreus into a high-latitude refugium in the North Atlantic/Arctic Ocean, possibly Spitsbergen Bank or northwest Norway. Furthermore, given the restricted geographical distribution of L. hyperboreus haplotypes within the central clade, the Scandinavian/Greenland/Iceland refugium was likely isolated from other L. hyperboreus populations and did not substantially contribute to the postglacial colonization of North America and Europe.
Despite the presence of species with distributions restricted to northern latitudes, suggestive of restriction to Pleistocene refugia, we were unable to identify glacial refugia for the white-headed gulls studied here based on the coalescent. White-headed gulls are characterized by strong dispersal ability and a propensity to hybridize in areas of secondary contact, as is reflected in contemporary accounts of long-range colonization and subsequent hybridization (Pierotti 1987; Olsen and Larsson 2004; Vigfúsdóttir et al. 2008). The tendency for hybridization at areas of secondary contact is very strong: 16 of the 18 species (89%) are reported to hybridize in nature (Pierotti 1987; Olsen and Larsson 2004 and citations therein) and appear to be free of postzygotic barriers to hybridization (Shields 1987; Snell 1991). Hybridization and subsequent introgression may have erased the genetic legacy of the Pleistocene for white-headed gulls; reductions in effective population sizes associated with the restriction to glacial refugia were not observed, even for populations currently located in glaciated areas. Alternatively, historic Arctic white-headed gull populations that were restricted south and north of the ice sheets likely followed habitat made available by the retreating glacial ice sheets to present day locations. Short movements from refugia would have allowed these historical populations to retain genetic diversity because effective population sizes would not be reduced (Hewitt 1996), especially if colonization occurred over a long period. However, it is unlikely that all populations studied here colonized slowly subsequent to glacial retreat, given the dispersal and colonization ability of Arctic white-headed gulls. Therefore, a more parsimonious explanation is that the strong tendency for hybridization in this group erased the genetic signature of Pleistocene refugia.
Holarctic species typically exhibit shallow but clear phylogeographic signal, due to fragmentation of the distributions of these species into high-latitude glacial refugia, resulting in genetic and morphological differentiation across ranges (Hewitt 2004). Although Arctic white-headed gulls have morphologically distinct forms across their distribution (i.e., subspecies), limited population genetic subdivision among northern Arctic white-headed gull populations was observed. The combination of limited sorting among species (Liebers et al. 2004; Pons et al. 2005) and morphological diversity of taxa, as is evident in gulls, is suggestive of recent allopatric fragmentation and restriction to multiple glacial refugia. Indeed, four populations of gulls (L. hyperboreus from Greenland, L. glaucescens from Middleton Island, L. argentatus from Iceland, and L. canus from south-central Alaska) have larger time-of-divergence estimates than other sampled populations and coincide with proposed high-latitude glacial refugia for other taxa (Ploeger 1968). Historical and contemporary hybridization among regions, coupled with small effective population sizes, could have overwhelmed the genetic uniqueness accumulated by northern populations during the last glacial maximum, producing a signal of low genetic structure.
Arctic white-headed gulls are less genetically differentiated at the northern limits of their distribution; this pattern was observed both among species that breed exclusively at high latitudes (L. schistisagus, L. glaucoides, L. thayeri, and L. hyperboreus) and within species (e.g., L. argentatus and L. glaucescens). Liebers and Helbig (2002) observed this pattern between L. fuscus and L. cachinnans; L. fuscus exhibited less genetic structure than its southern counterpart L. cachinnans. The authors proposed that differences in the degree of population subdivision indicated that northern gulls are phylogenetically younger than their southern counterparts and were more affected by glacial cycles. In contrast, their southern relatives would have been able to maintain larger long-term stable population sizes during glacial periods. Although Liebers and Helbig's (2002) hypothesis is consistent with observations within Europe, it may not apply to the North American species studied here. In contrast to Europe, high-latitude glacial refugia, notably Beringia, were present in North America during the last glacial maximum and likely promoted genetic diversification in Arctic taxa (Hewitt 2004). As glacial ice sheets retreated, the ranges of temperate species likely expanded northward and came into contact with northern “refugial” populations. Hybridization between “newly arriving” temperate species and northern “refugial” gull species provides an alternate hypothesis for the genetic pattern of decreasing genetic differentiation with increasing latitude.
Arctic white-headed gulls appear to be unique among the Arctic fauna in the spatial distribution of their alleles across species. Previous studies of genetic substructuring among closely related Arctic species reported species-specific clades often correlated with geography (e.g., Tetraoninae, Drovetski 2003; Lemmus spp., Fedorov et al. 2003; Motacilla spp., Pavlova et al. 2003; Lepus spp., Waltari and Cook 2005; Ovis spp., Loehr et al. 2006; Riparia spp., Pavlova et al. 2008). Limited lineage sorting among these seven gull species is noteworthy given that genetic subdivision is regularly observed within individual Arctic breeding species (e.g., Calidris alpina, Wenink et al. 1996; Troglodytes troglodytes, Drovetski 2003; Rangifer tarandus, Flagstad and Røed 2003; Branta canadensis, Scribner et al. 2003; Myodes rutilus, Cook et al. 2004; Microtus oeconomus, Galbreath and Cook 2004; Myopus schisticolor, Fedorov et al. 2008; Pinicola enucleator, Drovetski et al. 2010; Somateria mollissima, Sonsthagen et al. 2011). Aspects of white-headed gull behavioral biology, such as colonization ability and propensity to hybridize, as well as their recent evolutionary history, have likely played a large role in the limited genetic structure observed.
Acknowledgments
Funding was provided by the Federal Aviation Administration (FAA) and the Laboratories of Analytical Biology and Division of Birds, National Museum of Natural History, Smithsonian Institution. We thank the following for their significant contributions of tissues for this work: N. Rice, Academy of Natural Sciences of Philadelphia; P. Sweet, American Museum of Natural History; R. Zink and M. Westberg, Bell Museum of Natural History; S. Birks, Burke Museum of Natural History and Culture; D. Boertmann, National Environmental Research Group, Denmark; D. Willard, Field Museum of Natural History; R. Brumfield and D. Dittmann, Louisiana State University Museum of Natural Science; K. Garrett, Natural History Museum of Los Angeles County; J. Dean, National Museum of Natural History; J. Hudon, Royal Alberta Museum; A. Baker and O. Haddrath, Royal Ontario Museum; K. Winker and D. Gibson, University of Alaska Museum; and R. Bowie and C. Cicero, University of California Berkeley Museum of Vertebrate Zoology. We would also like to thank the numerous individuals that helped facilitate field work for the various museums; J. Hunt, Smithsonian Institution, who provided technical laboratory support; C. Milensky and F. Dahlan, Smithsonian Institution, for assistance with sample collection and preparation; and A. Driskell, M. Heacker, and L. Weigt, Smithsonian Institution, K. Omland, University of Maryland Baltimore County, and R. Wilson, University of Alaska Fairbanks, for their guidance and advice throughout this project, as well as two anonymous reviewers comments on earlier drafts of this manuscript. Any use of trade, product, or firm names is for descriptive purposes only and does not imply endorsement by the U.S. Government.
Support information
Appendix S1. Collection localities and museum catalogue number for museum voucher specimens used in this study.
Appendix S2. Primer sequences, PHASE and MODELTEST results for assayed nuclear intron and mtDNA control region loci.
Appendix S3. Interpopulation FST,RST, and ΦST values calculated among Arctic gull populations.
References
- Akaike H. A new look at the statistical model identification. IEEE Trans. Autom. Control. 1974;19:716–723. [Google Scholar]
- Avise JC. Phylogeography: the history and formation of species. Cambridge, MA: Harvard Univ. Press; 2000. [Google Scholar]
- Bandelt HJ, Forster P, Sykes BC, Richards MB. Mitochondrial portraits of human populations. Genetics. 1995;141:743–753. doi: 10.1093/genetics/141.2.743. [DOI] [PMC free article] [PubMed] [Google Scholar]
- Banks RC, Chesser RT, Cicero C, Dunn JL, Kratter AW, Lovette IJ, Rasmussen PC, Remsen JV, Jr, Rising JD, Stotz DF, et al. Forty-ninth supplement to the American Ornithologists Union check-list of North American birds. Auk. 2008;125:758–768. [Google Scholar]
- Bell DA. Genetic differentiation, geographic variation and hybridization in gulls of the Larus glaucescens–occidentalis complex. Condor. 1996;98:527–546. [Google Scholar]
- Bell DA. Hybridization and reproductive performance in gulls of the Larus glaucescens–occidentalis complex. Condor. 1997;99:585–594. [Google Scholar]
- Cook JA, Runck AM, Conroy CJ. Historical biogeography at the crossroads of the northern continents: molecular phylogenetics of red-backed voles (Rodentia: Arvicolinae) Mol. Phylogenet. Evol. 2004;30:767–777. doi: 10.1016/S1055-7903(03)00248-3. [DOI] [PubMed] [Google Scholar]
- Cornuet JM, Luikart G. Description and power analysis of two tests for detecting recent population bottlenecks from allele frequency data. Genetics. 1996;144:2001–2014. doi: 10.1093/genetics/144.4.2001. [DOI] [PMC free article] [PubMed] [Google Scholar]
- Coyne JA, Orr HA. Speciation. Sunderland, MA: Sinauer Associates; 2004. [Google Scholar]
- Crochet P-A, Chen JZ, Pons J-M, Lebreton J-D, Hebert PDN, Bohnomme F. Genetic differentiation at nuclear and mitochondrial loci among large white-headed gulls: sex-biased interspecific gene flow? Evolution. 2003;57:2865–2878. doi: 10.1111/j.0014-3820.2003.tb01527.x. [DOI] [PubMed] [Google Scholar]
- DeWoody JA, Schupp J, Kenefic L, Busch J, Murfitt L, Keim P. Universal method for producing ROX-labeled size standards suitable for automated genotyping. BioTechniques. 2004;37:348–352. doi: 10.2144/04373BM02. [DOI] [PubMed] [Google Scholar]
- Drovetski SV. Plio-Pleistocene climatic oscillations, Holarctic biogeography and speciation in an avian subfamily. J. Biogeogr. 2003;30:1173–1181. [Google Scholar]
- Drovetski SV, Zink RM, Ericson PGP, Fadeev IV. A multilocus study of pine grosbeak phylogeography supports the pattern of greater intercontinental divergence in Holarctic boreal forest birds than in birds inhabiting other high-latitude habitats. J. Biogeogr. 2010;37:696–706. [Google Scholar]
- Evanno G, Regnaut S, Goudet J. Detecting the number of clusters of individuals using the software STRUCTURE: a simulation study. Mol. Ecol. 2005;14:2611–2620. doi: 10.1111/j.1365-294X.2005.02553.x. [DOI] [PubMed] [Google Scholar]
- Excoffier L, Smouse PE, Quatro JM. Analysis of molecular variance from metric distances among DNA haplotypes: applications to human mitochondrial DNA restriction data. Genetics. 1992;131:479–491. doi: 10.1093/genetics/131.2.479. [DOI] [PMC free article] [PubMed] [Google Scholar]
- Fedorov V, Goropashnaya AV, Jaarola M, Cook JA. Phylogeography of lemmings (Lemmus): no evidence for postglacial colonization of Arctic from the Beringian refugium. Mol. Ecol. 2003;12:725–731. doi: 10.1046/j.1365-294x.2003.01776.x. [DOI] [PubMed] [Google Scholar]
- Fedorov V, Goropashnaya AV, Boeskorov GG, Cook JA. Comparative phylogeography and demographic history of the wood lemming (Myopus schisticolor): implications for late Quaternary history of the taiga species in Eurasia. Mol. Ecol. 2008;17:598–610. doi: 10.1111/j.1365-294X.2007.03595.x. [DOI] [PubMed] [Google Scholar]
- Flagstad Ø, Røed KH. Refugial origins of reindeer (Rangifer tarandus L.) inferred from mitochondrial DNA sequences. Evolution. 2003;57:658–670. doi: 10.1111/j.0014-3820.2003.tb01557.x. [DOI] [PubMed] [Google Scholar]
- Fluxus Technology Ltd. NETWORK 4.5.1.0. Distributed over the internet. 2008. Available at http://www.fluxus-engineering.com. Accessed February 1, 2009.
- Galbreath KE, Cook JA. Genetic consequences of Pleistocene glaciations for the tundra vole (Microtus oeconomus) in Beringia. Mol. Ecol. 2004;13:135–148. doi: 10.1046/j.1365-294x.2004.02026.x. [DOI] [PubMed] [Google Scholar]
- Gay L, Neubauer G, Zagalska-Neubauer M, Bebain C, Pons J-M, David P, Crochet P-A. Molecular and morphological patterns of introgression between two large white-headed gull species in a zone of recent secondary contact. Mol. Ecol. 2007;16:3215–3227. doi: 10.1111/j.1365-294X.2007.03363.x. [DOI] [PubMed] [Google Scholar]
- Given AD, Mills JA, Baker AJ. Isolation of polymorphic microsatellite loci from the red-billed gull (Larus novaehollandiae scopulinus) and amplification in related species. Mol. Ecol. Notes. 2002;2:416–418. [Google Scholar]
- Good TP, Ellis JC, Annett CA, Pierottie R. Bounded hybrid superiority in an avian hybrid zone: effects of mate, diet, and habitat choice. Evolution. 2000;54:1774–1783. doi: 10.1111/j.0014-3820.2000.tb00721.x. [DOI] [PubMed] [Google Scholar]
- Goudet J. FSTAT vers. 1.2: a computer program to calculate F-statistics. J. Hered. 1995;86:485–486. [Google Scholar]
- Gregory SM, Quinn JS. Microsatellite isolation from four avian species comparing two isolation techniques. Mol. Ecol. Notes. 2006;6:87–89. [Google Scholar]
- Harpending RC. Signature of ancient population growth in a low-resolution mitochondrial DNA mismatch distribution. Hum. Biol. 1994;66:591–600. [PubMed] [Google Scholar]
- Harrigan RJ, Mazza ME, Sorenson MD. Computation vs. cloning: evaluation of two methods for haplotype determination. Mol. Ecol. Res. 2008;8:1239–1248. doi: 10.1111/j.1755-0998.2008.02241.x. [DOI] [PubMed] [Google Scholar]
- Hedrick PW. A standardized genetic differentiation measure. Evolution. 2005;59:1633–1638. [PubMed] [Google Scholar]
- Hewitt GM. Some genetic consequences of ice ages, and their role in divergence and speciation. Biol. J. Linn. Soc. 1996;58:247–276. [Google Scholar]
- Hewitt GM. The genetic legacy of the Quaternary ice ages. Nature. 2000;405:907–913. doi: 10.1038/35016000. [DOI] [PubMed] [Google Scholar]
- Hewitt GM. Speciation, hybrid zones and phylogeography—or seeing genes in space and time. Mol. Ecol. 2001;10:537–549. doi: 10.1046/j.1365-294x.2001.01202.x. [DOI] [PubMed] [Google Scholar]
- Hewitt GM. Genetic consequences of climatic oscillations in the Quaternary. Philos. Trans. R. Soc. Lond. B. Biol. Sci. 2004;359:183–195. doi: 10.1098/rstb.2003.1388. [DOI] [PMC free article] [PubMed] [Google Scholar]
- Kuhner MK. LAMARC 2.0: maximum likelihood and Bayesian estimation of population parameters. Bioinformatics. 2006;22:768–770. doi: 10.1093/bioinformatics/btk051. [DOI] [PubMed] [Google Scholar]
- Kuhner MK, Smith LP. Comparing likelihood and Bayesian coalescent estimation of population parameters. Genetics. 2007;175:155–165. doi: 10.1534/genetics.106.056457. [DOI] [PMC free article] [PubMed] [Google Scholar]
- Lessa EP, Cook JA, Patton JL. Genetic footprints of demographic expansion in North America, but not Amazonia, during the Late Quaternary. Proc. Natl. Acad. Sci. USA. 2004;100:10331–10334. doi: 10.1073/pnas.1730921100. [DOI] [PMC free article] [PubMed] [Google Scholar]
- Liebers D, Helbig AJ. Phylogeography and colonization history of lesser black-backed gulls (Larus fuscus) as revealed by mtDNA sequences. J. Evol. Biol. 2002;15:1021–1033. [Google Scholar]
- Liebers D, Helbig AJ, de Kniff P. Genetic differentiation and phylogeography of gulls in the Larus cachinnans-fuscus group (Aves: Charadriiformes) Mol. Ecol. 2001;10:2447–2462. doi: 10.1046/j.0962-1083.2001.01370.x. [DOI] [PubMed] [Google Scholar]
- Liebers D, de Kniff P, Helbig AJ. The herring gull complex is not a ring species. Proc. R. Soc. Lond. B. 2004;271:893–901. doi: 10.1098/rspb.2004.2679. [DOI] [PMC free article] [PubMed] [Google Scholar]
- Loehr J, Worley K, Grapputo A, Carey J, Veitch A, Coltman DW. Evidence for cryptic glacial refugia from North American mountain sheep mitochondrial DNA. J. Evol. Biol. 2006;19:419–430. doi: 10.1111/j.1420-9101.2005.01027.x. [DOI] [PubMed] [Google Scholar]
- Mallet J. Hybridization as an invasion of the genome. Trends Ecol. Evol. 2005;20:292–237. doi: 10.1016/j.tree.2005.02.010. [DOI] [PubMed] [Google Scholar]
- Meirmans PG. Using the AMOVA framework to estimate a standardized genetic differentiation measure. Evolution. 2006;60:2399–2402. [PubMed] [Google Scholar]
- Moore WS. An evaluation of narrow hybrid zones in vertebrates. Q. Rev. Biol. 1977;52:263–277. [Google Scholar]
- Olsen KM, Larsson H. Gulls of North America, Europe, and Asia. New Jersey: Princeton Univ. Press; 2004. [Google Scholar]
- Pavlova A, Zink RM, Drovetski SV, Redkin Y, Rohwer S. Phylogeographic patterns in Motacilla flava and Motacilla citreola: species limits and population history. Auk. 2003;120:774–758. [Google Scholar]
- Pavlova A, Zink RM, Drovetski SV, Rohwer S. Pleistocene evolution of closely related sand martins Riparia riparia and R. diluta. Mol. Phylogenet. Evol. 2008;48:61–73. doi: 10.1016/j.ympev.2008.03.030. [DOI] [PubMed] [Google Scholar]
- Pierotti R. Isolating mechanisms in seabirds. Evolution. 1987;41:559–570. doi: 10.1111/j.1558-5646.1987.tb05826.x. [DOI] [PubMed] [Google Scholar]
- Ploeger PL. Geographical differentiation in arctic Anatidae as a result of isolation during the last glacial period. Ardea. 1968;56:1–159. [Google Scholar]
- Pons J-M, Hassanin A, Crochet P-A. Phylogenetic relationships within the Laridae (Charadriiformes: Aves) inferred from mitochondrial markers. Mol. Phylogenet. Evol. 2005;37:686–699. doi: 10.1016/j.ympev.2005.05.011. [DOI] [PubMed] [Google Scholar]
- Posada D, Crandall KA. Modeltest: testing the model of DNA substitution. Bioinformatics. 1998;14:817–818. doi: 10.1093/bioinformatics/14.9.817. [DOI] [PubMed] [Google Scholar]
- Pritchard JK, Stephens M, Donnelly P. Inference of population structure from multilocus genotype data. Genetics. 2000;155:945–959. doi: 10.1093/genetics/155.2.945. [DOI] [PMC free article] [PubMed] [Google Scholar]
- Rogers AR, Harpending H. Population growth makes waves in the distribution of pairwise genetic differences. Mol. Biol. Evol. 1992;9:552–569. doi: 10.1093/oxfordjournals.molbev.a040727. [DOI] [PubMed] [Google Scholar]
- Rousset F. Equilibrium values of measures of population subdivision for stepwise mutation processes. Genetics. 1996;142:1357–1362. doi: 10.1093/genetics/142.4.1357. [DOI] [PMC free article] [PubMed] [Google Scholar]
- Schafer AB, Cullingham CI, Cote SD, Coltman DW. Of glaciers and refugia: a decade of study sheds new light on the phylogeography of northwestern North America. Mol. Ecol. 2010;19:4589–4621. doi: 10.1111/j.1365-294X.2010.04828.x. [DOI] [PubMed] [Google Scholar]
- Schmitt T. Molecular biogeography of Europe: Pleistocene cycles and postglacial trends. Front. Zool. 2007;4:11. doi: 10.1186/1742-9994-4-11. [DOI] [PMC free article] [PubMed] [Google Scholar]
- Schneider S, Roessli D, Excoffier L. ARLEQUIN ver. 2.0: a software for population genetic data analysis. Geneva: Genetics and Biometry Laboratory, University of Geneva; 2000. [Google Scholar]
- Scribner KT, Talbot SL, Pearce JM, Pierson BJ, Bollinger KS, Derksen DV. Phylogeography of Canada geese (Branta canadensis) in Western North America. Auk. 2003;120:889–907. [Google Scholar]
- Shields GF. Chromosomal variation. In: Cooke F, Buckley PA, editors. Avian genetics: a population and ecological approach. New York: Academic Press; 1987. pp. 79–104. [Google Scholar]
- Snell RR. Interspecific allozyme differentiation among North-Atlantic white-headed Larid gulls. Auk. 1991;108:319–328. [Google Scholar]
- Sonsthagen SA, Talbot SL, McCracken KG. Genetic characterization of common eiders (Somateria mollissima) breeding in the Yukon Kuskokwim Delta, Alaska. Condor. 2007;109:879–894. [Google Scholar]
- Sonsthagen SA, Talbot SL, Scribner KT, McCracken KG. Multilocus phylogeography and population structure of common eiders breeding in North America and Scandinavia. J. Biogeogr. 2011;38:1368–1380. [Google Scholar]
- Stephens M, Smith N, Donnelly P. A new statistical method for haplotype reconstruction from population data. Am. J. Hum. Genet. 2001;68:978–989. doi: 10.1086/319501. [DOI] [PMC free article] [PubMed] [Google Scholar]
- Sternkopf V, Liebers-Helbig D, Ritz MS, Zhang J, Helbig AJ, de Knijff P. Introgressive hybridization and the evolutionary history of the herring gull complex revealed by mitochondrial and nuclear DNA. BMC Evol. Biol. 2010;10:348. doi: 10.1186/1471-2148-10-348. [DOI] [PMC free article] [PubMed] [Google Scholar]
- Tajima F. The effect of change in population size on DNA polymorphism. Genetics. 1989;123:597–601. doi: 10.1093/genetics/123.3.597. [DOI] [PMC free article] [PubMed] [Google Scholar]
- Tirard C, Helfenstein F, Danchin E. Polymorphic microsatellites in the black-legged kittiwake Rissa tridactyla. Mol. Ecol. Notes. 2002;2:431–433. [Google Scholar]
- Velichko AA, Kononov YM, Faustova MA. The last glaciation of Earth: Size and volume of ice-sheets. Quatern. Int. 1997;41–42:43–51. [Google Scholar]
- Vigfúsdóttir F, Pálsson S, Ingólfsson A. Hybridization of glaucous gull (Larus hyperboreus) and herring gull (Larus argentatus) in Iceland: mitochondrial and microsatellite data. Philos. Trans. R. Soc. B. 2008;363:2851–2860. doi: 10.1098/rstb.2008.0042. [DOI] [PMC free article] [PubMed] [Google Scholar]
- Waltari E, Cook JA. Hares on ice: phylogeography and historical demographics of Lepus arcticusL. othus, and L. timidus (Mammalia: Lagomorpha) Mol. Ecol. 2005;14:3005–3016. doi: 10.1111/j.1365-294X.2005.02625.x. [DOI] [PubMed] [Google Scholar]
- Weir DN, Kitchener AC, McGowan RY. Hybridization and changes in the distribution of Iceland gulls (Larus glaucoides/kumlieni/thayeri. J. Zool. 2000;252:517–530. [Google Scholar]
- Wenink PW, Baker AJ, Rosner H-U, Tilanus MGJ. Global mitochondrial DNA phylogeography of Holarctic breeding dunlins (Calidris alpina. Evolution. 1996;50:318–330. doi: 10.1111/j.1558-5646.1996.tb04495.x. [DOI] [PubMed] [Google Scholar]
- Williams M, Dunkerley D, De Deckker P, Kershaw P, Chappel J. Quaternary Environments. New York: Oxford Univ. Press; 1998. [Google Scholar]
- Williamson FSL, Peyton LJ. Interbreeding of glaucous-winged and herring gulls in the Cook Inlet Region, Alaska. Condor. 1963;65:24–28. [Google Scholar]
- Zink RM, Barrowclough GF. Mitochondrial DNA under siege in avian phylogeography. Mol. Ecol. 2008;17:2107–2121. doi: 10.1111/j.1365-294X.2008.03737.x. [DOI] [PubMed] [Google Scholar]
Associated Data
This section collects any data citations, data availability statements, or supplementary materials included in this article.