Abstract
OBJECTIVE
We evaluated the effects of mixed meals differing in glycemic index (GI) and carbohydrate content on postprandial serum glucose and insulin response, hunger, and satiety over the course of a 12-h day.
RESEARCH DESIGN AND METHODS
In this randomized crossover trial, 26 overweight or obese adults received four diets in random order (high GI, high carbohydrate [HGI-HC]; high GI, low carbohydrate [HGI-LC]; low GI, high carbohydrate [LGI-HC]; and low GI, low carbohydrate [LGI-LC]). All meals were prepared by a metabolic kitchen. Participants received breakfast, lunch, and dinner over the course of a 12-h day. Primary outcomes were postprandial serum glucose and insulin quantified as area under the curve. Hunger, fullness, and satiety were assessed by visual analog scale.
RESULTS
The HGI-LC, LGI-HC, and LGI-LC diets significantly reduced glucose and insulin area under the curve compared with the HGI-HC diet (P < 0.001 for all comparisons). There were no significant differences in ratings of hunger, fullness, or satiety between the different dietary treatments.
CONCLUSIONS
Reducing the GI or carbohydrate content of mixed meals reduces postprandial glycemia and insulinemia, and these changes can be sustained over the course of an entire day. However, there were no differences in subjective hunger and satiety ratings between the diets. These results demonstrate that maintaining a low GI or glycemic load diet is an effective method of controlling serum glucose and insulin levels.
The extent to which a food raises blood glucose after its consumption is ranked using the glycemic index (GI) and the glycemic load (GL), which is calculated by multiplying the GI of the food by the amount of carbohydrate. Foods with a high GI are those that cause a large and rapid rise in blood glucose, whereas those with a low GI produce small fluctuations in blood glucose. It is believed that low GI foods are advantageous for health because the swings in glucose and insulin production are minimized. This is especially important for persons who are insulin resistant or diabetic (1,2). Epidemiological studies have linked low GI or low GL diets with reduced risk of developing diabetes and cardiovascular disease (3). A low GI or GL diet may also aid in weight loss, although the findings thus far have been inconsistent (4). It is believed that low GI diets may aid weight control by 1) promoting satiety and 2) by promoting fat oxidation over carbohydrate oxidation.
Many short-term studies have demonstrated that consumption of low GI foods reduced hunger and increases satiety compared with high GI food; however, many of these experiments were confounded by differences in other variables such as macronutrient content, energy density, and palatability (5). In the studies that did control for these variables, the results were mixed as to whether low GI foods delay hunger and promote satiety (5). Early studies examined the effect of individual compounds or food items on glycemic response and satiety. However, people usually eat complex mixed meals, not individual food items.
In this study, we examined the effect of altering both GI and the amount of carbohydrate in well-defined mixed meals on postprandial glucose and insulin response in overweight and obese subjects over the course of a 12-h day. We also assessed effects on subjective hunger and satiety.
RESEARCH DESIGN AND METHODS
Participants
Healthy male and female volunteers, 18–70 years of age, were recruited from the greater Baton Rouge, Louisiana area. Eligible participants were free of chronic disease with fasting serum glucose levels of ≤125 mg/dL and a BMI between 25 and 35 kg/m2. The study was approved by the Institutional Review Board at Pennington Biomedical Research Center; all subjects provided written informed consent.
Study design
Participants were randomly assigned to one of four possible diet sequences. There was at least a 3-day washout period in between diets. Women were only tested during the luteal phase of their menstrual cycle. All foods were prepared and provided by the Pennington Metabolic Kitchen Core. For each diet period, participants were fed a standard American diet (34% fat, 15% protein, 51% carbohydrate) for 3 days in order to control for diet prior to test days. Clinicians often recommend that patients consume a diet rich in carbohydrates prior to oral glucose tolerance testing (6). The energy level of the diet was individualized based on each participant’s estimated resting metabolic rate. Participants were required to consume breakfast and dinner at the Pennington Center. Lunch was provided as takeout. On day 4, participants consumed all their meals for their assigned diet in clinic. Participants were asked to consume their meals within 20 min with breakfast centered at 8:00 a.m. Lunch was provided ∼4 h following completion of breakfast and dinner ∼4 h following completion of lunch. Participants were required to eat all food provided.
Diets
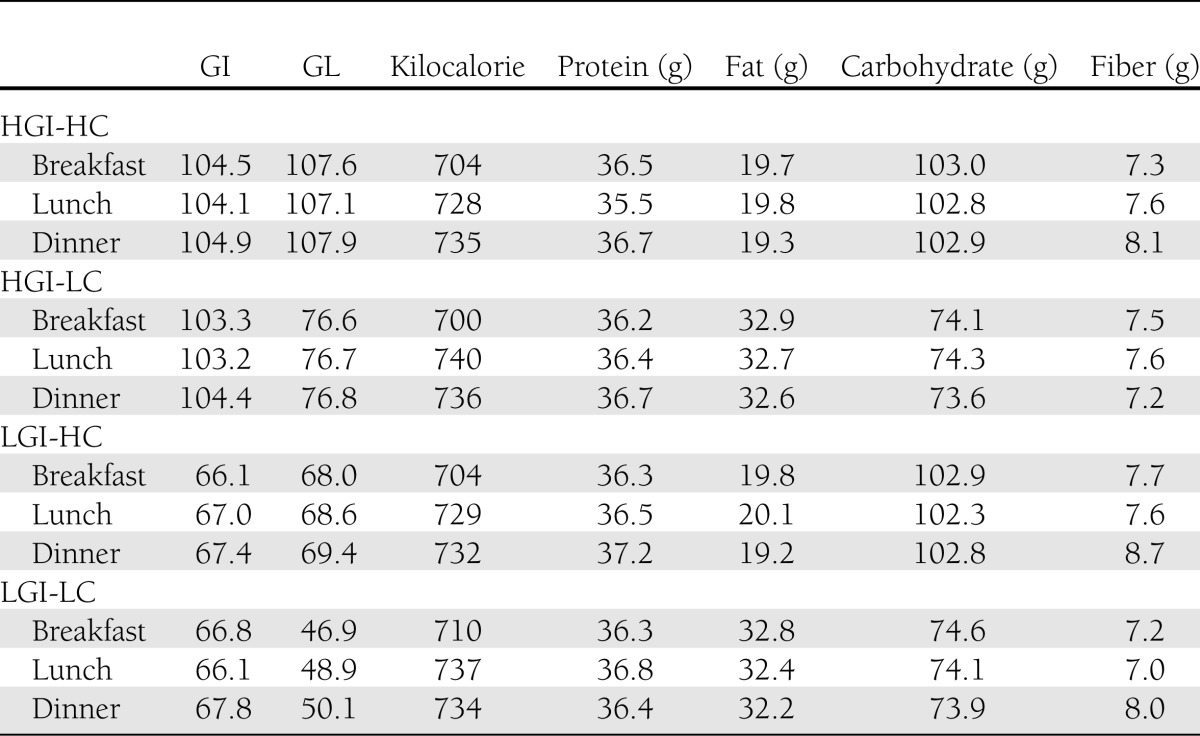
One daily menu, including breakfast, lunch, and dinner, was constructed for four isocaloric diets differing in GL by manipulation of GI based on white bread values and percent energy from carbohydrate. Energy from protein was held at 20%, and fat varied with carbohydrate. Dietary fiber was also held constant among diets with the addition of cellulose when needed. The meals consisted of mixed foods (casseroles) that matched the diets’ GI and percent energy from carbohydrate as closely as possible. Table 1 provides a summary of the test diets (high GI, high carbohydrate [HGI-HC]; high GI, low carbohydrate [HGI-LC]; low GI, high carbohydrate [LGI-HC]; and low GI, low carbohydrate [LGI-LC]). Detailed menu analysis information is provided in Supplementary Tables 1–4.
Table 1.
GI, GL, energy, macronutrient, and fiber content of each diet at the 2,200-kcal energy level
Glucose and insulin concentrations
On day 4, after a 10-h fast, blood samples were drawn via indwelling catheter beginning just before breakfast and at timed intervals thereafter for 12 h. A baseline blood sample was obtained 15 min prior to breakfast consumption. Additional blood samples were collected at 15, 30, 45, 60, 90, 120, 150, and 210 min after eating commenced. Blood samples were collected at the same time points after lunch and dinner. Glucose and insulin levels were analyzed by the Pennington Clinical Research Laboratory.
Visual analog scale ratings
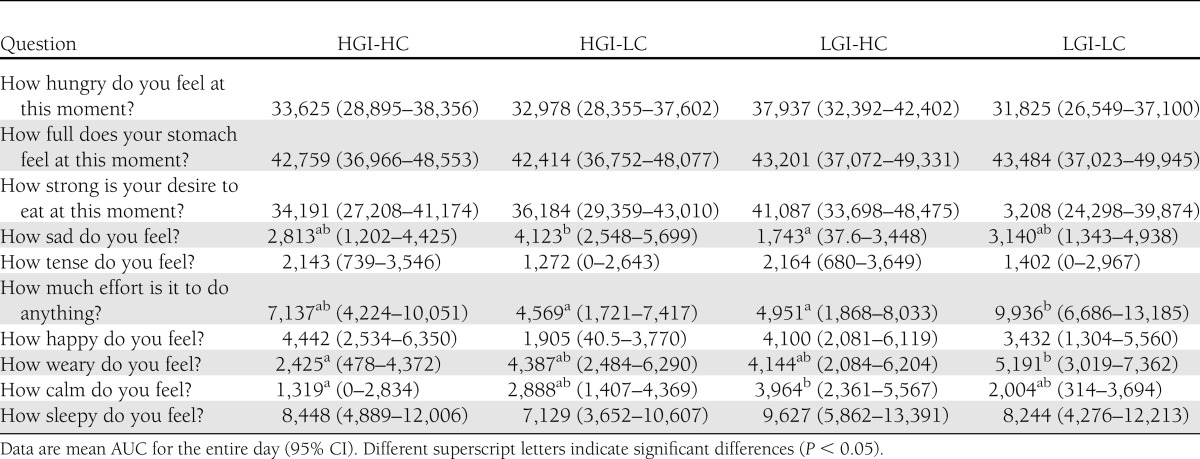
Subjective appetite sensations and mood were assessed using visual analog scales (VAS) as previously described (7). Participants were asked to rate their levels of hunger, satiety, energy, and mood using the questions listed in Table 2. Questions were presented one at a time, and subjects marked their rating on a 100-mm line anchored at 0 (“I am not hungry at all”) and 100 (“I have never been more hungry”). Questionnaires were presented electronically before meals and periodically throughout the day.
Table 2.
VAS ratings of satiety, energy, and emotions
Statistical analysis
The minimum clinically relevant difference between any two levels of treatment for incremental area under the curve (AUC) for serum glucose is taken to be 25% of the mean levels under standard diet conditions (8). A sample size of 25 subjects gives 80% power to detect a 25% difference between treatments with a significance level of α = 0.05. We enrolled 30 participants to allow for attrition.
A mixed linear statistical model ANOVA was used in the evaluation of treatment efficacy. This model included AUC as the dependent variable and fixed effects for the four treatments, the 4 days, and the four sequences together with random effects for subjects within sequence as independent (predictor) variables. All hypotheses were tested against two-directional alternatives. Statistical significance was defined as P ≤ 0.05, and pairwise comparisons of the four treatments were performed using a Tukey adjustment.
RESULTS
Participants
Thirty participants were enrolled in the study between February and June 2007 with a total of 26 completing. Two participants changed their minds, one participant discontinued because of a schedule conflict, and one participant was not able to meet the study demands. Of the 26 completing participants, 10 were male and 16 female. There were 12 African Americans, 13 Caucasians, and 1 other. The average age of participants was 43.5 ± 14.7 years, and the average BMI was 29.1 ± 2.8 kg/m2. Baseline characteristics of the study participants are shown in Supplementary Table 5.
Glucose and insulin
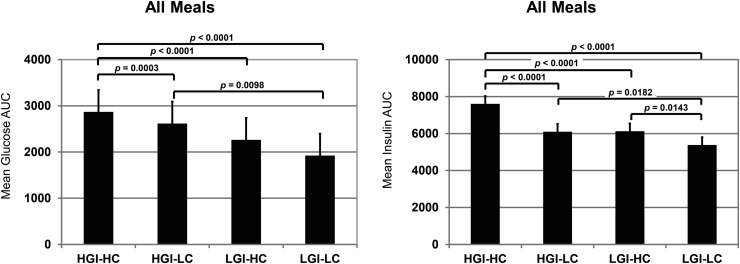
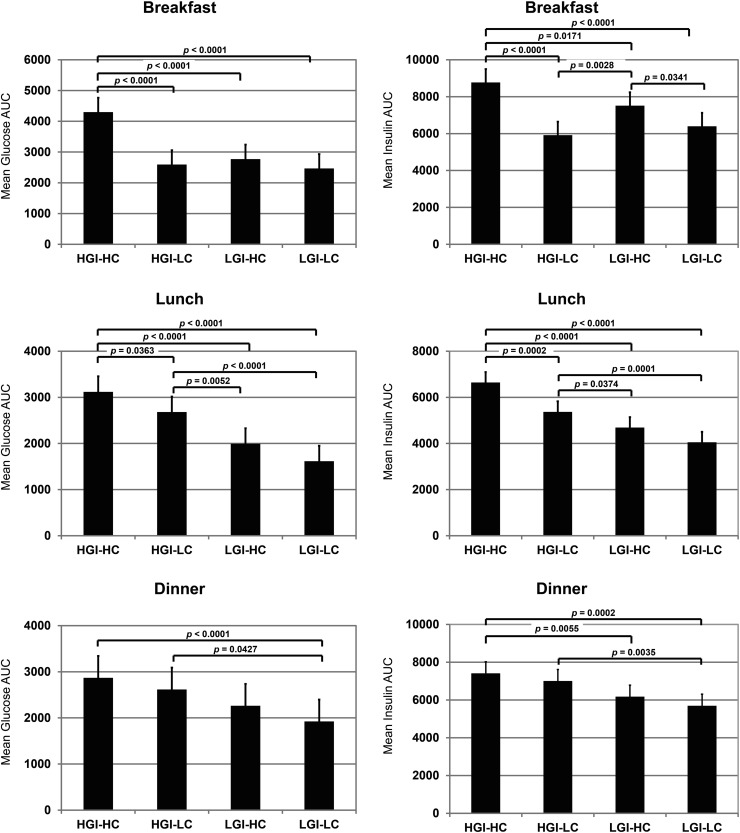
The daylong (12 h) glucose and insulin profiles are shown in Supplementary Fig. 1. Mean glucose and insulin AUC values for all meals combined were significantly higher for the HGI-HC compared with all other diets (Fig. 1). Compared with the HGI-HC treatment, serum glucose AUC was reduced 24, 33, and 42% in the HGI-LC, LGI-HC, and LGI-LC treatments, respectively (P < 0.001 for all comparisons). Serum insulin AUC was 20, 20, and 29% lower in the HGI-LC, LGI-HC, and LGI-LC treatments as compared with the HGI-HC diet (P < 0.0001 for all comparisons). Using criteria of at least a 25% change from mean levels, the LGI-LC diet produced the largest clinically relevant reductions in serum glucose and insulin. Not surprisingly, consumption of the HGI-LC (GL = 77) and LGI-HC (GL = 69) diets resulted in glucose and insulin AUCs that were intermediate to the HGI-HC (GL = 108) and LGI-LC (GL = 50) diets. This trend could be seen after all three meals individually (Fig. 2).
Figure 1.
Glucose and insulin AUC values for all meals combined (mean ± 95% CI; n = 26).
Figure 2.
Glucose and insulin AUC values for breakfast, lunch, and dinner (mean ± 95% CI; n = 26).
Glucose and insulin responses were highest after breakfast. The HGI-HC breakfast meal yielded the highest levels of circulating glucose, and levels for all other diets were equally reduced compared with HGI-HC diet. Blood insulin levels were higher in response to both high-carbohydrate diets regardless of GI. At lunch, the effect of GI on glucose and insulin levels became more pronounced, and a distinct dose-response relationship between glucose or insulin AUC and GL was apparent. These effects continued at dinner but were somewhat mitigated.
Hunger, satiety, energy, and mood
We measured subjective hunger, fullness, and satiety using VAS throughout the course of the day. There were no differences between dietary treatments in these measures (Table 2). As an exploratory measure, we also asked subjects to answer several questions related to energy levels and emotions. Participants rated their levels of weariness higher when they consumed the LGI-LC diet compared with the HGI-HC diet (P < 0.05). Participants also felt that doing anything took more effort when they were consuming the LGI-LC diet compared with the LGI-HC and HGI-LC diets (P < 0.05). Calmness ratings were highest in the LGI-HC treatment, whereas sadness ratings were highest in the HGI-LC treatment. With most of the ratings, there was no clear relationship with GI or GL.
CONCLUSIONS
This study is unique in that we fed well-defined meals to overweight or obese subjects throughout an entire day and compared a low GI diet to a high GI diet with percent energy from carbohydrate at two levels (40 and 56%). Thus, the GL varied for all diets. We were also able to control for any effects of previous diet by having participants consume standard diets for the 3 days prior to testing. Overall consumption of the low GI diets resulted in glucose and insulin AUCs that were lower than that AUCs induced by high GI diets regardless to whether it was high or low in percent energy from carbohydrates.
Our results are in agreement with previous literature including a recent study by Bao et al. (9), which demonstrated that GL is a good predictor of postprandial serum glucose and insulin response in healthy, lean adults. In that study, groups of subjects consumed 121 single food items and 13 mixed meals, and glucose and insulin response was quantified as AUC. Among single foods, GL explained 85 and 59% of the observed variation in glucose and insulin response, respectively (P < 0.001). Among mixed meals, GL explained 58% (P = 0.003) and 46% (P = 0.01) of the variation in glucose and insulin response, respectively. Our study suggests that the GL remains a good predictor of postprandial serum and glucose levels in an overweight and obese population.
Interestingly, despite significant reductions in postprandial glycemia and insulinemia with decreasing GL, there was no effect on measures of hunger or satiety. Though this does not support the hypothesis that blood glucose levels mediate appetite, our findings are in agreement with the handful of studies that have examined the effect of low or high GI mixed meals on hunger and satiety ratings (10–13). All studies except one report no effect of low versus high GI meals on hunger and satiety ratings. Lemmens et al. (14) previously demonstrated that blood glucose and insulin tracked with VAS scores, but the amount of variation explained by these blood markers was too small to serve as a useful biomarker. Indeed, a meta-analysis by Flint et al. (15) found no correlation between blood glucose concentrations and feelings of hunger or satiety. Our study was limited in that we were only able to assess subjective measures of hunger and satiety. Quantifying caloric intake in an ad libitum setting would have allowed for objective measurement of food intake. However, other studies have reported no differences in calories consumed at ad libitum meals when subjects are prefed a low or high GI test meal (10,12,13,16).
Although we did see some statistically significant changes in parameters related to mood and energy, the physiological significance is questionable due to the lack of a clear relationship with GI or GL. Based on our data, it does not appear that blood glucose levels are a significant modulator of mood or energy levels.
This study demonstrates that lowering the GL of mixed meals is an effective method of controlling blood glucose and insulin levels throughout the day.
Supplementary Material
Acknowledgments
This study was supported by General Mills. The funding agency did not participate in the analysis or interpretation of the data. No other potential conflicts of interest relevant to this article were reported.
A.G.L., M.M.B., and W.D.J. analyzed the data. A.G.L. wrote the article. M.M.M., W.T.C., and F.L.G. designed the study. M.M.M. conducted the research. A.G.L., M.M.M., M.M.B., W.D.J., W.T.C., and F.L.G. read and approved the final manuscript. F.L.G. is the guarantor of this work and, as such, had full access to all the data in the study and takes responsibility for the integrity of the data and the accuracy of the data analysis.
This study was previously submitted in abstract form and presented as a poster at Experimental Biology 2012, San Diego, California, 21–25 April 2012.
The authors thank Mary Beth Burnett, Administrative Assistant of the Outpatient Clinic Department, Pennington Biomedical Research Center, for help in the submission process of the manuscript.
Footnotes
Clinical trial reg. no. NCT01516333, clinicaltrials.gov.
This article contains Supplementary Data online at http://care.diabetesjournals.org/lookup/suppl/doi:10.2337/dc12-0329/-/DC1.
References
- 1.Brand-Miller JC. Glycemic load and chronic disease. Nutr Rev 2003;61:S49–S55 [DOI] [PubMed] [Google Scholar]
- 2.Thomas DE, Elliott EJ. The use of low-glycaemic index diets in diabetes control. Br J Nutr 2010;104:797–802 [DOI] [PubMed] [Google Scholar]
- 3.Chiu CJ, Liu S, Willett WC, et al. Informing food choices and health outcomes by use of the dietary glycemic index. Nutr Rev 2011;69:231–242 [DOI] [PMC free article] [PubMed] [Google Scholar]
- 4.Esfahani A, Wong JM, Mirrahimi A, Villa CR, Kendall CW. The application of the glycemic index and glycemic load in weight loss: A review of the clinical evidence. IUBMB Life 2011;63:7–13 [DOI] [PubMed] [Google Scholar]
- 5.Roberts SB. High-glycemic index foods, hunger, and obesity: is there a connection? Nutr Rev 2000;58:163–169 [DOI] [PubMed] [Google Scholar]
- 6.Brunzell JD, Lerner RL, Hazzard WR, Porte D, Jr, Bierman EL. Improved glucose tolerance with high carbohydrate feeding in mild diabetes. N Engl J Med 1971;284:521–524 [DOI] [PubMed] [Google Scholar]
- 7.Flint A, Raben A, Blundell JE, Astrup A. Reproducibility, power and validity of visual analogue scales in assessment of appetite sensations in single test meal studies. Int J Obes Relat Metab Disord 2000;24:38–48 [DOI] [PubMed] [Google Scholar]
- 8.Wolever TM, Yang M, Zeng XY, Atkinson F, Brand-Miller JC. Food glycemic index, as given in glycemic index tables, is a significant determinant of glycemic responses elicited by composite breakfast meals. Am J Clin Nutr 2006;83:1306–1312 [DOI] [PubMed] [Google Scholar]
- 9.Bao J, Atkinson F, Petocz P, Willett WC, Brand-Miller JC. Prediction of postprandial glycemia and insulinemia in lean, young, healthy adults: glycemic load compared with carbohydrate content alone. Am J Clin Nutr 2011;93:984–996 [DOI] [PubMed] [Google Scholar]
- 10.Makris AP, Borradaile KE, Oliver TL, et al. The individual and combined effects of glycemic index and protein on glycemic response, hunger, and energy intake. Obesity (Silver Spring) 2011;19:2365–2373 [DOI] [PubMed] [Google Scholar]
- 11.Reynolds RC, Stockmann KS, Atkinson FS, Denyer GS, Brand-Miller JC. Effect of the glycemic index of carbohydrates on day-long (10 h) profiles of plasma glucose, insulin, cholecystokinin and ghrelin. Eur J Clin Nutr 2009;63:872–878 [DOI] [PubMed] [Google Scholar]
- 12.Aston LM, Stokes CS, Jebb SA. No effect of a diet with a reduced glycaemic index on satiety, energy intake and body weight in overweight and obese women. Int J Obes (Lond) 2008;32:160–165 [DOI] [PMC free article] [PubMed] [Google Scholar]
- 13.Alfenas RC, Mattes RD. Influence of glycemic index/load on glycemic response, appetite, and food intake in healthy humans. Diabetes Care 2005;28:2123–2129 [DOI] [PubMed] [Google Scholar]
- 14.Lemmens SG, Martens EA, Kester AD, Westerterp-Plantenga MS. Changes in gut hormone and glucose concentrations in relation to hunger and fullness. Am J Clin Nutr 2011;94:717–725 [DOI] [PubMed] [Google Scholar]
- 15.Flint A, Gregersen NT, Gluud LL, et al. Associations between postprandial insulin and blood glucose responses, appetite sensations and energy intake in normal weight and overweight individuals: a meta-analysis of test meal studies. Br J Nutr 2007;98:17–25 [DOI] [PubMed] [Google Scholar]
- 16.Krog-Mikkelsen I, Sloth B, Dimitrov D, et al. A low glycemic index diet does not affect postprandial energy metabolism but decreases postprandial insulinemia and increases fullness ratings in healthy women. J Nutr 2011;141:1679–1684 [DOI] [PubMed] [Google Scholar]
Associated Data
This section collects any data citations, data availability statements, or supplementary materials included in this article.


