

Abstract
The objective of this study was to investigate the relationship between plasma and brain glucose levels during euglycemia and hypoglycemia in healthy subjects and patients with type 1 diabetes mellitus (T1DM). Hyperinsulinemic euglycemic (5 mmol/L) and hypoglycemic (3 mmol/L) [1-13C]glucose clamps were performed in eight healthy subjects and nine patients with uncomplicated T1DM (HbA1c 7.7 ± 1.4%). Brain glucose levels were measured by 13C magnetic resonance spectroscopy. Linear regression analysis was used to fit the relationship between plasma and brain glucose levels and calculate reversible Michaelis-Menten (MM) kinetic parameters. Brain glucose values during euglycemia (1.1 ± 0.4 μmol/g vs. 1.1 ± 0.3 μmol/g; P = 0.95) and hypoglycemia (0.5 ± 0.2 μmol/g vs. 0.6 ± 0.3 μmol/g; P = 0.52) were comparable between healthy subjects and T1DM patients. MM kinetic parameters of combined data were calculated to be maximum transport rate/cerebral metabolic rate of glucose (Tmax/CMRglc) = 2.25 ± 0.32 and substrate concentration at half maximal transport (Kt) = 1.53 ± 0.88 mmol/L, which is in line with previously published data obtained under hyperglycemic conditions. In conclusion, the linear MM relationship between plasma and brain glucose can be extended to low plasma glucose levels. We found no evidence that the plasma to brain glucose relationship or the kinetics describing glucose transport over the blood–brain barrier differ between healthy subjects and patients with uncomplicated, reasonably well-controlled T1DM.
Hypoglycemia frequently complicates (intensive) insulin treatment in patients with type 1 diabetes mellitus (T1DM). On average, T1DM patients experience two to three hypoglycemic events every week and one hypoglycemic event complicated by loss of consciousness or seizures, reflecting severe brain dysfunction, every 1 to 2 years (1). Knowledge about glucose transport over the blood–brain barrier during hypoglycemia is important because the brain is dependent on continuous supply of glucose as its principal source of energy.
Glucose transport over the blood–brain barrier takes place through facilitated diffusion mediated by the glucose transporter GLUT1 (2). Cerebral glucose content depends on the plasma glucose concentration, transport of glucose in and out of the brain, and the cerebral metabolic rate of glucose (CMRglc). Several studies using magnetic resonance spectroscopy (MRS) have shown that over a range of plasma glucose from 4.6 to 30 mmol/L, brain glucose content is linearly related to the plasma glucose level (3–5). However, whether the relationship between brain glucose content and plasma glucose concentration is altered during hypoglycemia, either in subjects without diabetes or in patients with T1DM, has not been investigated. Such alterations could have important implications for our understanding of brain glucose handling under conditions of deprivation in humans in general and in patients with diabetes who are at continuous risk of hypoglycemia.
Glucose transport under nonhypoglycemic conditions has been modeled by reversible Michaelis-Menten (MM) kinetics (3), which predict a linear relationship between plasma and brain glucose. Whether such linearity persists into the hypoglycemic range, as has been shown in rats (5), is currently unknown. In fact, the uncertainty of published values for reversible MM kinetics is so large that this leads to predictions for brain glucose value to approach 0 μmol/g when plasma glucose levels lie anywhere between 0 and 5 mmol/L (3–6).
Applying 13C MRS to measure brain glucose content during hypoglycemia is challenging. Infusion of isotopically enriched glucose to improve the sensitivity of the MRS measurements conflicts with obtaining hypoglycemia. We recently developed a protocol to measure brain glucose metabolism under euglycemic and hypoglycemic conditions by 13C MRS in humans in vivo (7). In this study, we applied this protocol to quantitatively assess brain glucose content and calculate kinetic parameters for brain glucose transport under these conditions. We performed this study in healthy human volunteers as well as in patients with uncomplicated T1DM.
RESEARCH DESIGN AND METHODS
Subjects.
We enrolled eight healthy nondiabetic volunteers and nine patients with T1DM. Data from healthy volunteers have partly been reported before (8) but were reanalyzed for this study. Patients with T1DM were excluded if they had a history of repeated severe hypoglycemia, a severe hypoglycemic incident in the past 6 months, or evidence of hypoglycemia unawareness on the Clarke’s questionnaire (9,10). Patients with signs of autonomic neuropathy, peripheral neuropathy, proliferative retinopathy, or micro- or macroalbuminuria by review of medical records or physical examination were also excluded from participating. The study protocol was approved by the institutional review board of the Radboud University Nijmegen Medical Centre, and all volunteers gave written informed consent. For subjects participating in both euglycemic and hypoglycemic study protocols, experiments were scheduled in random order and at least 2 weeks apart. In females, a 4- or 8-week interval was chosen to avoid influences from the menstrual cycle. All nondiabetic volunteers and three T1DM patients had data available from both experiments. For six patients, data were only available from either the hypoglycemic clamp (n = 2) or the euglycemic clamp (n = 4).
Hyperinsulinemic glucose clamps.
Hyperinsulinemic (60 mU/min/m2), euglycemic (5.0 mmol/L), or hypoglycemic (3.0 mmol/L) glucose clamps were conducted, as described previously (7,8). Briefly, the brachial artery was cannulated for blood sampling, and a contralateral antecubital vein was cannulated for administration of insulin and glucose 20% to maintain plasma glucose at the predetermined level for at least 50 min. Exogenous glucose was given in the form of [1-13C]glucose 20% weight for weight at variable enrichments as described earlier (8) to increase plasma 13C enrichment to stable levels during both euglycemic and hypoglycemic experiments. Arterial blood was sampled every 5 min for immediate determination of plasma glucose levels and for later determination of 13C isotopic enrichment of glucose by nuclear magnetic resonance (1H-NMR) (11,12).
Magnetic resonance spectroscopy.
All data were acquired on a 3T MR system (Magnetom Trio, Siemens, Erlangen, Germany) (7,8). A 13C coil was placed in a birdcage 1H coil (13), and an ISIS-DEPT sequence was used for localization and polarization transfer to increase the signal-to-noise ratio of 13C signals (14). A voxel of ∼125 mL was placed in occipital brain tissue. Data were acquired dynamically with a time resolution of 2.5 min, starting at least 10 min after the glycemic target was reached.
13C MRS data processing and quantification.
13C MR spectra acquired during the final 50 min of the clamps, during which plasma glucose values were stable, were averaged. In the resulting spectra, peaks of glucose and myo-inositol (mI) were fitted with the advanced magnetic resonance algorithm (15) in jMRUI (16). The natural abundance signal of mI was used to quantify the 13C-labeled glucose concentration, based on the premise that mI has a stable concentration of 6 μmol/g (17,18). We assumed that mI was not labeled by exogenous [1-13C]glucose in the time frame of the experiment (18). 13C MR spectra measured from a phantom were used to eliminate effects of the pulse sequence profile on the experimental spectra. Absolute quantification of the total glucose concentration in the brain was achieved by correcting the 13C glucose concentration with the 13C enrichment of plasma glucose as measured by 1H-NMR. Data were also corrected for the presence of blood vessels in the voxel, assuming that the voxel contained 5% vessel volume.
MM kinetics.
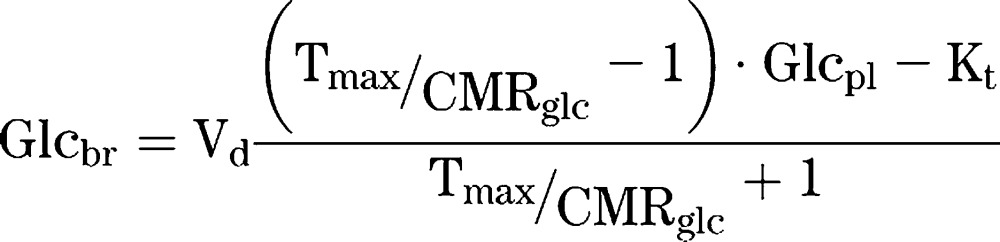
MM kinetic parameters were derived from the data using reversible MM kinetics, as described by Gruetter et al. (3), assuming a linear relationship between plasma glucose (Glcpl) and brain glucose (Glcbr). In this model, Kt denotes the MM constant for substrate concentration at half maximal transport, Tmax the maximum transport rate, CMRglc the consumption rate of glucose, and Vd the physical distribution of glucose (0.77 mL/g) (3,19).
 |
The data in this study were fitted by linear regression analysis. From this linear relationship, Tmax/CMRglc and Kt were calculated. The kinetic parameters were determined using a bootstrapping method implemented in Matlab (Mathworks, Natick, MA). From the original dataset, the same amount of data points is selected randomly, and this is repeated 10,000 times.
Statistical analysis.
All data are expressed as means ± SD, unless mentioned otherwise. Differences in means were tested by two-tailed Student t tests; a P value <0.05 was considered statistically significant. Statistical analyses were performed with GraphPad Prism 4 (GraphPad, La Jolla, CA) and SPSS 16.0 (SPSS Inc., Chicago, IL).
RESULTS
Baseline characteristics are shown in Table 1. Plasma glucose values during the euglycemic clamps averaged 5.1 ± 0.3 mmol/L (coefficient of variation [CV] 4.1 ± 1.7%) and 5.0 ± 0.2 mmol/L (3.8 ± 1.8%) (P = 0.79) in healthy subjects and patients, respectively; corresponding values during the hypoglycemic clamps were 3.0 ± 0.3 mmol/L (5.7 ± 2.2%) and 2.9 ± 0.2 mmol/L (6.9 ± 3.7%) (P = 0.67). Plasma glucose 13C enrichments were also stable over the last 50 min of the experiment. In healthy subjects, 13C glucose enrichments were 35.4 ± 1.4% (CV 3.1 ± 1.7%) during euglycemia and 29.9 ± 5.2% (6.0 ± 2.0%) during hypoglycemia. In T1DM patients, the values were, respectively, 32.2 ± 2.3% (5.2 ± 2.2%) and 30.2 ± 5.3% (8.9 ± 2.2%). In response to hypoglycemia, glucagon levels significantly increased in healthy subjects, but not in patients with T1DM. Levels of all other counterregulatory hormones (adrenaline, growth hormone end cortisol) increased significantly and to a similar extent during hypoglycemia in both groups (data not shown).
TABLE 1.
Subject characteristics

In all 13C brain MR spectra of both healthy volunteers and T1DM patients, there was a clear difference in the intensity of the glucose signal relative to the natural abundance mI signals between the euglycemic and hypoglycemic state (Fig. 1). Individual steady-state brain glucose levels as a function of plasma glucose under hypo- and euglycemic clamp conditions are presented in Fig. 2. Brain glucose values averaged 1.1 ± 0.4 and 1.1 ± 0.3 μmol/g (P = 0.95) during the euglycemic clamps in healthy subjects and T1DM patients, respectively; corresponding values during the hypoglycemic clamps were 0.5 ± 0.2 and 0.6 ± 0.3 μmol/g, respectively (P = 0.52).
FIG. 1.

Representative spectra of two volunteers under euglycemia and hypoglycemia. A: Healthy subject. B: Patient with T1DM.
FIG. 2.

Data of healthy subjects (open squares) and patients with T1DM (closed circles) together with the best fit of the data and 95% CIs. R2 = 0.59; P < 0.001.
The plasma versus brain glucose relation was fitted with linear regression analysis to determine the reversible MM kinetic parameters. The linear fit of the total data set in Fig. 2 shows that, with 95% CI (R2 = 0.59; P < 0.0001), cerebral glucose levels become undetectable within a plasma glucose range of ∼0–2 mmol/L. The MM parameters were calculated for the whole group of healthy subjects and diabetic patients to be: Tmax/CMRglc = 2.25 ± 0.32 and Kt = 1.53 ± 0.88 mmol/L (Table 2). There was no indication that MM parameters differed between the two groups: Tmax/CMRglc = 2.43 and Kt = 2.20 mmol/L for healthy subjects and Tmax/CMRglc = 2.08 and Kt = 0.93 mmol/L for T1DM patients.
TABLE 2.
Comparison of MM kinetic parameters between previously published MRS data (1H and 13C studies) and the current study

DISCUSSION
In this study, brain glucose levels were measured by 13C MRS under hypoglycemic conditions in T1DM patients and nondiabetic control subjects. Previous studies conducted under hyperglycemic conditions reported a linear relationship between brain and plasma glucose values. Our findings measured under hypoglycemic conditions are consistent with such a relationship and provide evidence for linearity up to ∼3 mmol/L. There was neither a difference in cerebral glucose content or in the MM kinetic parameters for cerebral glucose transport between T1DM patients and control subjects.
Previously calculated values for reversible MM kinetic parameters in humans were based on data obtained under euglycemic and hyperglycemic conditions and had rather large SD (Table 2). This lack of data made it impossible to draw firm conclusions with regard to brain glucose transport under hypoglycemic conditions. Knowledge about cerebral glucose transport during hypoglycemia is important because of the brain’s dependency on glucose supply. The values we present for the MM kinetic parameters were assessed under hypoglycemic conditions and well within the SD of previously published data in humans (3,4,6) and in rats (5). Our data thus substantiate that the linear relationship between plasma and brain glucose extends well into the hypoglycemic range. Assuming continuation of this linear relationship between plasma and brain glucose, our data predict that brain glucose approaches zero at a plasma glucose level of ∼1.2 mmol/L (Fig. 2).
The current study demonstrated similar cerebral glucose levels for T1DM patients and healthy subjects under euglycemic or hypoglycemic conditions. This is in accordance with previous findings using MRS obtained under clamped hyperglycemic conditions (20) and using positron emission tomography under hypoglycemic conditions (21). Two studies reporting higher brain glucose levels in patients with T1DM than in healthy control subjects (22,23). However, it should be acknowledged that plasma glucose levels were uncontrolled and therefore also much higher in the patients than in control subjects. Another study reported increased brain glucose levels measured by 1H MRS during a hyperglycemic clamp in T1DM patients with hypoglycemia unawareness, which the authors interpreted as a compensatory response to recurrent hypoglycemia (24). Because we examined patients with normal hypoglycemic awareness, we can neither confirm nor refute this suggestion. However, another study using positron emission tomography reported no differences in cerebral glucose content during either euglycemia or hypoglycemia between T1DM patients with and without hypoglycemia awareness (25).
To quantify the brain glucose concentrations, we made some assumptions. First, because the 13C MR spectra were acquired in a rather large voxel in the occipital cortex, we assumed that 5% of the voxel contained blood vessels and corrected for this. Secondly, the quantification was based on the concentration of mI as internal reference, which we assumed to be stable. There is some evidence that mI levels are up to 20% increased in frontal parts of the brain in T1DM patients as a consequence of hyperglycemia (22). Although the occipital cortex is probably less affected (23), and the effect of acutely normalizing plasma glucose values (such as during a glucose clamp) on cerebral mI levels is unknown, recalculating MM kinetics assuming 20% higher mI levels resulted in Tmax/CMRglc = 2.44 ± 0.44 and Kt = 1.70 ± 1.18 mmol/L. Thus, the MM kinetic parameters changed slightly when higher mI values were assumed, but they stayed within the range of data published before (3,6). Furthermore, it should be appreciated that we cannot vouch for a linear relationship between plasma and brain glucose below plasma glucose levels of ∼3 mmol/L. The detection limit of brain glucose levels made it unfeasible to study the effects of very low plasma glucose levels with brain MRS.
In conclusion, our data show that the linear MM relationship between plasma and brain glucose reported previously extends well into the hypoglycemic range in patients with T1DM and nondiabetic control subjects. Our data also show that brain glucose content and kinetics of brain glucose transport do not differ between healthy subjects and patients with uncomplicated T1DM under hypoglycemic conditions. Future MRS studies need to address these issues in T1DM patients with hypoglycemia unawareness.
ACKNOWLEDGMENTS
This work was financially supported by the Dutch Diabetes Research Foundation (Grant 2004.00.012), National Institutes of Health (Grant DK-069881), the framework of the Center for Translational Molecular Medicine (http://www.ctmm.nl; project Prevention and Early Detection of Cardiovascular Complications in Type 2 Diabetes Mellitus Grant 01C-104), and the Netherlands Heart Foundation and Dutch Kidney Foundation.
No potential conflicts of interest relevant to this article were reported.
K.C.C.v.d.V., M.v.d.G., and B.E.d.G. collected the data and performed data analysis. M.v.d.G., C.J.T., A.H., and B.E.d.G. designed the study. M.v.d.G. and B.E.d.G. wrote the study protocol. All authors contributed to interpreting the data, editing of the manuscript, and approval of the final version of the paper. K.C.C.v.d.V. and B.E.d.G. are the guarantors of this work and, as such, had full access to all the data in the study and take responsibility for the integrity of the data and the accuracy of the data analysis.
The authors thank Karin Saini (Department of Internal Medicine, Radboud University Nijmegen Medical Centre, Nijmegen, the Netherlands) and Cindy Frentz (Department of Radiology, Radboud University Nijmegen Medical Centre, Nijmegen, the Netherlands) for assistance during the glucose clamps, and Angelina Goudswaard (Department of Laboratory Medicine, Laboratory of Genetic Endocrine and Metabolic Diseases, Nijmegen, the Netherlands), Frederique Vermeulen (Department of Radiology, Radboud University Nijmegen Medical Centre, Nijmegen, the Netherlands), and Udo Engelke (Department of Laboratory Medicine, Laboratory of Genetic Endocrine and Metabolic Diseases, Nijmegen, the Netherlands) for help with the high-resolution NMR.
Footnotes
See accompanying commentary, p. 1918.
REFERENCES
- 1.Cryer PE. The barrier of hypoglycemia in diabetes. Diabetes 2008;57:3169–3176 [DOI] [PMC free article] [PubMed] [Google Scholar]
- 2.Pardridge WM, Boado RJ, Farrell CR. Brain-type glucose transporter (GLUT-1) is selectively localized to the blood-brain barrier. Studies with quantitative western blotting and in situ hybridization. J Biol Chem 1990;265:18035–18040 [PubMed] [Google Scholar]
- 3.Gruetter R, Ugurbil K, Seaquist ER. Steady-state cerebral glucose concentrations and transport in the human brain. J Neurochem 1998;70:397–408 [DOI] [PubMed] [Google Scholar]
- 4.de Graaf RA, Pan JW, Telang F, et al. Differentiation of glucose transport in human brain gray and white matter. J Cereb Blood Flow Metab 2001;21:483–492 [DOI] [PubMed] [Google Scholar]
- 5.Choi IY, Lee SP, Kim SG, Gruetter R. In vivo measurements of brain glucose transport using the reversible Michaelis-Menten model and simultaneous measurements of cerebral blood flow changes during hypoglycemia. J Cereb Blood Flow Metab 2001;21:653–663 [DOI] [PubMed] [Google Scholar]
- 6.Seaquist ER, Damberg GS, Tkac I, Gruetter R. The effect of insulin on in vivo cerebral glucose concentrations and rates of glucose transport/metabolism in humans. Diabetes 2001;50:2203–2209 [DOI] [PubMed] [Google Scholar]
- 7.van de Ven KC, van der Graaf M, Tack CJ, Klomp DW, Heerschap A, de Galan BE. Optimized [1-(13)C]glucose infusion protocol for 13C magnetic resonance spectroscopy at 3T of human brain glucose metabolism under euglycemic and hypoglycemic conditions. J Neurosci Methods 2010;186:68–71 [DOI] [PMC free article] [PubMed] [Google Scholar]
- 8.van de Ven KC, de Galan BE, van der Graaf M, et al. Effect of acute hypoglycemia on human cerebral glucose metabolism measured by ¹³C magnetic resonance spectroscopy. Diabetes 2011;60:1467–1473 [DOI] [PMC free article] [PubMed] [Google Scholar]
- 9.Clarke WL, Cox DJ, Gonder-Frederick LA, Julian D, Schlundt D, Polonsky W. Reduced awareness of hypoglycemia in adults with IDDM. A prospective study of hypoglycemic frequency and associated symptoms. Diabetes Care 1995;18:517–522 [DOI] [PubMed] [Google Scholar]
- 10.De Galan BE, De Mol P, Wennekes L, Schouwenberg BJ, Smits P. Preserved sensitivity to beta2-adrenergic receptor agonists in patients with type 1 diabetes mellitus and hypoglycemia unawareness. J Clin Endocrinol Metab 2006;91:2878–2881 [DOI] [PubMed] [Google Scholar]
- 11.Van Den Bergh AJ, Tack CJ, Van Den Boogert HJ, Vervoort G, Smits P, Heerschap A. Assessment of human muscle glycogen synthesis and total glucose content by in vivo 13C MRS. Eur J Clin Invest 2000;30:122–128 [DOI] [PubMed] [Google Scholar]
- 12.Serlie MJ, de Haan JH, Tack CJ, et al. Glycogen synthesis in human gastrocnemius muscle is not representative of whole-body muscle glycogen synthesis. Diabetes 2005;54:1277–1282 [DOI] [PubMed] [Google Scholar]
- 13.Klomp DW, Renema WK, van der Graaf M, de Galan BE, Kentgens AP, Heerschap A. Sensitivity-enhanced 13C MR spectroscopy of the human brain at 3 Tesla. Magn Reson Med 2006;55:271–278 [DOI] [PubMed] [Google Scholar]
- 14.Klomp DW, Kentgens AP, Heerschap A. Polarization transfer for sensitivity-enhanced MRS using a single radio frequency transmit channel. NMR Biomed 2008;21:444–452 [DOI] [PubMed] [Google Scholar]
- 15.Vanhamme L, van den Boogaart A, Van Huffel S. Improved method for accurate and efficient quantification of MRS data with use of prior knowledge. J Magn Reson 1997;129:35–43 [DOI] [PubMed] [Google Scholar]
- 16.Naressi A, Couturier C, Devos JM, et al. Java-based graphical user interface for the MRUI quantitation package. MAGMA 2001;12:141–152 [DOI] [PubMed] [Google Scholar]
- 17.Ross B, Lin A, Harris K, Bhattacharya P, Schweinsburg B. Clinical experience with 13C MRS in vivo. NMR Biomed 2003;16:358–369 [DOI] [PubMed] [Google Scholar]
- 18.Reyngoudt H, Claeys T, Vlerick L, et al. Age-related differences in metabolites in the posterior cingulate cortex and hippocampus of normal ageing brain: A (1)H-MRS study. Eur J Radiol 2012;81:e223–e231 [DOI] [PubMed] [Google Scholar]
- 19.Gjedde A, Diemer NH. Autoradiographic determination of regional brain glucose content. J Cereb Blood Flow Metab 1983;3:303–310 [DOI] [PubMed] [Google Scholar]
- 20.Seaquist ER, Tkac I, Damberg G, Thomas W, Gruetter R. Brain glucose concentrations in poorly controlled diabetes mellitus as measured by high-field magnetic resonance spectroscopy. Metabolism 2005;54:1008–1013 [DOI] [PubMed] [Google Scholar]
- 21.Fanelli CG, Dence CS, Markham J, et al. Blood-to-brain glucose transport and cerebral glucose metabolism are not reduced in poorly controlled type 1 diabetes. Diabetes 1998;47:1444–1450 [DOI] [PubMed] [Google Scholar]
- 22.Heikkilä O, Lundbom N, Timonen M, Groop PH, Heikkinen S, Mäkimattila S. Hyperglycaemia is associated with changes in the regional concentrations of glucose and myo-inositol within the brain. Diabetologia 2009;52:534–540 [DOI] [PubMed] [Google Scholar]
- 23.Kreis R, Ross BD. Cerebral metabolic disturbances in patients with subacute and chronic diabetes mellitus: detection with proton MR spectroscopy. Radiology 1992;184:123–130 [DOI] [PubMed] [Google Scholar]
- 24.Criego AB, Tkac I, Kumar A, Thomas W, Gruetter R, Seaquist ER. Brain glucose concentrations in patients with type 1 diabetes and hypoglycemia unawareness. J Neurosci Res 2005;79:42–47 [DOI] [PubMed] [Google Scholar]
- 25.Bingham EM, Dunn JT, Smith D, et al. Differential changes in brain glucose metabolism during hypoglycaemia accompany loss of hypoglycaemia awareness in men with type 1 diabetes mellitus. An [11C]-3-O-methyl-D-glucose PET study. Diabetologia 2005;48:2080–2089 [DOI] [PubMed] [Google Scholar]