

Abstract
Objective
The morphology of lesions in mouse models of osteoarthritis (OA) has not been comprehensively characterized, in part because current histological assessments of OA focus primarily on articular cartilage. In the present study, sections of murine stifle joints with naturally occurring (aged animals) and surgically induced (destabilized medial meniscus, DMM) OA were examined using a newly developed histological grading scheme that includes quantitative measurements and semiquantitative grades to evaluate multiple joint tissues.
Design
The data collected was analyzed using Principal Components Analysis (PCA); factor scores for each joint were generated. Individual parameters and factor scores were compared between surgical groups and among age groups. For comparison, the original Mankin Histological-Histochemical Grading System (HHGS) also was applied.
Results
Overall, lesions were most severe in the medial tibial plateaus. Significant changes in articular cartilage and neighboring bone were identified in surgically induced models and in naturally occurring disease. Mean factor scores provided a comprehensive evaluation of joint changes. An important new finding was that chondrocyte cell death within the articular cartilage was a commonly identified lesion and its extent significantly increased with age. While the Mankin HHGS detected significant overall differences in OA severity between surgical groups, it was not sensitive in detecting age related differences, nor did it provide information regarding changes in individual tissues.
Conclusion
These results demonstrate the utility of this newly developed murine OA grading scheme in identifying lesions in articular cartilage and in other joint tissues. Surgically induced changes were similar to those occurring naturally with aging.
Keywords: osteoarthritis, histology, murine, morphometry
Introduction
Accurate histological assessment of osteoarthritis (OA) severity in animal models is critical in studies that evaluate effectiveness of agents designed to prevent or reduce disease severity. The most commonly used OA histological grading scheme, the Mankin Histological-Histochemical Grading System (HHGS)1, was initially developed in humans but is applied, either in its original form or with modifications, to evaluate OA severity in animals, including mice.2–7 There are, however, limitations that prevent the Mankin HHGS, and other currently-used histological grading schemes, from accurately assessing OA severity in rodent models. Firstly, the Structure parameter in the Mankin HHGS relies on the ability to differentiate among the three zones of articular cartilage; however these are very difficult to consistently identify in rodents, particularly mice, in which the articular cartilage is less than 75μm thick. These schemes also focus exclusively on changes within the articular cartilage and do not consider changes in other joint structures, such as bone and meniscus. Finally, schemes such as the OARSI Osteoarthritis Cartilage Histopathology Assessment System (OOCHAS)8 combine changes occurring in multiple different tissues into a single parameter, assuming that these changes are synchronous.
Due, in large part, to the aforementioned issues, very few studies have reproducibly and comprehensively characterized stifle (knee) joint changes associated with OA in mice in either naturally occurring or surgically induced models, despite the popularity of transgenic and surgical models. Histological characteristics of the stifle joint in several transgenic mouse models have been published9–13; however, these assessments commonly utilize the semiquantitative histological evaluations described above. The goals of the present study were to apply a newly developed histological grading scheme14 to naturally occurring and surgically induced OA in mice to determine the ability of the newly developed scheme to identify changes in multiple joint tissues that are commonly associated with OA and to directly compare the ability of this scheme to identify OA lesion severity with that of the previously established Mankin scheme1.
Materials & Methods
Animal models of osteoarthritis
The tissues evaluated in this study were from male C57Bl/6 mice in which OA either was surgically induced (destabilized medial meniscus, DMM) or occurred naturally (aged mice).
Surgically Induced OA (DMM)
Eleven mice, aged 2.5 months at the start of the experiment, underwent DMM (n=8) or Sham (n=3) surgery. One stifle served as either a sham (Sham) or surgery (DMM) site and the other was left as an unoperated control (Sham contralateral [where contralateral stifle was sham] or DMM contralateral [where contralateral stifle underwent DMM surgery] groups). After 2 months of free cage movement (at 4.5 months of age), the mice were sacrificed and hindlimbs were collected for evaluation. Sham joints were not utilized in this experiment. Sham contralateral joints were combined with DMM contralateral joints to form the Control group (n=11 joints).
Fifteen mice, aged 3.5 months, underwent the same surgery outlined above (DMM n=12, Sham n=3). After 2 months of free cage movement (at 5.5 months of age), mice were sacrificed and hindlimbs were collected for evaluation. Sham contralateral joints were combined with DMM contralateral joints to form the Control group (n=15 joints).
Naturally Occurring OA
The contralateral (Control) joints described above were included in this analysis to represent joints from 4.5- (n=11 joints) & 5.5- (n=15 joints) month-old mice. One hind limb was also collected from ten 16-month old mice (n=10 joints). Both hind limbs were collected from eighteen 17-month-old mice (n=36 joints), however 3 joints could not be used due to sectioning difficulties (therefore, n=33 joints). Thirteen 23-month-old (n=26 joints) mice were sacrificed and both limbs were collected.
Histological preparation and assessments
All stifle joints (n=115 joints from 67 mice) were routinely fixed in 10% formalin, decalcified in 10% EDTA, processed, embedded intact into paraffin, and sectioned in a coronal plane. Sectioning, staining, grading, and measuring of these sections have been described previously in detail.14 Representative sections (sections of high quality in a midcoronal location within 100μm of each other) were evaluated. Two to four sections were stained with H&E or Safranin-O for evaluation. Evaluations were confined to the tibial plateaus. Measurements included articular cartilage area (AC area) and thickness (AC thick); subchondral bone area (SCB area) and thickness (SCB thick); areas of chondrocyte cell death (CCD, defined as areas of AC occupied by 2 or more dead chondrocytes as determined by H&E staining) and percentages of CCD (CCD%) with respect to total AC area; number of viable chondrocytes (#chond); areas of abaxial (AbaxOP) and axial (AxOP) osteophytes; and total area (Men) and percentage of CCD within the meniscus (MenCCD%). Areas with full thickness cartilage loss were given “0” for area of CCD, “100%” for CCD%, and “0” for #chond. Lastly, articular cartilage structure (ACS), and Safranin-O staining (Saf-O) were evaluated using semiquantitative scores that ranged from 0–12. For comparison, the original Mankin HHGS grading scheme1, was applied to both tibial plateaus of these same sections.
TUNEL staining
To determine if the dead chondrocytes observed were the result of apoptosis, one section from twelve different joints was was used for TUNEL assays using an in situ cell death detection kit (Chemicon International, USA). These included 2 joints with surgically induced OA (4.5mo DMM), 7 joints with naturally occurring OA (17 & 23 month old joints), and 3 joints in which no OA or CCD was present (5.5mo Controls). In OA joints, sections were used in which at least one tibial plateau contained >25% dead chondrocytes. Murine thymus was used as a positive control. Slides were deparaffinized with xylene, rehydrated through a series of decreasing concentrations of ethanol, and were washed with tris-buffered saline (TBS). Antigen retrieval was achieved with citrate buffer. Slides were washed with TBS, endogenous peroxidase activity was blocked with 3% H2O2, and slides were washed again three times. Slides were incubated with the Equilibrium buffer for 10 seconds, and then incubated with TdT enzyme for 60 minutes at room temperature (RT). The slides were incubated with stop buffer for 10 minutes at RT, and then were washed three times with TBS. Anti-Digoxigenin-Peroxidase was applied to the slides and incubated at RT for 30 minutes. Slides were washed three times with TBS, and DAB was added for 4 minutes. Slides were washed in distilled water and counterstained with Mayer’s Hematoxylin (DAKO).
Statistics
All histological data from the newly developed scheme (continuous measurements and semiquantitative grades) from the medial tibial plateaus were subjected to Principal Components Analysis (PCA; SAS Proc Factor, Cary, NC) as previously described14 to reduce 15 correlated OA parameters to 5 uncorrelated factors (principal components). The 5 factors generated by PCA were orthogonal linear transformations of the original observations and were each composed of a group of parameters that were closely related to one another. The five factors were renamed to reflect these relationships and included Articular Cartilage Integrity (Factor 1), Chondrocyte Viability (Factor 2), Subchondral Bone (Factor 3), Meniscus (Factor 4), and Periarticular Bone (Factor 5) (Table 1).
Table 1.
Summary of five factors retained from Principal Components Analysis, in order of percent variation accounted for by the factor, and relationship to OA severity.
| Variation Explained (%) | Factor | Name | Composition | Direction |
|---|---|---|---|---|
| 30.3% | 1 | Articular Cartilage Integrity | Articular cartilage area and thickness, Articular Cartilage Structure score, Safranin-O staining score | Lower factor score: more severe OA |
| 18.8% | 2 | Chondrocyte Viability | Chondrocyte cell death area and %, number of viable articular chondrocytes, viable articular cartilage area | Higher factor score: more severe OA |
| 9.9% | 3 | Subchondral Bone | Subchondral bone area and thickness | Higher factor score: more severe OA |
| 8.5% | 4 | Meniscus | Weight-bearing meniscus area and chondrocyte cell death within the meniscus | Lower factor score: more severe OA |
| 7.0% | 5 | Periarticular Bone | Size of axial and abaxial osteophytes, if present | Higher factor score: more severe OA |
All factor scores and selected continuous measurements were subjected to ANOVA and post-hoc analyses (SPSS v.17). Tukey post-hocs were performed to address multiple comparisons in those analyses in which the overall results were significant, and those are the reported p-values unless otherwise noted. The semiquantitative grades and Mankin scores for each tibial plateau and total Mankin scores (summed Mankin scores from both plateaus) were evaluated using nonparametric statistical analyses.
Results
Medial vs. Lateral Tibial Plateaus
Histological lesions were most severe in the medial tibial plateaus in nearly all joints in both models, resulting in significant differences between medial and lateral tibial plateaus for multiple parameters. For this reason, data presented is from medial tibial plateaus unless otherwise noted. In general, the mean AC areas and thicknesses were lower, due to loss or thinning of articular cartilage, in medial tibial plateaus than the lateral tibial plateaus (Table 2, Supp. Table 1). The overwhelming majority of joints also had significantly higher mean SCB areas and thicknesses in medial tibial plateaus. A majority of joints had significantly larger CCD% and smaller total number of viable chondrocytes (#chond) in medial vs. lateral plateaus (Table 2, Supp. Table 1). Tidemark clefts were noted in several tibial plateaus (medial and lateral) and were associated with severe disease, but were too few to include in the analyses.
Table 2.
Select continuous and semiquantitative results (mean ± 95% CIs) and total Mankin HHGS score from the medial tibial plateaus, separated by intervention and/or age group.
| Treatment Group | AC area (μm2) | AC thickness (μm) | SCB area (μm2) | SCB thickness (μm) | CCD area (μm2) | CCD% | #chondr | ACS | Saf-O | Total Mankin HHGS |
|---|---|---|---|---|---|---|---|---|---|---|
| 4.5 month Surgically Induced | ||||||||||
| DMM | 31608 (26557, 36658) | 57.5 (47.1, 67.9) | 88731 (69054, 108409) | 43.3 (35.8, 50.9) | 6747 (4550, 8943) | 20.9 (15.8, 26.0) | 75 (64, 85) | 1.8 (0.4, 3.1) | 8 (6.2, 9.8) | 11.6 (10.9, 12.4) |
| Control | 39607 (34456, 44757) | 56.3 (49.1, 63.4) | 65079 (43111, 87046) | 45.4 (34.5, 56.3) | 2041 (891, 3190) | 5.5 (2.1, 8.7) | 126 (110, 142) | 0.7 (0.0, 1.4) | 4.8 (3.8, 5.8) | 8.5 (6.9, 10.0) |
| P-values | 0.050 | 0.845 | 0.151 | 0.785 | 0.001 | <0.0001 | 0.0001 | 0.315 | 0.016 | 0.004 |
| 5.5 month Surgically Induced | ||||||||||
| DMM | 26925 (18901, 34949) | 31.8 (21.3, 42.2) | 157502 (128522, 186482) | 129.5(104.9, 154.2) | 12150 (9152, 15148) | 48.9 (40.4, 57.5) | 54 (38, 69) | 4.8 (2.6, 7.1) | 8.9 (7.7, 10.1) | 8.9 (6.8, 11.0) |
| Control | 41687 (38294, 45080) | 49.7 (44.6, 54.8) | 112746 (82151, 143342) | 96.0 (69.1, 123.0) | 5330 (3677, 6895) | 12.9 (9.1, 16.7) | 119 (111.4, 126.7) | 1.2 (0.4, 2.0) | 1.7 (0.8, 2.6) | 2.4 (1.5, 3.3) |
| P-values | 0.001 | 0.004 | 0.052 | 0.091 | 0.0004 | <0.0001 | <0.0001 | 0.008 | <0.0001 | <0.0001 |
| Naturally Occurring | ||||||||||
| 16 month | 32313 (23741, 40886) | 39.4 (28.6, 50.2) | 91492 (67355, 115629) | 83.1 (63.5, 102.8) | 4892 (2482, 7300) | 23.6 (6.2, 41.1) | 78 (59, 97) | 3.9 (1.7, 6.1) | 5.7 (4.1, 7.3) | 11.9 (9.1, 14.7) |
| 17 month | 37066 (34093, 40040) | 45.0 (41.3, 48.6) | 111039 (93983, 128094) | 121.4 (81.5, 161.5) | 9090 (6684, 11497) | 26.6 (19.3, 33.8) | 91 (80, 101) | 3.1 (2.1, 4.1) | 2.4 (1.3, 3.4) | 8.0 (6.3, 9.6) |
| 23 month | 37032 (32586, 41478) | 44.1 (38.7, 49.5) | 94910 (83134, 106686) | 87.4 (75.8, 99.0) | 13832 (10657, 17007) | 39.0 (31.0, 47.0) | 70 (59, 80) | 2.5 (1.5, 3.4) | 4.6 (3.3, 5.8) | 10.1 (8.9, 11.4) |
| ANOVA | 0.209 | 0.021 | 0.040 | 0.062 | <0.001 | <0.001 | <0.001 | 0.001 | <0.001 | <0.001 |
AC= articular cartilage, SCB= subchondral bone, CCD= chondrocyte cell death, #chondr= total number of chondrocytes, ACS= articular cartilage structure score, Saf-O=Safranin-O staining score. DMM= destabilized medial meniscus group.
Mankin scores for each tibial plateau were evaluated (data not shown), however the results from individual medial and lateral joint compartments did not differ from those gained by the total Mankin score (sum of scores from both tibial plateaus); therefore, only the data derived from total Mankin score is reported.
Surgically Induced OA (DMM)
Results from the contralateral DMM limb and contralateral sham limb groups were closely similar; therefore results from these two groups were combined to create a single Control group for each age group (4.5 months, n=11 joints; 5.5 months, n=15 joints). Joints in the sham group were excluded from the following analyses because no differences were identified between those joints and the controls, and the sample size for the sham group was extremely small (n=3).
Articular Cartilage
Mean AC area was significantly reduced in the 4.5 month DMM stifles compared to Control stifles (p=0.050) (Table 2). In the 5.5 month DMM stifles, mean AC area and thickness were significantly reduced in DMM stifles compared to Controls (p=0.001 and p=0.004, respectively) (Table 2).
Subchondral Bone
There were no differences in SCB measurements between the 4.5-month-old DMMs and Controls. In the 5.5 month joints, DMM joints had significantly higher SCB areas than Controls (p=0.05) (Table 2).
Articular Cartilage Chondrocytes
The mean CCD area was significantly greater in medial tibial plateaus of the DMM stifles of both age groups than Controls (4.5 months, p=0.001; 5.5 months p=0.0004), as was CCD% (p<0.0001 for both) (Figure 1A and Table 2). Correspondingly, in both tibial plateaus, there was a significant decrease in #chond in DMM joints compared to Controls (4.5 months, p=0.0001; 5.5 months p<0.0001) (Table 2, Supp. Table 1).
Figure 1.

Evaluation of chondrocyte cell death in the medial tibial plateaus from the DMM joints (means ± 95% CIs). (A) Mean percentage of chondrocyte cell death. **=p<0.0001 when DMM (n=8) is compared to the Control joints (n=11) of the 4.5 month old mice, ^^=p<0.0001 when compared DMM (n=12) is compared to the Control joints (n=15) of the 5.5 month old mice. (B) Mean Chondrocyte Viability factor scores. **=p=0.0003 when compared to the Control joints of the 4.5 month old mice, ^^=p=0.0002 when compared to the Control joints of the 5.5 month old mice.
Meniscus and Periarticular Bone
The medial meniscus had a significantly smaller mean area in 5.5 month DMM mice vs. Control mice (p=0.008, Supp. Table 2); however no differences were observed in 4.5-month-old mice. Abaxial osteophytes, but not axial osteophytes, appeared to be increased in number in DMM vs. Control. Three abaxial osteophytes were present in the medial tibial plateau of 4.5 month DMM joints (Supp. Table 2, Figure 2). Six abaxial osteophytes were identified in the 5.5 month joints; all were located on the medial tibial plateaus of DMM stifles (Supp. Table 2, Figure 2). In the 4.5 month joints, five axial osteophytes were present in the lateral tibial plateau and 2 in the medial tibial plateau and these were evenly divided between surgical groups (Supp. Table 2). In the 5.5 month joints, six axial osteophytes were identified; all were located on the lateral tibial plateau and were distributed evenly among surgical groups (Supp. Table 2).
Figure 2.
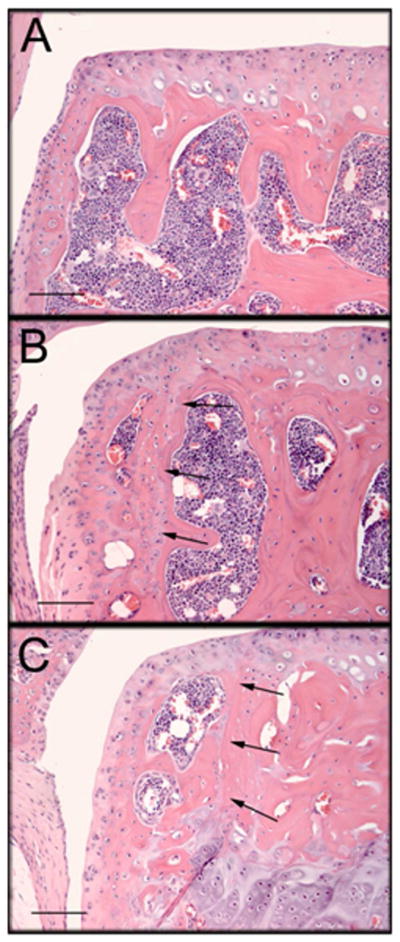
Histological sections demonstrating abaxial osteophytes located on the medial tibial plateaus of DMM joints. Bar = 100μm. (A) Abaxial joint margin of the medial tibial plateau from Control joint (no osteophyte) from Study 1. (B) Abaxial osteophyte on the medial tibial plateau of a 4.5 month old DMM joint. Arrows indicate original abaxial joint margin. (C) Larger abaxial osteophyte on the medial tibial plateau of a 5.5 month old DMM joint. Arrows indicate original joint margin.
Semiquantitative Grades
The 5.5 month DMM joints had significantly higher articular cartilage structure (ACS) scores than controls (p=0.001). In addition, the DMM group of both age groups had a significantly higher Safranin-O (Saf-O) grades than respective Controls (p=0.016 for 4.5 month, p<0.0001 for 5.5 month) (Table 2).
Factor Scores
The Articular Cartilage Integrity factor scores in the 5.5 month mice were significantly lower in DMM joints vs. Controls (p=0.002; more severe OA, Supp. Table 3). The Chondrocyte Viability factor scores were significantly higher (more severe OA) in DMM joints in both age groups vs. Controls (p=0.0003 for 4.5 months, p=0.0002 for 5.5 months) (Figure 1B, Supp. Table 3). Meniscus factor scores were significantly lower in the 5.5 month DMM joints vs. Controls (p=0.003; more severe OA, Supp. Table 3). Finally, Periarticular Bone factor scores were significantly higher in 5.5 month DMM joints than Controls (p=0.01; more severe OA, Supp. Table 3).
Mankin HHGS
DMM joints in both age groups had a significantly higher total Mankin score than respective Controls (p=0.004 for 4.5 months, p<0.0001 for 5.5 months) (Table 2).
Naturally Occurring OA
Articular Cartilage
There was a significant difference in the average AC thickness in the medial (Fig. 3B) & lateral (Supp. Table 1) tibial plateaus (ANOVA, p=0.02 & p=0.001 respectively) among age groups. In the medial tibial plateaus, 4.5 month joints had significantly thicker AC than 16 month (p=0.018), 17 month (p=0.005), and 23 months (p=0.017). AC area was significantly different in the lateral tibial plateau (ANOVA, p=0.001; Supp. Table 1).
Figure 3.
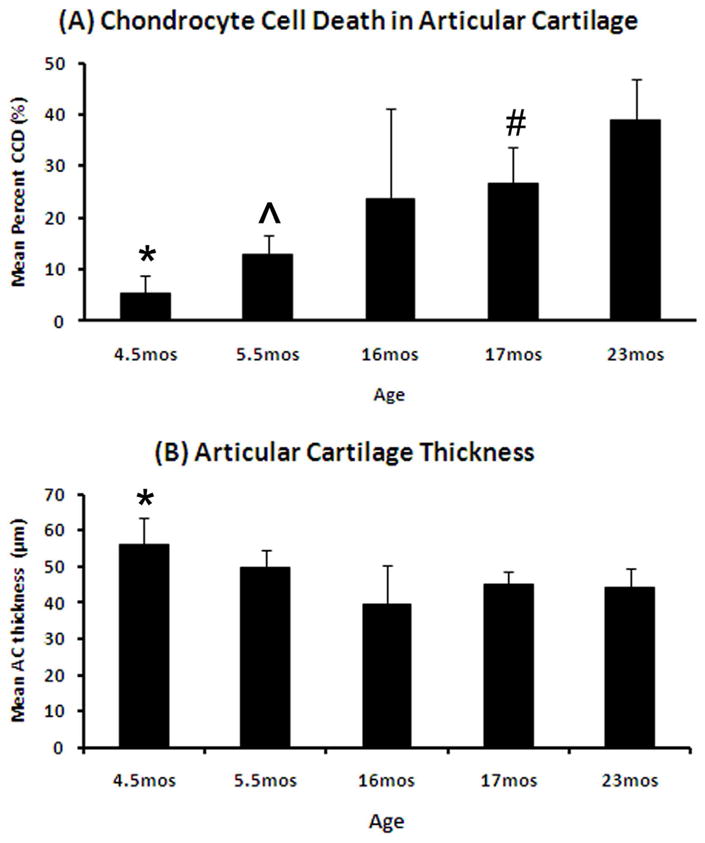
Changes in articular cartilage and chondrocyte cell death in C57Bl/6 mice by age (means ± 95% CIs). (A) Mean percentage of chondrocyte cell death (CCD) by age. *=4.5 months (n=8) compared to 5.5 months (p=0.01, n=15), 16 months (p=0.05, n=10), 17 months (p=0.002, n=16), and 23 months (p<0.0001, n=13); ^=5.5 months compared to 17 months (p=0.02) and 23 months (p<0.0001), and #= 17 months compared to 23 months (p=0.03). (B) Mean articular cartilage (AC) thickness by age. *=4.5 months when compared to 16 months (p=0.018), 17 months (p=0.005), and 23 months (p=0.017).
Subchondral Bone
There was a significant difference in SCB area (ANOVA, p=0.04), where 4.5 month old joints had significantly less SCB than 17 month old joints (Table 2).
Articular Cartilage Chondrocytes
There were significant differences in CCD area and CCD% within the articular cartilage in the both tibial plateaus vs. age (ANOVA, p<0.001 for medial, Fig. 3A; ANOVA, p=0.003 for CCD area and p<0.001 for CCD% for lateral, Supp. Table 1). The youngest mice had the smallest CCD area and this progressively increased with age (Table 2). In the medial tibial plateau, all comparisons among age groups using CCD area and CCD% were significant except for those involving 16 month old mice, which were not significantly different from any other age group. In addition, there was a significant decrease in #chond with age (ANOVA, p<0.001), with all treatment groups being significantly different from each other with the exception of 16 month compared to 17 & 23 month old joints. (Table 2)
Periarticular Bone
While axial osteophytes appeared to be equally distributed among age groups, abaxial osteophytes were predominantly found in aged joints. Axial osteophytes were present in all 5 age groups (Supp. Table 2; 4.5 month, n=4, 18% of tibial plateaus; 5.5 month, n=4, 13%; 16 month, n=7, 35%; 17 month, n=25, 37%; 23 month, n=11, 21%). Of the 51 total axial osteophytes, 84% were located on the lateral tibial plateau. Abaxial osteophytes were only found in the 16–23 month old animals (Supp. Table 2; 16 month, n=2, 10% of tibial plateaus; 17 month, n=10, 15%; 23 month, n=9, 17%). In addition, 90% of abaxial osteophytes were located on the medial tibial plateau.
Semiquantitative Grades
There were significant age-related differences in ACS and Saf-O scores (Kruskal-Wallis, p<0.001 for ACS & Saf-O), with scores for both parameters generally increasing with age. The 4.5 month old joints had significantly lower ACS scores than 16 month (p=0.004) and 17 month (p=0.002) old joints. (Table 2) The 5.5 month old joints had significantly lower Saf-O scores than 4.5 month (p=0.015), 16 month (p=0.0004), and 23 month (p=0.003) old joints. The 17 month old joints had significantly lower Saf-O scores than 4.5 month (p=0.002), 16 month (p=0.0009), and 23 month (p=0.002) old joints. (Table 2)
Factor Scores
Significant differences were found in Chondrocyte Viability (ANOVA, p<0.0001) and Subchondral Bone (ANOVA, p<0.001) factor scores (Supp. Table 3). Chondrocyte Viability factor scores increased with age similar to the measurement data (Supp. Table 3). The differences among age groups were significant with the exception of 4.5 & 5.5 month old joints and 16 & 17 month old joints, which were not significantly different from each other. The 4.5 month old joints had significantly lower Subchondral Bone factor scores than the other four age groups (5.5 months, p=0.006; 16 months, p=0.045; 17 months, p=0.0006; 23 months, p<0.0001) (Supp. Table 3).
Mankin HHGS
Mankin scores were significantly affected by age (Kruskal-Wallis, p<0.0001), with 5.5 month old joints having significantly lower medial (data not shown) & total joint scores (Table 2) than 4.5 month (p<0.0001), 16 month (p<0.0001), 17 month (p=0.0001), and 23 month (p<0.0001) old joints.
TUNEL staining
TUNEL staining identified positive chondrocytes adjacent to the necrotic areas within the articular cartilage of sections containing areas of CCD in both surgically induced (Figure 4C) and naturally occurring OA (Figure 4D). The number of positive cells appeared to increase in correlation with the amount of CCD in both models. No TUNEL positive cells were identified in articular cartilage in any sections from normal joints with no CCD or OA lesions. (Figure 4E) Numerous positive cells were identified in sections of murine thymus used as a positive control. (Figure 4F)
Figure 4.

Histological sections demonstrating chondrocyte cell death (CCD) identified in the mouse stifle joints and TUNEL staining. (A–B) Bar = 100μm, (C–F) Bar = 50μm; femoral condyle in top of images, tibial plateau on the bottom. Black arrows indicate areas of CCD, black arrow heads indicate indicate tidemark, red arrows indicate TUNEL positive chondrocytes adjacent to areas of chondrocyte cell death. (A) 5.5mo DMM with a large area of CCD on the tibial plateau and femoral condyle not associated with significant cartilage degeneration. (B) 5.5mo DMM CCD in both the tibial plateau and femoral condyle, associated with extensive damage to the articular cartilage, including areas of full thickness loss. (C) 4.5mo DMM, TUNEL staining of section containing CCD in the tibial plateau. (D) 17mo joint with age-related OA, TUNEL staining of section containing CCD in the tibial plateau. (E) 5.5mo Control, TUNEL staining of section of tibial plateau with no cell death or OA and no positive staining. (F) Mouse thymus was used as a positive control.
Discussion
This study was the first to apply a comprehensive OA grading scheme to a large number of mice with surgically induced and naturally occurring OA. Fifteen histological parameters are included in the new scheme and can be evaluated individually or combined in the form of factor scores generated by PCA. Further details of this scheme have been recently published.15 Significant and scientifically logical differences in OA severity were identified using the continuous measurements, semiquantitative scores, and factor scores. Overall, factor scores substantiated the results identified when separate parameters were evaluated but did not identify new relationships. A benefit of generating factor scores, however, is they provide a way of combining semiquantitative assessments with continuous measurements into one analysis and may provide a succinct method of summarizing changes found within the joint. In addition, factor scores are standardized and can allow comparisons across studies, assuming data from all studies is included in the initial PCA. A drawback to using PCA is that loadings and factor scores are data dependent and are not transferable to a new data set, therefore the analysis would have to be repeated for each new study.
For comparison with our newly developed OA evaluation scheme, the Mankin HHGS1 was applied to both tibial plateaus in all joints, with similar results in some cases. The Mankin HHGS identified significant differences between surgical groups in the DMM model and also identified age-related changes in naturally occurring OA; however the latter were limited to differences between a single age group (5.5 months) when compared to all other ages. In addition, the Mankin HHGS failed to identify changes in the subchondral and periarticular bone, prevalence of chondrocyte cell death, or differences in cartilage area and thickness that were identified by our newly devised scheme.
The present study supported previous findings regarding spontaneous and surgically induced OA in mice and revealed several new insights. OA lesions, including a decrease in articular cartilage area and thickness and an increase in chondrocyte cell death, were most severe in the medial tibial plateau vs. the lateral tibial plateau in both surgically induced and naturally occurring OA, a finding that has been demonstrated in mouse models and other animal species.15–19 This contradicts a previous finding by van der Kraan, et al, that showed that OA lesions in older (1–2 years) C57Bl/6 mice were more severe in the lateral tibial plateau in 63% of the mice.20 However, the lesions in that study were identified using a simplified 4-level scoring system (none, slight, moderate, severe) and using only 14–16 animals in two age groups.
In the present study there also was a consistent increase in CCD with age in both models, which appears to be a new finding. TUNEL staining of sections containing large areas of CCD identified positive chondrocytes, a finding that supports other studies that suggest apoptosis as a mechanism of death in murine OA.19, 21 Initial studies we had also immunostained for caspase-3 as a marker for apoptosis but did not detect positive immunostaining (data not shown) suggesting that the TUNEL technique may be more sensitive.
The DMM model22 of OA in mice was confirmed to be a highly reproducible model that can induce moderate to severe articular cartilage lesions in young mice within eight weeks postoperatively. Lesions increased in severity (e.g. thinner articular cartilage, thicker subchondral bone, more chondrocyte cell death, and larger osteophytes) when mice that were 4 weeks older were used. In addition, an increase in osteophyte number and size was observed in destabilized joints, which also occurs in other surgically induced models of OA in both rodents and nonrodents.23–25 Abaxial osteophytes identified in the present study occurred much more commonly in the surgically-induced models (presumably due to increased joint instability) than the naturally occurring models. Axial osteophytes, on the other hand, were equally present among surgical groups, and were often located on the lateral tibial plateau.
Tidemark clefts, closely similar to those that have been previously identified and characterized in hamsters & other rodents26–29, were also identified in the murine joints and were often associated with severe disease. The mechanisms underlying the formation of the tidemark clefts, however, have not been identified in the mouse, and their relationship to disease progression is unclear. These clefts were identified in only a few sections and would likely be accounted for in other parameters (articular cartilage thickness and area, chondrocyte cell death parameters), therefore a separate evaluation of this parameter was not deemed necessary. Meniscal area measurements did not appear to provide useful information regarding disease severity, likely due to inconsistencies in plane of section that may artifactually result in differences in area, and also may be influenced in models like the DMM, where the meniscus may be displaced artificially.
Highly significant changes were identified in articular cartilage chondrocyte viability and number, both between surgical groups and as an age-related change (Figure 4). This change has been previously identified in the DMM mouse model in both young (12 week-old) and older (12 month-old) mice15 and also has been identified in a study focusing on a specific transgenic mouse model of OA, a nonhistone chromatin protein high-mobility group box protein 2 (HMGB2) knock-out that results in an earlier onset and more severe OA13. Immunostaining for the apoptosis marker poly (ADP-ribose) polymerase (PARP)-p86 in the HMGB2 knock-out mice indicated that the mechanism of cell death was by apoptosis13 similar to our finding of positive TUNEL staining. Importantly, chondrocyte cell death was often noted in the absence of other tissue changes (e.g., articular cartilage structural damage, Figure 4A), suggesting that it is an early change. Therefore detecting changes in viability of articular chondrocytes may be a method of identifying early osteoarthritic changes in mouse joints prior to the occurrence of matrix changes.
Lastly, changes associated with surgically induced OA (DMM model) were closely associated with those found in naturally occurring OA in aged joints. In particular, the parameters that evaluated chondrocyte cell death within the articular cartilage were similar in the DMM joints when compared to the aged (16, 17, & 23 month old) joints. (Table 2) Our finding of similar changes between DMM and spontaneous OA is important to researchers utilizing this model with the goal to mimic naturally occurring disease in addition to disease induced by trauma, and to evaluate the effects of various compounds on the progression or severity of OA.
There were limitations in the present study. The contralateral DMM limb was used as a control and it is possible that altered joint loading as a result of the DMM surgery may have had affected that joint. However, contralateral limbs of mice that received sham surgery were also included and we did not observe significant differences between contralateral DMM and contralateral sham joints in this study or in a previous study15. Also both joints from the 17- and 23-month old mice were pooled into each respective age group, assuming that disease occurred bilaterally and we expected similar scores from the same animal. Finally, we only examined and scored representative sections from the region of the joint with the most severe lesions, rather than scoring and summing results from multiple sections through the joint as done in other schemes, such as the OARSI score30 and that developed by Glasson, et al22. In contrast to those scoring systems which have important utility when the region of the joint with the most severe lesions is not clear, the newly developed scheme is meant to be applied to sections in which the most severe lesions have already been identified and further detailed characterization of those lesions is of value.
In summary, this study provided a comprehensive evaluation of changes in the murine stifle joint associated with OA in naturally occurring and surgically induced models using a comprehensive histological grading scheme. An increase in chondrocyte cell death was associated with increasing age and occurred in surgically induced models, both of which are new findings. In addition to changes identified within articular cartilage, changes in periarticular bone were also noted and would not have been recognized using traditional histological grading systems.
Supplementary Material
Acknowledgments
The authors would like to thank Josh Parker and Anne Undersander for their technical help with this project. Funding for this project was supported in part by the NIH Musculoskeletal Research Training Grant (T32 AR050938, CSC, MAM), the NIH Orthopaedics and Skeletal Biology Training Grant (T32 AR052272, MAM), an Arthritis Foundation Innovative Research Grant (RFL), and the Wake Forest University Translational Science Institute (RFL).
Footnotes
Contributions
All authors have made substantial contributions to (1), (2), and (3) below;
- The conception and design of the study, or acquisition of data, or analysis and interpretation of data
- The drafting of the article or revising it critically for important intellectual content
- Final approval of the version to be submitted.
Conflict of Interest Statement
The authors have no conflicts to disclose.
Publisher's Disclaimer: This is a PDF file of an unedited manuscript that has been accepted for publication. As a service to our customers we are providing this early version of the manuscript. The manuscript will undergo copyediting, typesetting, and review of the resulting proof before it is published in its final citable form. Please note that during the production process errors may be discovered which could affect the content, and all legal disclaimers that apply to the journal pertain.
References
- 1.Mankin HJ, Dorfman H, Lippiello L, Zarins A. Biochemical and metabolic abnormalities in articular cartilage from osteo-arthritic human hips. II. Correlation of morphology with biochemical and metabolic data. J Bone Joint Surg Am. 1971;53:523–37. [PubMed] [Google Scholar]
- 2.Lahm A, Uhl M, Erggelet C, Haberstroh J, Mrosek E. Articular cartilage degeneration after acute subchondral bone damage: an experimental study in dogs with histopathological grading. Acta Orthop Scand. 2004;75:762–7. doi: 10.1080/00016470410004166. [DOI] [PubMed] [Google Scholar]
- 3.Lozano J, Saadat E, Li X, Majumdar S, Ma CB. Magnetic resonance T(1 rho) imaging of osteoarthritis: a rabbit ACL transection model. Magn Reson Imaging. 2009;27:611–6. doi: 10.1016/j.mri.2008.09.006. [DOI] [PubMed] [Google Scholar]
- 4.Griffin TM, Huebner JL, Kraus VB, Guilak F. Extreme obesity due to impaired leptin signaling in mice does not cause knee osteoarthritis. Arthritis Rheum. 2009;60:2935–44. doi: 10.1002/art.24854. [DOI] [PMC free article] [PubMed] [Google Scholar]
- 5.Naito K, Watari T, Muta T, Furuhata A, Iwase H, Igarashi M, et al. Low-intensity pulsed ultrasound (LIPUS) increases the articular cartilage type II collagen in a rat osteoarthritis model. J Orthop Res. 2009;28:361–9. doi: 10.1002/jor.20995. [DOI] [PubMed] [Google Scholar]
- 6.Watters JW, Cheng C, Pickarski M, Wesolowski GA, Zhuo Y, Hayami T, et al. Inverse relationship between matrix remodeling and lipid metabolism during osteoarthritis progression in the STR/Ort mouse. Arthritis Rheum. 2007;56:2999–3009. doi: 10.1002/art.22836. [DOI] [PubMed] [Google Scholar]
- 7.Xu L, Servais J, Polur I, Kim D, Lee PL, Chung K, et al. Attenuation of osteoarthritis progression by reduction of discoidin domain receptor 2 in mice. Arthritis Rheum. 2010;62:2736–44. doi: 10.1002/art.27582. [DOI] [PMC free article] [PubMed] [Google Scholar]
- 8.Pritzker KP, Gay S, Jimenez SA, Ostergaard K, Pelletier JP, Revell PA, et al. Osteoarthritis cartilage histopathology: grading and staging. Osteoarthritis Cartilage. 2006;14:13–29. doi: 10.1016/j.joca.2005.07.014. [DOI] [PubMed] [Google Scholar]
- 9.Bomsta BD, Bridgewater LC, Seegmiller RE. Premature osteoarthritis in the Disproportionate micromelia (Dmm) mouse. Osteoarthritis Cartilage. 2006;14:477–85. doi: 10.1016/j.joca.2005.11.011. [DOI] [PubMed] [Google Scholar]
- 10.Botter SM, Glasson SS, Hopkins B, Clockaerts S, Weinans H, van Leeuwen JP, et al. ADAMTS5−/− mice have less subchondral bone changes after induction of osteoarthritis through surgical instability: implications for a link between cartilage and subchondral bone changes. Osteoarthritis Cartilage. 2009;17:636–45. doi: 10.1016/j.joca.2008.09.018. [DOI] [PubMed] [Google Scholar]
- 11.Mason RM, Chambers MG, Flannelly J, Gaffen JD, Dudhia J, Bayliss MT. The STR/ort mouse and its use as a model of osteoarthritis. Osteoarthritis Cartilage. 2001;9:85–91. doi: 10.1053/joca.2000.0363. [DOI] [PubMed] [Google Scholar]
- 12.Schunke M, Tillmann B, Bruck M, Muller-Ruchholtz W. Morphologic characteristics of developing osteoarthrotic lesions in the knee cartilage of STR/IN mice. Arthritis Rheum. 1988;31:898–905. doi: 10.1002/art.1780310711. [DOI] [PubMed] [Google Scholar]
- 13.Taniguchi N, Carames B, Ronfani L, Ulmer U, Komiya S, Bianchi ME, et al. Aging-related loss of the chromatin protein HMGB2 in articular cartilage is linked to reduced cellularity and osteoarthritis. Proc Natl Acad Sci USA. 2009;106:1181–6. doi: 10.1073/pnas.0806062106. [DOI] [PMC free article] [PubMed] [Google Scholar]
- 14.McNulty MA, Loeser RF, Davey C, Callahan MF, Ferguson CM, Carlson CS. A Comprehensive Histological Assessment of Osteoathritis Lesions in Mice. 2011 doi: 10.1177/1947603511402665. In Press. [DOI] [PMC free article] [PubMed] [Google Scholar]
- 15.Loeser RF, Olex A, McNulty MA, Carlson CS, Callahan M, Ferguson C, et al. Microarray analysis reveals age-related differences in gene expression during the development of osteoarthritis in mice. Arthritis Rheum. 2011 doi: 10.1002/art.33388; 10.1002/art.33388. [DOI] [PMC free article] [PubMed] [Google Scholar]
- 16.Bendele AM. Animal models of osteoarthritis. J Musculoskelet Neuronal Interact. 2001;1:363–76. [PubMed] [Google Scholar]
- 17.Bendele AM, Hulman JF. Spontaneous cartilage degeneration in guinea pigs. Arthritis Rheum. 1988;31:561–5. doi: 10.1002/art.1780310416. [DOI] [PubMed] [Google Scholar]
- 18.Carlson CS, Loeser RF, Jayo MJ, Weaver DS, Adams MR, Jerome CP. Osteoarthritis in cynomolgus macaques: a primate model of naturally occurring disease. J Orthop Res. 1994;12:331–9. doi: 10.1002/jor.1100120305. [DOI] [PubMed] [Google Scholar]
- 19.Mistry D, Oue Y, Chambers MG, Kayser MV, Mason RM. Chondrocyte death during murine osteoarthritis. Osteoarthritis Cartilage. 2004;12:131–41. doi: 10.1016/j.joca.2003.10.006. [DOI] [PubMed] [Google Scholar]
- 20.van der Kraan PM, Stoop R, Meijers TH, Poole AR, van den Berg WB. Expression of type X collagen in young and old C57Bl/6 and Balb/c mice. Relation with articular cartilage degeneration. Osteoarthritis Cartilage. 2001;9:92–100. doi: 10.1053/joca.2000.0364. [DOI] [PubMed] [Google Scholar]
- 21.Ryu JH, Shin Y, Huh YH, Yang S, Chun CH, Chun JS. Hypoxia-inducible factor-2alpha regulates Fas-mediated chondrocyte apoptosis during osteoarthritic cartilage destruction. Cell Death Differ. 2011 doi: 10.1038/cdd.2011.111; 10.1038/cdd.2011.111. [DOI] [PMC free article] [PubMed] [Google Scholar]
- 22.Glasson SS, Blanchet TJ, Morris EA. The surgical destabilization of the medial meniscus (DMM) model of osteoarthritis in the 129/SvEv mouse. Osteoarthritis Cartilage. 2007;15:1061–9. doi: 10.1016/j.joca.2007.03.006. [DOI] [PubMed] [Google Scholar]
- 23.Boileau C, Martel-Pelletier J, Abram F, Raynauld JP, Troncy E, D’Anjou MA, et al. Magnetic resonance imaging can accurately assess the long-term progression of knee structural changes in experimental dog osteoarthritis. Ann Rheum Dis. 2008;67:926–32. doi: 10.1136/ard.2007.077297. [DOI] [PubMed] [Google Scholar]
- 24.Hayami T, Pickarski M, Zhuo Y, Wesolowski GA, Rodan GA, Duong le T. Characterization of articular cartilage and subchondral bone changes in the rat anterior cruciate ligament transection and meniscectomized models of osteoarthritis. Bone. 2006;38:234–43. doi: 10.1016/j.bone.2005.08.007. [DOI] [PubMed] [Google Scholar]
- 25.Little CB, Barai A, Burkhardt D, Smith SM, Fosang AJ, Werb Z, et al. Matrix metalloproteinase 13-deficient mice are resistant to osteoarthritic cartilage erosion but not chondrocyte hypertrophy or osteophyte development. Arthritis Rheum. 2009;60:3723–33. doi: 10.1002/art.25002. [DOI] [PMC free article] [PubMed] [Google Scholar]
- 26.Julkunen P, Halmesmaki EP, Iivarinen J, Rieppo L, Narhi T, Marjanen J, et al. Effects of growth and exercise on composition, structural maturation and appearance of osteoarthritis in articular cartilage of hamsters. J Anat. 2010;217:262–74. doi: 10.1111/j.1469–7580.2010.01270.x. [DOI] [PMC free article] [PubMed] [Google Scholar]
- 27.Otterness IG, Chang M, Burkhardt JE, Sweeney FJ, Milici AJ. Histology and tissue chemistry of tidemark separation in hamsters. Vet Pathol. 1999;36:138–45. doi: 10.1354/vp.36-2-138. [DOI] [PubMed] [Google Scholar]
- 28.Bendele AM, White SL, Hulman JF. Osteoarthrosis in guinea pigs: histopathologic and scanning electron microscopic features. Lab Anim Sci. 1989;39:115–21. [PubMed] [Google Scholar]
- 29.Walker JM. Exercise and its influence on aging in rat knee joints*. J Orthop Sports Phys Ther. 1986;8:310–9. doi: 10.2519/jospt.1986.8.6.310. [DOI] [PubMed] [Google Scholar]
- 30.Glasson SS, Chambers MG, Van Den Berg WB, Little CB. The OARSI histopathology initiative - recommendations for histological assessments of osteoarthritis in the mouse. Osteoarthritis Cartilage. 2010;18(Suppl 3):S17–23. doi: 10.1016/j.joca.2010.05.025. [DOI] [PubMed] [Google Scholar]
Associated Data
This section collects any data citations, data availability statements, or supplementary materials included in this article.