

Abstract
Background & Aims
Hepatic elastography (HE) is a non-invasive technique that measures liver stiffness and is used to diagnose hepatic fibrosis. It can help patients thought to have early-stage disease avoid a staging liver biopsy, but only when confounding variables that increase liver stiffness are excluded. Chronic inflammation from hepatitis C virus (HCV) infection is not considered to be one of these variables.
Methods
We identified 684 patients with HCV and METAVIR fibrosis scores of 0–2 from a prospective, multi-institutional study of liver stiffness in 2880 patients with chronic liver disease.
Patients were 49.6±9.0 years old, 64.3% male, and had an average body mass index of 26.7±4.1.
Results
In a multivariate analysis, inflammation (based on histologic analysis) and level of alanine aminotransferase (ALT) were associated with liver stiffness. The chances of a patient having a level of stiffness that indicates cirrhosis increased with grade of inflammation and level of ALT. Using a conservative, 14.5 kPa cutoff for the diagnosis of cirrhosis, grade 3 inflammation had an odds ratio (OR) of 9.10 (95% confidence interval [CI], 2.49–33.4). Likewise, levels of ALT greater than 80 IU/L and 120 IU/L had ORs of 3.84 (95% CI, 2.10–7.00) and 4.10% (95% CI, 2.18– 7.69), respectively. The effect of the level of ALT persisted when analysis was restricted to patients with fibrosis scores of F0 to F1.
Conclusion
In patients with HCV infection and early-stage fibrosis, increased levels of ALT correlate with liver stiffness among patients in the lowest strata of fibrosis (METAVIR scores 0–2). Patients without fibrosis but high levels of ALT could have liver stiffness within the range for cirrhosis. Inflammation should be considered a confounding variable in analysis of liver stiffness.
Keywords: Fibroscan, cirrhosis, Inflammation, diagnostic test, imaging, chronic HCV
Introduction
Hepatic elastography (HE) uses ultrasound and shear waves to measure stiffness of the liver. It is a validated and reproducible, non-invasive method for making the diagnosis of liver cirrhosis. At the opposite end of the fibrosis spectrum, however, the predictive value of HE is a matter of ongoing study. Of chief interest for the practicing hepatologist is how chronic inflammation, as in the case of hepatitis C, affects the predictive value of HE. It is already recognized that certain conditions intrinsic to liver pathophysiology such as acute hepatitis, sinusoidal congestion and obstructive cholestasis increase liver stiffness independent of fibrosis stage. (1)
Hepatic inflammation, when acute and severe, has an effect on the viscoelasticity of the liver and results in an overestimation of liver fibrosis stage by HE, as is the case with hepatitis B flares and reemergent hepatitis C after liver transplantation. (2–3) In the setting of smoldering inflammation (e.g. chronic hepatitis C or steatohepatitis) however, the impact of inflammation on the predictive value of HE is less certain. Castera et al. concluded previously that liver stiffness measurements (LSM) did not correlate with varying degrees of necroinflammation in chronic hepatitis C (4); likewise in steatohepatitis, there are reports of no correlation between LSM and necroinflammatory activity or ALT. (5) However, Oliveri et al. concluded that necroinflammation was independently associated with liver stiffness, albeit in hepatitis B infected individuals (2).
There is sufficient animal model evidence that viscoelasticity of the hepatic parenchyma is decreased prior to the deposition of collagen scar. (6) The etiology of this dynamic, physical property is poorly defined, though cellular edema and cytoskeletal changes are possible contributors. Herein we present the results of a large, prospective multi-institutional study of HE in a North American cohort with chronic hepatitis C. We excluded patients with advanced fibrosis (METAVIR F3-4) and focused specifically on the earliest stages of fibrosis (METAVIR F0-2) in an effort to determine whether histologic and biochemical inflammation confounds the predictive value of HE.
Methods
Study Design
A prospective, multi-institutional study of liver stiffness by TE in patients with chronic liver disease undergoing liver biopsy has been in place since 2004 with correlation of LSM to clinical data and histological grade and stage of disease by METAVIR score. The results of this study were pooled with those of a parallel study ongoing at the Liver Center of the Beth Israel Deaconess Medical Center. LSM was evaluated using the FibroScan (Echosens (Paris, France)) between December 2004 and September 2009. The total study population included males and females of at least 18 years of age with viral hepatitis. The inclusion criteria were a confirmed diagnosis of chronic hepatitis C (detectable serum HCV RNA), successful liver stiffness measurements (LSM; kPa), liver biopsy obtained within 3 months of each other. Patients with any of the following were excluded from study participation: active malignancy except for basal or squamous cell skin lesions, uninterpretable biopsy specimen, HCV therapy within last 6 months, other chronic liver disease (including Wilson disease, alpha1-antitrypsin deficiency, cholestatic liver disease, or hemochromatosis), clinical ascites, BMI ≥ 40, pregnancy, or an implantable cardiac device. Steatosis without a diagnosis of NASH was included. We further restricted our analysis to those patients with F0-F2 fibrosis. All patients provided written informed consent.
Data Collection: History, Physical and Laboratory Examination
Data collected were age, sex, race, body mass index, alcohol consumption by history, stigmata of liver disease, ALT levels at the time of TE, HIV serology, and imaging results. Prior or current heavy alcohol use was defined as >50 g/day for 5 years or more. HBV coinfection was ruled out by routine serology. The study protocol conformed to the ethical guidelines of the 1975 Declaration of Helsinki as reflected in a priori approval by the BIDMC Institutional Review Board and written informed consent was obtained from all patients.
Primary Data Interpretation: Transient Elastography and Histology
Liver stiffness measurements (kPa) were determined as previously described. FibroScan was considered accurate if patients had at least 8 successful measurements, a minimum 60% success rate and an interquartile range/median liver stiffness ratio of < 0.3. The reproducibility of hepatic elastography has been well established in prior works, with published intra- and interoperator agreement statistics of 0.98. (7) This finding is generalizable across studies that compare the patients with the same underlying disease. (8) In this study, intra- and inter-operator variability was evaluated at one center. Measurements taken by two different people on the same day (inter-operator) and measurements taken by the same person one week apart (intra-operator) with coefficients of variability of 2.97% and 5.37% respectively. Liver biopsies were obtained within 12 weeks of TE and the METAVIR stage and grade was determined by one of two blinded, experienced hepatopathologists (TC, IN). The length of each liver biopsy specimen was established in centimeters. Fibrosis was staged according to METAVIR scoring system, a 0–4 scale: F0, no fibrosis; F1, portal fibrosis without septa; F2, portal fibrosis and few septa; F3, numerous septa or bridging fibrosis without cirrhosis; and F4, cirrhosis. Inflammatory activity was graded on a 0–3 score; 0, none; 1, mild; 2, moderate; and 3, severe. Steatosis was categorized as Grade 0 (<5%) grade 1 (5–32%), grade 2 (33–65%) and grade 3 (>66%) on H&E staining.
Statistical Analysis and Database Management
Statistical analysis was tailored to the nature of the variable. Patient demographics are given as mean ±1 SD as appropriate. For Table 4, for ease of interpretation, grade of inflammation was transformed into a continuous variable and ALT was depicted in multiples of the upper limit of normal (ULN, 40 IU/L). Student’s t-testing for two variables with normal distribution (Table 2), one-way ANOVA with Scheffe’s method for multiple comparisons for more than 2 variables of normal distribution (Tables 1 and 2), regression techniques and other descriptive statistics were performed with JMP 8 (SAS) (Tables 3 and 4).
Table 4.
The Effect of Inflammation on the Odds of a Falsely Significant Liver Stiffness Measurement in Patients with F0-F1 Fibrosis
The odds of a patient with F0-F1 fibrosis meeting various liver stiffness criteria for F3 and F4 fibrosis as a function of ALT level (as a multiple of the upper limit of normal). Data regarding the effect of histological inflammation is not shown. Elevated ALT has a robust effect on falsely significant elastographic results even when restricting analysis to the lowest strata of fibrosis
| 9.5 kPa Cutoff for ≥ F3 Fibrosis (Castera) | 10.3 kPa Cutoff for ≥ F3 Fibrosis (Fraquelli) | 11.9 kPa Cutoff for Cirrhosis (Fraquelli) | 12.5 kPa Cutoff for Cirrhosis (Castera) | 14.5 kPa Cutoff for Cirrhosis (Ziol) | |
|---|---|---|---|---|---|
| Odds Ratio (95% CI) | Odds Ratio (95% CI) | Odds Ratio (95% CI) | Odds Ratio (95% CI) | Odds Ratio (95% CI) | |
| ALT | |||||
| > ULN (40 IU/L) | 2.46 (1.24–4.88) | 2.22 (1.08–6.24) | 2.34 (0.95–5.75) | 2.34 (0.88–6.24) | 2.41 (0.69–8.34) |
| > 2x ULN (80 IU/L) | 5.64 (3.30–9.59) | 3.25 (1.83–5.75) | 4.27 (2.15–8.49) | 3.76 (1.80–7.85) | 4.82 (1.91–12.15) |
| >3x ULN (120 IU/L) | 3.90 (2.01–7.56) | 2.02 (1.00–4.10) | 2.42 (1.17–5.01) | 3.49 (1.5–8.10) | 3.62 (1.32–9.98) |
Table 2. Associations of Study Variables with Liver Stiffness.
Multiple regression model of the association of study variables with liver stiffness, controlling for stage of fibrosis. In a univariate analysis, grade 3 inflammation, ALT, gender and BMI were significantly associated with liver stiffness, controlling for fibrosis. In a multivariate model including these variables, only grade 3 inflammation and ALT were significantly associated with stiffness.
| Univariate Linear Regression | Multivariate Linear Regression | |||||
|---|---|---|---|---|---|---|
| Variable | β | Standard Error | p value | β | Standard Error | p value |
| Grade of Inflammation | ||||||
| Grade 1 | 1.45 | 1.58 | 0.36 | |||
| Grade 2 | 0.52 | 0.48 | 0.28 | |||
| Grade 3 | 9.68 | 1.93 | 6.96E-07 | 9.07 | 1.85 | 1.15E-06 |
| ALT [x ULN) | 0.76 | 0.12 | 5.30E-10 | 0.69 | 0.12 | 1.85E-08 |
| Steatosis (yes/no) | 0.41 | 0.13 | 0.18 | |||
| Age (per year) | 0.04 | 0.026 | 0.09 | |||
| Gender | 0.072 | 0.24 | 0.003 | - - | - - | ns |
| BMI (kg/m2) | 0.19 | 0.06 | 0.0009 | - - | - - | ns |
| Diagnosis of diabetes (yes/no) | 0.84 | 0.47 | 0.08 | |||
| Diagnosis of HIV (yes/no) | 0.44 | 0.59 | 0.45 | |||
| Alcohol Use (yes/no) | 0.34 | 0.26 | 0.19 | |||
Table 1. Basic Characteristics by METAVIR Score.
Basic characteristics of study population divided by METAVIR score. Age, grade of histological inflammation and liver stiffness differ significantly across strata of fibrosis.
| Total (n=684) | F0 Fibrosis (N=96) | F1 Fibrosis (N=323) | F2 Fibrosis (N=265) | p value |
|---|---|---|---|---|
| Age (years) | 47.3+/−9.2 | 49.1+/−9.1 | 51.0+/−8.5 | 0.001 |
| Sex (M;F) | 54;44 | 213;110 | 174;91 | ns |
| Body Mass Index | 26.0+/−4.2 | 26.6+/−4.1 | 27.0+/−4.1 | ns |
| Alananine Aminotransferase (IU/L) | 62.9+/−44.11 | 76.3+/−88.7 | 82.0+/−65.2 | ns |
| Steatosis (yes;no) | 56;40 | 125;198 | 119;146 | ns |
| Grade of inflammation | 1.04+/−0.48 | 1.31+/−0.52 | 1.62+/−0.54 | < 0.001 |
| Liver Stiffness Measurement (kPa) | 7.2+/−7.1 | 7.42+/−4.3 | 9.2+/−7.4 | 0.001 |
Table 3.
The Effect of Inflammation on the Odds of a Falsely Significant Liver Stiffness Measurement in Patients with F0-F2 Fibrosis
The odds of a patient with F0-F2 fibrosis meeting various liver stiffness criteria for F3 and F4 fibrosis as a function of ALT level (as a multiple of the upper limit of normal) and histological inflammation. Elevated ALT has a robust, reliable effect on falsely significant elastographic results.
| 9.5 kPa Cutoff for ≥ F3 Fibrosis (Castera) | 10.3 kPa Cutoff for ≥ F3 Fibrosis (Fraquelli) | 11.9 kPa Cutoff for Cirrhosis (Fraquelli) | 12.5 kPa Cutoff for Cirrhosis (Castera) | 14.5 kPa Cutoff for Cirrhosis (Ziol) | |
|---|---|---|---|---|---|
| Odds Ratio (95% CI) | Odds Ratio (95% CI) | Odds Ratio (95% CI) | Odds Ratio (95% CI) | Odds Ratio (95% CI) | |
| ALT | |||||
| > ULN (40 IU/L) | 1.51 (0.86–2.62) | 1.60 (0.88–2.84) | 1.60 (0.73–3.5) | 1.62 (0.71–3.71) | 1.71 (0.61–4.78) |
| >2x ULN (80 IU/L) | 3.37 (2.29–4.97) | 2.94 (1.96–4.40) | 3.70 (2.27–6.02) | 3.49 (2.1–5.81) | 3.84 (2.10–7.00) |
| >3x ULN (120 IU/L) | 3.75 (2.37–5.92) | 2.92 (1.81–4.67) | 4.01 (2.36–6.82) | 3.83 (2.20–6.66) | 4.09 (2.18–7.69) |
| Grade of Inflammation | |||||
| ≥ Grade 1 | 4.27 (0.56–32.5) | 3.52 (0.46–26.9) | 2.03 (0.27–15.7) | 1.81 (0.24–13.9) | 1.19 (0.15–9.2) |
| ≥ Grade 2 | 1.88 (1.33–2.72) | 1.84 (1.25–2.71) | 1.53 (0.96–2.40) | 1.51 (0.93–2.46) | 1.18 (0.66–2.11) |
| Grade 3 | 3.68 (1.05–12.9) | 4.48 (1.28–15.4) | 7.87 (2.23–27.8) | 5.85 (1.61–21.2) | 9.10 (2.48–33.4) |
General Patient Characteristics
These results are summarized below as well as in Table 1. We found 684 patients that met inclusion criteria from a total of 2,880 patients with available LSM. The principal reason for exclusion from our analysis is a stage of fibrosis on biopsy of F3 or F4 (1,322 patients). (Supplementary Figure 1) The mean age of our cohort was 49.6 +/− 9.0 years, with 440 men (64.3%) and 284 women (35.7%), and most patients had HCV genotype 1 infection (n=553, 80.8%). The average body mass index (BMI) of our cohort was 26.7 +/−4.1, which is considered overweight. The mean biopsy size was 1.74 +/− 0.6 cm. Ninety-six patients had stage F0 fibrosis (14.0%), 323 had F1 (47.2%) and 265 had F2 (38.7%). Sixteen patients had grade 0 histological inflammation (2.3%), 393 had grade 1 (57.4%), 265 had grade 2 (38.7%) and 10 had grade 3 (1.5%). One Hundred and sixty-seven (25.4%) patients had ALT less than 40 IU/L, 300 (45.6%) had ALT between 40 and 80 IU/L, 95 (14.4%) had ALT between 80 and 120 IU/L, 96 (14.6%) had ALT greater than 120 IU/L. Two hundred and ninety-nine patients had ≥ grade 1 steatosis (43.7%). There were 44 (6.4%) patients with diabetes and 28 (4.1%) patients with HIV coinfection. There were six centers involved in this study. Please refer to Supplementary Table 1 for basic demographic data by institution. The age, BMI, proportion of men, length of biopsy, successful measurement rate and interquartile range (kPa) were not significantly different between the centers
Results
Host factors associated with LSM
Table 2 details the results of a linear regression analysis. Controlling for stage of fibrosis, we found the most significant associations with liver stiffness in grade of histological inflammation and ALT levels. First we performed a univariate analysis with a number of variables that could conceivably impact liver stiffness. We found 4 significant relationships: grade 3 histological inflammation (beta 9.68, p = 6.96E-07), ALT, expressed as a multiple of the upper limit of normal (ULN), (beta 0.76, p = 5.30E-10), gender (beta 0.072, p = 0.003) and BMI (beta 0.19, p = 0.0009). Neither age, alcohol use, steatosis, HIV or diabetes significantly impacted liver stiffness. Thereafter, using the variables found to be significantly associated with liver stiffness by univariate analysis, we performed a multiple linear regression analysis, again controlling for fibrosis. Here, only grade 3 histological inflammation (beta 9.07, p = 1.15E-06) and ALT, expressed as a multiple of the upper limit of normal (ULN), (beta 0.69, p = 1.85E-08) were significant.
Effects of Inflammation on False Positive LSM
Given the association of inflammation with liver stiffness, we examined the effect of inflammation on the false positive staging of patients in whom elastography suggested advanced fibrosis (METAVIR F3-4 ), as defined by criteria set forth by Castera et al., Fraquelli et al. and Ziol et al. (4,7,9) Among these, the lowest cutoff for F3 is from Castera (9.5 kPA). The proportion of our patients that met this criteria by ALT is as follows: 12.0% (ALT < 40IU/L), 15.2% (ALT < 80IU/L), 17.8% (ALT < 120IU/L), 44.8% (ALT >120IU/L). Figures 1 and 2 show the proportion of our patients (all with METAVIR 0-2 fibrosis) that received liver stiffness measurements above the cutoffs indicative of cirrhosis by published criteria (Fraquelli > 11.9 kPa, Castera >12.5 kPa and Ziol >14.5 kPa). As the grade of inflammation or ALT level increased, an increasing proportion of patients received false positive stiffness measurements. While the greatest effect of histological inflammation appeared to occur at Grade 3, the effect of inflammation measured by ALT appeared to be linear. One patient (6.7%) with grade 0 inflammation met all criteria for F4 with a LSM of 22.3 kPa (this patient had an ALT of 107IU/L at the time of TE); 50% of patients with Grade 3 inflammation met Fraquelli criteria for cirrhosis. 3–5.4% of the 167 patients with ALT < 40IU/L met criteria for cirrhosis, while 18.8–28.1% of patients with ALT >120 IU/L met criteria for cirrhosis.
Figure 1.
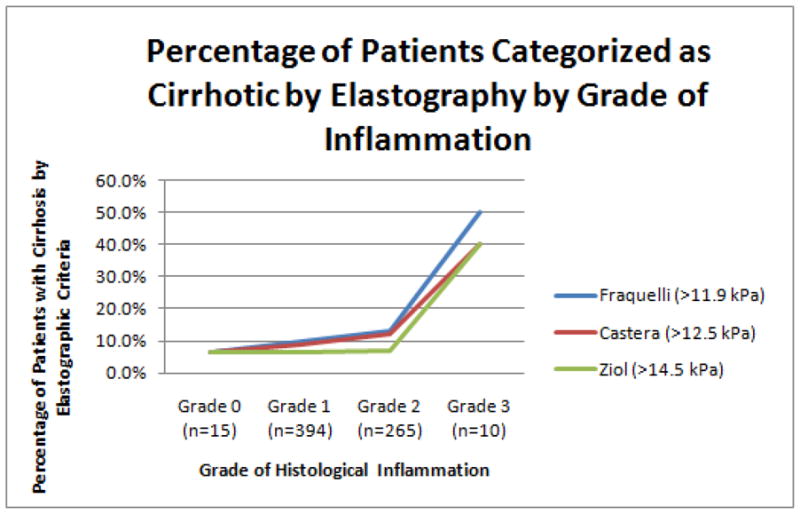
The proportion of our patients with F0-F2 fibrosis who meet published criteria for cirrhosis is depicted as a function of histological grade of inflammation.
Figure 2.

The proportion of our patients with F0-F2 fibrosis who meet published criteria for cirrhosis is depicted as a function of ALT level.
When the analysis is restricted to patients with F0-F1 only, many patients met elastographic criteria for significant fibrosis. Many still met criteria for cirrhosis. While no more than 5.2% of patients with ALT < 40 IU/L met any of the criteria for cirrhosis, of patients with ALT > 120 IU/L, 26.1% were cirrhotic by Fraquelli criteria (11.9 kPa), 19.6% by Castera (12.5 kPa) and 13.0% by Ziol (14.5 kPA). Many more met Castera criteria for F3 (9.5 kPa); 9.5% (ALT <40 IU/L), 11.5% (ALT <80 IU/L), 17.1% (ALT <120 IU/L) and 39.1% (ALT >120 IU/L).
Table 3 shows the odds of inflammation causing patients with F0-F2 fibrosis to receive liver stiffness measurements that meet cutoffs for ≥F3 and ≥F4 fibrosis by elastography according to the same published criteria. Castera et al. concluded that an effective cutoff to diagnose F3 and F4 fibrosis is 9.5 KPa and 12.5 KPa respectively. Fraquelli et al. used cutoffs of 10.3 kPa and 11.9 kPa for F3 and F4 fibrosis respectively. Finally, Ziol et al. used a 14.5 KPa cutoff for F4 fibrosis. For this analysis, variables were chosen according to their statistical significance in our multivariate regression: grade of necroinflammation and ALT as a multiple of its upper limit of normal (ULN, 40 IU/L).
We first examined the effect of histological inflammation on the odds of a false positive measurement by elastography (Table 3). By comparing the proportion of patients in each strata of histological inflammation that met the above criteria for advanced fibrosis, we determined the odds ratio for obtaining a spuriously significant result as a function of inflammation. The confidence intervals, however, were only significant in two cases. First, the odds of ≥ grade 2 impacting HE were significant for the results indicative of F3 for (9.5 or 10.3 kPa). Second, the odds of grade 3 inflammation impacting HE is significant for all criteria, including those cutoffs for cirrhosis.
We repeated this analysis for the effect of histological inflammation restricted to those patients with F0-1 fibrosis. In this restricted stratum of fibrosis, there were fewer patients with Grade 2 inflammation and only 3 patients with Grade 3 inflammation. These results (not shown) were not significant.
We next examined the effect of inflammation as reflected by the ALT level.. We found a significant effect of ALT on elastography, whether the data was analyzed using patients with F0-2 (Table 3) or only F0-1 fibrosis (Table 4). ALT levels greater 40 IU/L (the ULN) exhibited a trend towards a significant effect for patients with F0-2 (OR 1.51–1.71 with confidence intervals that cross 1) but significantly increased the odds that a patient’s liver stiffness measurement would meet criteria for F3 fibrosis for patients with F0-1 (2.46 95% CI (1.24–4.88) for a 9.5 kPa cutoff and 2.22 95% CI (1.08–6.24) for a 10.3 kPa cutoff). For ALT levels greater than 80 IU/L and 120 IU/L, there was a reliable, sizable effect on false positive LSM results irrespective of the inclusion of F2 patients (see tables 3 and 4).
Discussion
In this study of patients with chronic hepatitis C and early fibrosis, we showed that inflammation increases liver stiffness. For a large cohort of patients with F0-F2 fibrosis, inflammation significantly increased the odds of receiving a liver stiffness score indicative of advanced fibrosis and cirrhosis. Transient elastography is generally accepted for its ability to diagnose cirrhosis and exclude clinically significant fibrosis in published data on cohorts with hepatitis C. (4,7,9) There is ongoing debate about the interpretation of TE in clinical practice, particularly due to the confounders intrinsic to acute and chronic liver disease that may also increase liver stiffness. The variable with the most conflicting evidence to date is the presence of chronic inflammation, as in the case of hepatitis C and NASH. (4–5, 10–12)
Our results provide further evidence for a viscoelastic property of the liver that is influenced by conditions other than fibrosis, similar to that observed in cases of acute flares of hepatitis B or the reemergence of hepatitis C after orthotopic liver transplantation. A potential mechanism is that parenchymal edema increases stiffness in the absence of fibrosis and is responsible for the dramatic shift of stiffness seen with acute inflammation. Since over one-half of liver biopsies are performed for the staging of chronic hepatitis C, it is imperative that the hepatologist understands how to interpret elastography findings in the presence of chronic inflammation.
The core findings of our work are fourfold. First, we showed that some patients with chronic hepatitis C and F0-2 fibrosis are being read as cirrhotic on transient elastography. This includes 40%–50% of patients with grade 3 histological inflammation and 18.8%–28.1% of patients with ALT levels greater than 120 IU/L, depending on the stiffness cutoff employed. Second, by multiple regression, we showed that the only variables with a significant impact on liver stiffness aside from fibrosis are markers of inflammation (ALT and histological grade). Third, we quantified the effect of inflammation with the odds that a given ALT or grade of inflammation will cause a reading of F3 or F4 fibrosis. Fourth, we found that when we restrict our analysis to only the lowest strata of fibrosis (F0-F1), the effect of grade of inflammation is not measurable while the effect of ALT level remains robust. In summary, chronic necroinflammation, best reflected by ALT, can lead to an overestimation of liver fibrosis by hepatic elastography.
We chose to isolate the earliest strata of fibrosis for two reasons; (1) it is at the opposite end of fibrosis spectrum (stage F4) where the positive predictive value of elastography is already considered reliable and where the relative contribution of inflammation is overwhelmed by the effect of total collagen and scar and (2) the decision to avoid a staging liver biopsy (in any case other than cirrhosis) very much depends on predictive values at the lowest strata of fibrosis. In an aim to triage the decision making for liver biopsy, it has been suggested that elastography measurements in the cirrhotic range (> 12.5 or 14.5 kPa) do not need biopsy, and results in the intermediate ranges (between 7.3 and 12.5 kPa, for example) would need biopsy only if a specific stage of fibrosis is desired to make treatment decisions. (1) This study evaluates the diagnostic implications at the lowest strata of liver fibrosis.
Other studies have addressed the subject of inflammation as a confounder of TE. It was shown, for example, that stiffness increased during flares of hepatitis (2, 13), acute hepatitis (10) and decreases after virologic response to treatment. (14) Others found that a higher ALT for a given METAVIR score correlated with higher stiffness. (10,12,15) Conversely, a meta-analysis supports the accuracy of hepatic elastography across many disease-types even in the presence of inflammation. (16) However, none of the above studies focused solely on early stage fibrosis in hepatitis C.
An influential paper from Castera et al. in 2005 showed that in 183 patients with hepatitis C and F1-F4 fibrosis, the effect of necroinflammation on stiffness is negligible when controlling for fibrosis in a multiple regression. (4) By contrast, our data from 684 patients with hepatitis C and F0-F2 fibrosis suggested a significant association between LSM and both histological and biochemical measures of necroinflammation. This divergence with our data is best explained by the fact that Castera et al had zero patients with F0 fibrosis and 100 patients with F1-F2 in their study.
The utility of our findings should be evaluated in a context where minimal fibrosis is commensurate with HE reading of kPa < 5.5 or kPa < 7.3 kPa. Our data strengthens the negative predictive value of widely held criteria while weakening the positive predictive value of measurements that fall within an intermediate and advanced range. This interpretation is a reflection of the potential viscoelastic alterations caused by a chronic inflammatory state of the liver. We conclude here that for chronic hepatitis C, TE readings <7.3 kPa should be regarded as accurate for excluding F3-4 fibrosis regardless of the grade of inflammation. Elastographic results in the intermediate range (between 7.3 and 13 kPa) should be interpreted with caution, and an ALT > 2 X ULN is more likely to exert this confounding influence. An alternative to biopsy in such cases is to utilize non-invasive serological markers of fibrosis, as concordance would add predictive value.
In conclusion, we provide evidence that grade of histologic and laboratory-based inflammation seen in chronic hepatitis C is positively correlated with liver stiffness at the lowest strata of fibrosis (F0-2). As a result, the predictive value of TE is compromised when intermediate and advanced scores (kPa) are obtained, but strengthened when low scores are obtained. This may lead the hepatologist to consider many more patients for therapeutic intervention or liver biopsy when in reality they have a clinically less significant stage of fibrosis. The hepatologist should recognize this limitation and account for chronic inflammation when interpreting TE results. Future studies could look specifically at combining patients with early stage fibrosis and divergent elastographic measurements with a non-invasive serologic panel of fibrosis markers. This “second opinion” may provide more confidence in differentiating the true positive from the false positive result.
Supplementary Material
Supplementary Table 1. The demographics and data pertaining to the reproducibility of the elastography results is detailed.
Supplementary Figure 1. A flow sheet detailing exclusion and exclusion criteria for the analysis. Patients with non-hepatitis C liver disease and F3-F4 fibrosis formed the vast majority of exclusions
List of abbreviations
- ALT
Alanine Aminotransferase
- BMI
body mass index
- CI
confidence interval
- HCV
hepatitis C virus
- HIV
human immunodeficiency virus
- kPa
kilopascals
- LSM
liver stiffness measurements
- NASH
nonalcoholic steatohepatitis
- OR
odds ratio
- TE
transient elastography
- ULN
upper limit of normal
Footnotes
Disclosures: Drs. Afdhal, Bacon, Patel and Gordon are unpaid investigators for EchoSens.
Writing Assistance: none
Author Contributions: Concept, design and acquisition (Afdhal, Bacon, Patel, Gordon, Lawitz, Nelson), acquisition alone (Nasser, Challies), analysis and interpretation (Tapper, Cohen, Afdhal), drafting of manuscript and statistics (Tapper), critical revisions (Cohen, Afdhal, Patel)
Publisher's Disclaimer: This is a PDF file of an unedited manuscript that has been accepted for publication. As a service to our customers we are providing this early version of the manuscript. The manuscript will undergo copyediting, typesetting, and review of the resulting proof before it is published in its final citable form. Please note that during the production process errors may be discovered which could affect the content, and all legal disclaimers that apply to the journal pertain.
Contributor Information
Elliot B. Tapper, The Liver Center, Beth Israel Deaconess Medical Center, 330 Brookline Ave; LM-8001, Boston, MA 02215.
Eric B. Cohen, The Liver Center, Beth Israel Deaconess Medical Center, 330 Brookline Ave; LM-8001, Boston, MA 02215.
Keyur Patel, Duke University Medical Center, Durham, NC 27710.
Bruce Bacon, Saint Louis University School of Medicine, 3635 Vista Avenue at Grand Boulevard, P.O. Box 15250, St. Louis, Missouri 63110-0250.
Stuart Gordon, Columbus (Novi), 39450 12 Mile Road, Novi, MI, 48377.
Eric Lawitz, Alamo Medical Research, Camden Medical Center, 621 Camden, San Antonio, TX.
David Nelson, University of Florida COM, Box 100214, Room M-440 Gainesville, FL 32610-0214.
Imad A. Nasser, The Liver Center, Beth Israel Deaconess Medical Center, 330 Brookline Ave; LM-8001, Boston, MA 02215.
Tracy Challies, The Liver Center, Beth Israel Deaconess Medical Center, 330 Brookline Ave; LM-8001, Boston, MA 02215.
Nezam Afdhal, The Liver Center, Beth Israel Deaconess Medical Center, 330 Brookline Ave; LM-8001, Boston, MA 02215.
References
- 1.Cohen EB, Afdhal NH. Ultrasound-based hepatic elastography: origins, limitations, and applications. J Clin Gastroenterol. 2010 Oct;44(9):637–645. doi: 10.1097/MCG.0b013e3181e12c39. [DOI] [PubMed] [Google Scholar]
- 2.Oliveri F, Coco B, Ciccorossi P, et al. Liver stiffness in the hepatitis B virus carrier: a non-invasive marker of liver disease influenced by the pattern of transaminases. World J Gastroenterol. 2008 Oct 28;14(40):6154–6162. doi: 10.3748/wjg.14.6154. [DOI] [PMC free article] [PubMed] [Google Scholar]
- 3.Sagir A, Erhardt A, Schmitt M, Haussinger D. Transient elastography is unreliable for detection of cirrhosis in patients with acute liver damage. Hepatology. 2008 Feb;47(2):592–595. doi: 10.1002/hep.22056. [DOI] [PubMed] [Google Scholar]
- 4.Castera L, Vergniol J, Foucher J, et al. Prospective comparison of transient elastography, Fibrotest, APRI, and liver biopsy for the assessment of fibrosis in chronic hepatitis C. Gastroenterology. 2005 Feb;128(2):343–350. doi: 10.1053/j.gastro.2004.11.018. [DOI] [PubMed] [Google Scholar]
- 5.Wong VW, Vergniol J, Wong GL, Foucher J, Chan HL, Le Bail B, et al. Diagnosis of fibrosis and cirrhosis using liver stiffness measurement in nonalcoholic fatty liver disease. Hepatology. 2010;51:454–462. doi: 10.1002/hep.23312. [DOI] [PubMed] [Google Scholar]
- 6.Georges PC, Hui JJ, Gombos Z, et al. Increased stiffness of the rat liver precedes matrix deposition: implications for fibrosis. Am J Physiol Gastrointest Liver Physiol. 2007 Dec;293(6):G1147–1154. doi: 10.1152/ajpgi.00032.2007. [DOI] [PubMed] [Google Scholar]
- 7.Fraquelli M, Rigamonti C, Casazza G, et al. Reproducibility of transient elastography in the evaluation of liver fibrosis in patients with chronic liver disease. Gut. 2007 Jul;56(7):968–973. doi: 10.1136/gut.2006.111302. [DOI] [PMC free article] [PubMed] [Google Scholar]
- 8.Friedrich-Rust M, Ong MF, Martens S, Sarrazin C, Bojunga J, Zeuzem S, et al. Performance of transient elastography for the staging of liver fibrosis: a meta-analysis. Gastroenterology. 2008;134(4):960–974. doi: 10.1053/j.gastro.2008.01.034. [DOI] [PubMed] [Google Scholar]
- 9.Ziol M, Handra-Luca A, Kettaneh A, et al. Noninvasive assessment of liver fibrosis by measurement of stiffness in patients with chronic hepatitis C. Hepatology. 2005 Jan;41(1):48–54. doi: 10.1002/hep.20506. [DOI] [PubMed] [Google Scholar]
- 10.Arena U, Vizzutti F, Corti G, et al. Acute viral hepatitis increases liver stiffness values measured by transient elastography. Hepatology. 2008 Feb;47(2):380–384. doi: 10.1002/hep.22007. [DOI] [PubMed] [Google Scholar]
- 11.Kirk GD, Astemborski J, Mehta SH, et al. Assessment of liver fibrosis by transient elastography in persons with hepatitis C virus infection or HIV-hepatitis C virus coinfection. Clin Infect Dis. 2009 Apr 1;48(7):963–972. doi: 10.1086/597350. [DOI] [PMC free article] [PubMed] [Google Scholar]
- 12.Nitta Y, Kawabe N, Hashimoto S, et al. Liver stiffness measured by transient elastography correlates with fibrosis area in liver biopsy in patients with chronic hepatitis C. Hepatol Res. 2009 Jul;39(7):675–684. doi: 10.1111/j.1872-034X.2009.00500.x. [DOI] [PubMed] [Google Scholar]
- 13.Coco B, Oliveri F, Maina AM, et al. Transient elastography: a new surrogate marker of liver fibrosis influenced by major changes of transaminases. J Viral Hepat. 2007 May;14(5):360–369. doi: 10.1111/j.1365-2893.2006.00811.x. [DOI] [PubMed] [Google Scholar]
- 14.Vergniol J, Foucher J, Castéra, et al. Changes of non-invasive markers and FibroScan values during HCV treatment. Journal of Viral Hepatitis. 2009;16:132–140. doi: 10.1111/j.1365-2893.2008.01055.x. [DOI] [PubMed] [Google Scholar]
- 15.Wong GL, Wong VW, Choi PC, et al. Assessment of fibrosis by transient elastography compared with liver biopsy and morphometry in chronic liver diseases. Clin Gastroenterol Hepatol. 2008 Sep;6(9):1027–1035. doi: 10.1016/j.cgh.2008.02.038. [DOI] [PubMed] [Google Scholar]
- 16.Talwalkar JA, Kurtz DM, Schoenleber SJ, West CP, Montori VM. Ultrasound-based transient elastography for the detection of hepatic fibrosis: systematic review and meta-analysis. Clin Gastroenterol Hepatol. 2007 Oct;5(10):1214–1220. doi: 10.1016/j.cgh.2007.07.020. [DOI] [PubMed] [Google Scholar]
Associated Data
This section collects any data citations, data availability statements, or supplementary materials included in this article.
Supplementary Materials
Supplementary Table 1. The demographics and data pertaining to the reproducibility of the elastography results is detailed.
Supplementary Figure 1. A flow sheet detailing exclusion and exclusion criteria for the analysis. Patients with non-hepatitis C liver disease and F3-F4 fibrosis formed the vast majority of exclusions