

Abstract
Pseudo-continuous arterial spin labeling (PCASL) can provide best SNR efficiency with a sufficiently long tag at high fields such as 7T, but it is very sensitive to off-resonance fields at the tagging location. Here a robust Prescan procedure is demonstrated to estimate the PCASL RF phase and gradients parameters required to compensate the off-resonance effects at each vessel location. The Prescan is completed in 1–2 minutes and is based on acquisition of label/control pair-wise ASL data as a function of the RF phase increment applied to the PCASL train. It is shown that this approach can be used to acquire high quality whole-brain PCASL perfusion data of the human brain at 7T.
Keywords: Arterial spin labeling, 7T, Off-resonance effects, Prescan
INTRODUCTION
In recent years, arterial spin labeling (ASL) MRI has been used in many studies to measure cerebral blood flow in the human brain due to its non-invasiveness (1,2). Among the many techniques capable of measuring cerebral perfusion, ASL is probably the most attractive option for patient populations such as young children and those with impaired renal function or when repeated measurements are necessary as ASL is completely non-invasive. It is advantageous to apply ASL at high magnetic field since the signal-to-noise ratio (SNR) of ASL techniques increases with the magnetic field due to the increase in intrinsic sensitivity and longer T1 of blood. The longer T1 at higher field also allows for better compensation of long blood transit times often found in pathological cases since the lifetime of tagged blood signal is increased. However, the tagging duration needed to achieve the best SNR per unit time also increases with the magnetic field strength (3). For example, the tag duration to obtain best SNR per unit time with whole brain coverage increases from about 0.9 s at 3T to 1.3 s at 7T for pulsed ASL (PASL) and from 2 s at 3T to 3 s at 7T for continuous ASL (CASL).
Conventional ASL techniques can be categorized into PASL (4–7) and CASL (8–11) techniques. In PASL, the inflowing blood spins are tagged once with a short (milliseconds) adiabatic inversion RF pulse and the duration of tagged blood is controlled by the spatial extent of the slice-selective inversion and saturation pulses (12). In CASL, the blood spins are inverted by adiabatic fast passage (13) while flowing through a finite plane defined by a constant-amplitude RF and gradient pulses for a few seconds, and the tag duration is directly controlled by the RF pulse length. Since PASL relies on the physical space below the imaging area to create a sufficient tag duration, it is difficult to create a tag duration longer than 1 s with a head-size RF excitation coil at 7T in order to obtain whole brain coverage. Even at 3T with commercial body-size RF excitation, whole brain coverage with tag durations longer than 1 s is challenging due to fast flowing spins in the neck area (14). On the other hand, CASL is limited at 7T due to higher specific absorption rate (SAR) unless a dedicated local neck coil (15,16) is used for tagging. This approach however requires additional hardware and extra setup time.
In the past few years, pseudo-continuous ASL (PCASL) techniques have become popular for measurement of perfusion in the human brain (17–19) since they can be performed on commercially available scanners without additional hardware. Further, PCASL allows for long tag durations to achieve best SNR per unit time at high magnetic field strengths. In PCASL, a train of short slice-selective RF pulses are applied at a proximal tagging location together with a non-zero mean gradient, so that the flowing spins experience a linear frequency sweep and undergo inversion when moving through the tagging slab. Assuming a homogenous magnetic field, the phase of each RF pulse in the train is incremented by a constant amount to maintain coherence with the flowing spins under the non-zero mean gradient. Unfortunately, the assumption of field homogeneity is often not satisfied at high magnetic field such as 7T (20). This results in a loss of tagging efficiency, and thus, perfusion images with reduced SNR.
The loss in PCASL tagging efficiency at 3T due to off-resonance effects can be mitigated by several methods. In multi-phase PCASL (MP-PCASL), images are acquired with different RF phase increments applied to the tagging pulse train, and an ideal simulated signal response curve is fitted to the data to estimate the perfusion signal level (21). However, since the simulated signal response curve is based on an average blood velocity profile, the true signal response may deviate from the simulated model depending on the actual flow velocity range of tagged blood. In addition, since this method is not dependent on traditional pair-wise subtraction and averaging of tag and control data acquired at consecutive TR periods, any slow baseline drift of data acquired with different phase increments could cause errors when fitting to the ideal signal model. The second method calculates a corrected labeling efficiency using the ratio of two PACSL images acquired with different RF phase increments applied to the PCASL pulse trains (22). This method also relies upon a theoretical calibration curve generated using an average flow velocity profile over the cardiac cycle. Since this method acquires complete perfusion data corresponding to 3 or 4 RF phase increments, it can be time-consuming. Another approach is to directly measure the off-resonance field and the gradient within the tagging slab and adjusting the RF phase and mean gradients in the PCASL train accordingly to compensate for the off-resonance fields (23). This approach is appealing and has the advantage of not being dependent on an assumed flow profile. However, application of this method at 7T can be challenging because of signal drop-off due to T2* effects in some regions within the tagging slab required to acquire whole brain perfusion data.
Here we provide a detailed account of an alternative approach to robustly estimate and compensate PCASL off-resonance effects at 7T without requiring a simulated signal model and with the same insensitivity to baseline drift as traditional ASL using pair-wise acquisition. In this approach a ‘Prescan’ procedure is used to first estimate the RF phase increment and in-plane gradients required to compensate for the off-resonance effects at each tagging vessel location (24). The PCASL Prescan data are acquired with high SNR from low-resolution images using a relatively short post labeling delay (PLD) in about 1–2 minutes. Then PCASL perfusion data are acquired with the appropriate RF pulse phase-increment applied to the tagging pulse train along with additional X and Y gradients (Gx/Gy) to correct for off-resonance effects at the tagging locations. We show that this Prescan approach can be used to acquire high quality PCASL perfusion data of the human brain at 7T.
MATERIALS AND METHODS
PCASL Prescan with Pair-wise Phase Offsets
In conventional PCASL, a train of short RF pulses is applied at the labeling location. In tag conditions, a phase increment φ, equal to the phase accumulated between two consecutive RF pulses under the non-zero mean gradient, is added to each RF pulse if the labeling plane is not at system iso-center (17,19). In control conditions, the RF and gradient waveforms are identical as in tag conditions except that an additional π phase shift is added to every other RF pulse (17,21).
For 7T whole brain studies, however, the phase increment φ is often not adequate due to B0 inhomogeneity, especially for tagging locations below the brain. In the proposed scheme, a short ‘Prescan’ is performed to determine the actual phase increment required. During the Prescan, paired tag-control data are acquired with an extra phase θ, equal to a fraction of 2π, added to the phase increment φ as shown in Fig. 1a. The extra phase θ is advanced for successive tag-control pairs in 8 or 16 equal steps to cover a 2π phase cycle. If a total of 8 phases over 2π is sampled, a minimum of 16 TRs plus time for dummy scans will be required for Prescan data acquisition. The acquisition of tag-control pairs allows pair-wise subtraction to minimize slow baseline drift due to respiratory chest movement as often observed at 7T (25). Moreover, pair-wise subtracted Prescan signal follows a sinusoidal function with zero symmetry in signal amplitude as a function of the added phase θ, and thus allows robust estimation of the actual phase increment required to compensate for field inhomogeneity effects (see below).
FIG. 1.

(a) PCASL Prescan RF and Z gradient pulse trains for tag (top) and control (bottom) conditions. In addition to the phase increment φ applied to each RF pulse in the pulse trains, PCASL Prescans are acquired with an extra phase θi, which is a fraction of 2π, added to the tag and control pulse trains where i is the index number of tag-control pairs and N is the number of phase steps. (b) Additional Gx/Gy pulse trains for off-resonance compensation during subsequent PCASL scans.
Additionally, low-resolution images with a short PLD are used to maximize the SNR of the Prescan so that off-resonance effects can be estimated accurately with the shortest possible scan time. Since the purpose is to estimate the amount of tagged spins in different perfusion territories, a short PLD, therefore short inversion time, provides high SNR as long as most tagged spins arrive at the imaging voxels even though they may mostly remain intravascular.
Bloch Equation Simulation
The longitudinal magnetization and tagging efficiency of blood spins under the proposed PCASL Prescan procedure was simulated with Bloch equations for the phase θ within -180° to 180° and typical blood velocities from 1 to 50 cm/s at 1 cm/s intervals. Under the assumption of laminar flow, the spin probability density is uniform at any given flow velocity (26). Therefore the average tagging efficiency was calculated as the sum of the individual efficiencies weighted according to the flow velocity. For the simulation, the T2 of arterial blood was assumed to be 50 ms (27) at 7T and the T1 was assumed to be infinite.
Data Acquisition
Imaging was performed on a whole-body 7T GE MRI scanner (GE Healthcare, Milwaukee, WI) with a birdcage transmit coil and a 32-channel receive-only head coil (Nova Medical, Wilmington, MA) on 7 healthy subjects under a protocol approved by the institutional review board. The PCASL labeling pulse train consisted of repetitive Hanning-shaped RF pulses with duration of 800 μs, amplitude of 0.05 G (=33° flip angle), and inter-pulse interval of 1.708 ms. The maximum and mean gradient strengths were 0.8 and 0.06 G/cm, respectively.
The PCASL Prescan was performed with 2500-ms labeling duration and 400-ms PLD, and acquired with gradient-echo EPI of 48×48 matrix size for 24-cm FOV. Two 10-mm thick axial slices with 6-mm gap were acquired through the lateral ventricles. The values used for the PLD and the labeling duration were optimized for 7T using the General Kinetic Model (28). A total of 8 or 16 phases after 4 dummy volumes were acquired with 3-s TR for a scan time of 1 min or 1 min 48 s, respectively.
A phase contrast coronal image was obtained with the following parameters to determine the tagging location: 7-cm slice thickness, 192×160 matrix size, 24-cm FOV, TE/TR=5.5/50 ms, 20° flip angle, 60-cm/s velocity encoding and flow-compensation gradients. The tagging plane was positioned near the base of the cerebellum where the internal carotids and vertebral arteries are relatively straight and parallel to the slice direction (21). In the subjects studied, the center of the tagging slab was 78–90 cm inferior to the center of the imaging slices.
The spatial locations of the tagged left/right carotids and the vertebral arteries relative to the iso-center were measured from axial phase contrast, flow sensitive images acquired at the tagging location with a 4-mm slice thickness, 20° flip angle, TE/TR=6/50 ms, 192×160 matrix size, 16-cm FOV, NEX=2, 1-min 5-s scan time and a flow encoding velocity of 60 cm/s.
PCASL Prescan data were immediately transferred offline and analyzed with custom scripts using MATLAB software, version 7.9 (The MathWorks, Natick, MA). Based on pair-wise subtracted images, three regions of interests (ROIs) consisting of the perfusion territories of left and right carotids and the vertebral arteries were defined manually. The average signal in each ROI was extracted as a function of the phase θ and fitted to a cosine function to determine the optimum phase offsets, θm, that provided maximum perfusion signal for each of the three territories. Using the θm phase offsets and the corresponding locations of the tagged arteries, a single phase value, θc, and additional Gx/Gy (as shown in Fig. 1b) were calculated to simultaneously compensate for off-resonance effects for all vessels (17,29). The single phase θc and the gradient areas Ax/Ay for the additional Gx/Gy were derived by solving the following three linear equations:
| [1] |
where γ is the gyromagnetic ratio, (XL, YL)/(XR, YR) are the spatial coordinates of the left/right carotids, (XV, YV) are the mean spatial coordinates of the left/right vertebral arteries, and θmL/θmR/θmV are the estimated phase offsets from each of the perfusion territories. The sign of each spatial coordinate and the polarity of Gx/Gy were determined empirically as they may vary with scanner manufacturers. To further simplify the calculation, YL and YR were set equal to the mean Y coordinate of the left/right carotids and XV was set to zero in most cases. The calculated phase θc and Gx/Gy values were then applied to the subsequent PCASL scans to acquire data with off-resonance compensation.
In order to verify that the perfusion signals from all three territories were maximized at the same phase θ value after applying the compensation Gx/Gy, a second Prescan was performed with only the additional Gx/Gy applied to the PCASL pulse train. The mean phase difference (Δθm) between all three flow territories was calculated by taking the average of the difference of phase estimates between any two flow territories, i.e. between left and right carotids, between left carotid and vertebral artery, and between right carotid and vertebral artery territories. A paired t-test was performed between the Δθm before and after applying the additional Gx/Gy.
To estimate and verify the stability of phase offset measurements over a long period of time, an extra 5-min long PCASL Prescan with repeated 16 phase steps was acquired for each subject. The Prescan procedure assumes that the early estimates of phase offsets θm remain stable for the subsequent PCASL scans. The same cosine fitting procedure was applied for every 16 consecutive subtracted signals in each perfusion territory using a sliding window over the 48 subtracted pairs excluding the first 4 dummy volumes. This resulted in 33 possible fitted estimates of θm. The mean and standard deviation of the derived optimum phase offsets over the 5-min scan were calculated and averaged across all subjects. To estimate the stability using 8 phase steps, every other subtracted signal was fitted in a similar fashion.
To compare the PCASL perfusion images before and after applying the PCASL Prescan procedure, whole-brain 7T PCASL scans were acquired with the following parameters with and without RF phase offset θc and the additional Gx/Gy: 3-s labeling duration, 1.2-s PLD, TE/TR=18.4/5000 ms, 20 axial slices of 3-mm thick, 1-mm gap, 64×64 matrix size, 22.4-cm FOV, ASSET acceleration factor=2 and 4-min 10-s scan time. In addition, high spatial resolution PCASL images of 20 axial slices were also obtained with voxel sizes 1.5×1.5×3 mm3, TE/TR = 19.8/5350 ms, ASSET acceleration factor=4 and a scan time of 7 min and 8 s.
RESULTS
Figures 2a and 2b show the longitudinal magnetization of flowing blood immediately after application of tag and control PCASL pulse trains as a function of the extra phase offset θ in the absence of field inhomogeneity. As designed, the blood magnetization following the tagging pulse train is inverted when the extra phase offset θ is zero, and loses inversion efficiency as θ deviates from zero. The blood magnetization is unaffected by the tagging pulse train when θ is close to ±180°. The opposite behavior is observed following the control pulse train with the magnetization unaffected near zero phase offset and inverted when θ is ±180° (Fig. 2b). Figure 2c shows the tagging efficiency of blood obtained by subtraction of the magnetization states following the control and tagging pulse trains. The inversion efficiency is highest when θ is zero and decreases rapidly with increase in θ. Although the rate of change of inversion efficiency with θ varies with the spin velocity, there are two symmetrical null-crossing points independent of spin velocity around θ equal to ±90°. Figures 2d and 2e show the corresponding magnetization profiles for tag and control pulse trains assuming laminar flow in the tagging arteries. Figure 2f shows the resultant laminar flow tagging efficiency curves (black line) in the absence of off-resonance effects as well as in the presence of 100-Hz field inhomogeneity (green line). In the absence of field inhomogeneity the tagging efficiency is maximum at zero phase, while in the presence of 100-Hz field inhomogeneity, the tagging efficiency is maximized at a θ value equal to 61.5°. In general, the tagging efficiency as a function of θ is symmetrical in amplitude and phase and, therefore, can be easily fitted to a simple cosine function (dashed red line in Fig. 2f) to robustly estimate the phase θ that should be applied to the PCASL pulse trains to achieve maximum efficiency. It should be noted that each tagged vessel, i.e. perfusion territory, will have a different optimum θm based on the off-resonance field at the corresponding tag location.
FIG. 2.

Bloch equation simulation results for longitudinal magnetization of spins flowing at 5, 20, 35 and 50 cm/s (top row) after application of PCASL pulse trains as a function of phase offset θ for (a) tag, and (b) control conditions, and (c) subtracted (control-tag) signal. Average longitudinal magnetization assuming laminar flow with maximum velocity at 50 cm/s, for (d) tag and (e) control conditions, and (f) subtracted (control-tag) signal. All data, except the green/red line in (f), were calculated assuming a homogenous field. Solid green line in (f) represents the tagging efficiency for off-resonance field of 100 Hz at the tagging location and the dashed red line is the fit to a cosine function to determine the phase offset.
Figure 3a shows a series of low-resolution, pair-wise subtracted 7T PCASL Prescan images acquired at different phase offsets θ, before and after applying off-resonance compensation Gx/Gy. It can be seen that, when θ is zero, the perfusion signal is very low and negative due to uncompensated off-resonance effects during the PCASL pulse train. Further, the images in the top row indicate that the perfusion signal in the vertebral artery territory is maximized at a different phase offset (~ −90°) compared to that of the carotid territories (~ between −90° and −135°). This is due to the fact that off-resonance fields at the tagged locations of vertebral and carotid arteries are different. The images in bottom row show that, with the addition of appropriate compensation Gx/Gy, the perfusion signals from all three territories could be maximized around the same phase θ (~ between −135° and −180°). Figures 3b and 3c show the average signal from each ROI from the three perfusion territories and the fitted curves before and after applying extra Gx/Gy. Fitted curves confirm that the signal from each perfusion territory is maximized at a different phase θ without field compensation gradients, and after correction, all three territories have similar phase offsets (Fig. 3d). In this particular example, the complete correction of off-resonance effects required the addition of an RF phase offset, θc, of −150° to the PCASL pulse train and applying additional Gx/Gy in between the pulses.
FIG. 3.

(a) PCASL Prescan images of an example slice after pair-wise subtraction acquired at different phase offset θ before (top left row) and after (bottom left row) applying additional Gx/Gy for off-resonance compensation. The raw EPI image (top right) and ROI masks (bottom right) are shown on the right. (b) Average signal and fitted cosine curves from the left, right and bottom perfusion territories (b) before and (c) after applying additional Gx/Gy for off-resonance compensation, and (d) optimum phase offsets θm before and after applying the compensation gradients. θc is the calculated compensation phase offset (circle).
The phase estimates from all three flow territories of the 7 subjects ranged from −143° to 83° before compensation, indicating the severity of off-resonance effects at 7T. The average Δθm values for the 7 subjects were 23.3±13.4° and 8.2±2.2° before and after off-resonance compensation, respectively, and were significantly different as determined by the paired t-test (P = 0.027 < 0.05).
Figure 4a shows the mean perfusion signal from each perfusion territory during a 5-min PCASL Prescan with 16 phase steps covering 2π. Fig 4b shows the phase offsets that maximize the perfusion signal (θm) found by fitting every 16 consecutive subtracted signals. The mean and standard deviation (SD) of the phase estimate over the 5-min scan for this example subject were −82.3±3.5°, −104.4±1.7° and −119.0±1.8° for left/right carotid and vertebral territories, respectively. The mean SD (n=7) were 1.9±1.6°, 1.7±0.5° and 2.5±1.2° for left/right carotid and vertebral artery territories, respectively. The mean SD of 8 steps estimated by taking every other data points were 2.8±1.4°, 2.8 ±1.2° and 5.0±2.3° for left/right carotid and vertebral territories, respectively. No significant difference was found between the mean phase estimates using 8 and 16 phases revealed by a paired t-test (P = 0.29). This data indicate that the estimates of θm are stable over time and can be determined with reasonable accuracy in a short time using 8 or 16 steps of phase θ covering 2π.
FIG. 4.

(a) Average PCASL Prescan signal from the three perfusion territories after pair-wise subtraction for a 5-min scan from one of the subjects. (b) Optimum phase offsets θm fitted for every 16 consecutive subtracted signal with a sliding window for each perfusion territory.
Figure 5 shows whole-brain 7T PCASL perfusion images acquired with a voxel size of 3.5×3.5×3 mm3 from a volunteer before and after correcting for off-resonance effects. It can be seen that, without correction for off-resonance effects, significantly lower perfusion signal is observed in the left hemisphere compared to other regions. Compensation of off-resonance effects using the RF phase and gradient offsets determined by the proposed Prescan procedure generated perfusion images with good sensitivity throughout the brain. Figure 6 shows one slice of the whole-brain PCASL perfusion images from each of the 7 subjects before and after off-resonance compensation. Asymmetric ASL signal, thus tagging efficiency, is often observed between the left and the right perfusion territories and between the carotid and the vertebral perfusion territories. All subjects showed significant improvement in PCASL perfusion signal after correction for off-resonance effects at the tagging location. This data shows that the proposed Prescan is an effective general approach to compensate off-resonance effects.
FIG. 5.

7T PCASL whole-brain images from an example subject before (left) and after (right) correcting for off-resonance effects.
FIG. 6.

7T PCASL images of one slice from each of the 7 subjects before (top row) and after (bottom row) correcting for off-resonance effects.
Figure 7 shows 7T PCASL perfusion images of a volunteer with a voxel size of 1.5×1.5×3 mm3 acquired in about 7 minutes. Images shown were pair-wise subtracted and averaged after rigid body alignment without further masking or post-processing. These data show that high quality and high SNR perfusion images can be readily obtained at 7T by using phase and gradient offsets determined through a PCASL Prescan.
FIG. 7.
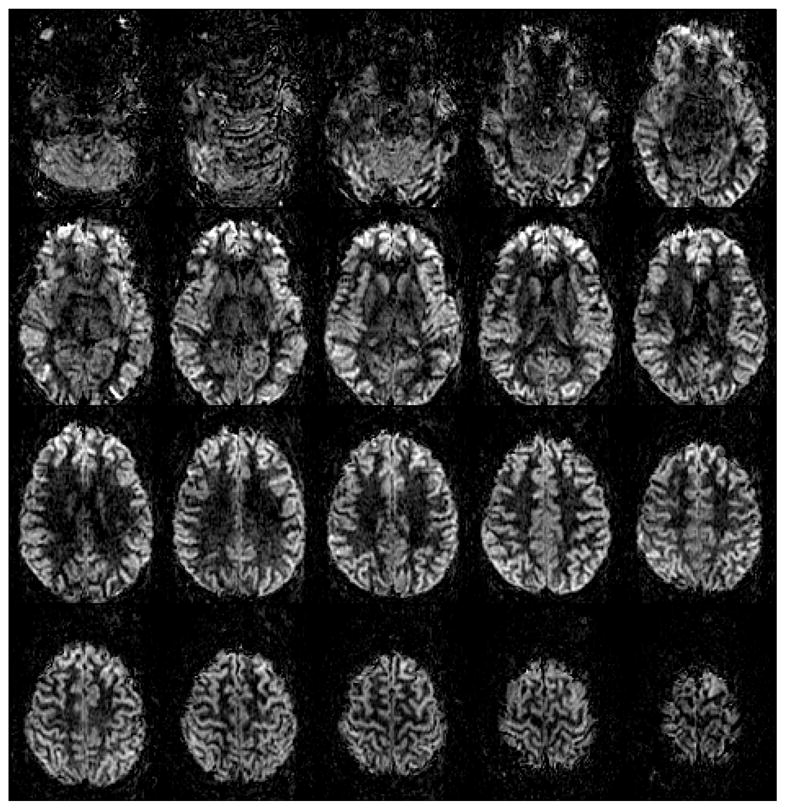
7T PCASL perfusion images acquired with voxel size of 1.5×1.5×3 mm3 and TE/TR = 19.8/5350 ms with ASSET acceleration factor=4 and 7-min 8-s scan time.
DISCUSSION
PCASL is an attractive technique for perfusion MRI on commercial scanners since no special hardware is required and long tag durations can be achieved to realize the additional SNR increase at high field strength from longer blood T1. However, it is sensitive to the inhomogeneity of the B0 magnetic field because, to achieve adiabatic inversion, it relies on maintaining the phase coherence between the tagging RF and the magnetization of flowing spins. At 3T, typical high-order shimming over the whole brain is sufficient to produce good quality PCASL images on most subjects in our laboratory. However, at 7T, even with whole brain high-order shimming available on the scanner, the magnetic field offset at the tagging location can be significant. This results in a significant loss of tagging efficiency and produces poor quality perfusion images in most cases. Therefore, it is necessary to correct for off-resonance effects in PCASL to elicit superior SNR advantage at 7T. Here we have proposed and demonstrated a simple, fast and robust Prescan procedure that can be easily implemented to compensate for off-resonance effects and that will enable high quality perfusion imaging at 7T routinely. We have demonstrated that excellent, high-resolution, 7T PCASL perfusion images of the human brain can be acquired using this method.
The Prescan procedure is based on acquisition of a series of low-resolution PCASL tag/control images with different phase offsets applied to the tagging RF train. These images are processed to determine the correct combination of RF phase and gradient offsets required to simultaneously compensate for off-resonance effects at all vessel tagging locations. This approach takes advantage of the periodic and symmetrical properties of tagging efficiency modulation to easily estimate the phase offsets that maximize the signal in each perfusion territory. Acquisition of Prescan data with a large voxel size and utilization of the intravascular signal by using a short PLD provide sufficient SNR for quick and accurate determination of phase offsets within 1 to 2 minutes. It should be straightforward to automate and streamline this procedure.
It should be noted that the proposed Prescan method does not depend strongly on the assumption and measurement of velocity profiles in the tagging vessels. This is in contrast to the previous methods that rely upon a tagging efficiency response curve derived from simulation (21) or from measured velocity profiles (22). From the Bloch equation simulations as shown in Fig. 2, it can be seen that the amplitude and the curvature of the tagging efficiency response as a function of phase offset does vary with the composition of blood velocity such as during the cardiac cycle and among different individuals. However, the simulations show that the symmetry in amplitude and phase of the tagging efficiency curve is mostly preserved and allows for data fitting with a simple cosine function. Since it is the fitted phase of the tagging efficiency curve that is of interest, changes in the fitted amplitude due to different velocity composition do not affect the results. This is evident with the stability of the phase offset estimates over a period of 5 minutes. Long term stability of phase estimates is required for the success of methods employing prescan strategies.
In the current method, the off-resonance effects at all tagged vessels were compensated simultaneously by applying a phase shift to the RF pulse train and by adding in-plane Gx/Gy gradients. The off-resonance field was not explicitly compensated for but was made similar at all tagging vessels by the Gx/Gy gradients so that maximum possible signal can be obtained with a single phase offset to the tagging RF pulses. Since the optimum phase offsets were measured experimentally, the applied RF phase offset should account for both the linear phase term and the phase errors due to off-resonance gradient along the Z axis (23) averaged over the actual velocity range. Our data also indicate that the correction schemes applied only to the whole tagging slab is not sufficient at 7T since different vessels exhibit different tagging efficiencies. However, since only X and Y gradients are available to compensate for the difference in off-resonance effects among the four main tagged vessels, the correction scheme used here will be compromised for individuals with vessel locations highly asymmetric in the axial plane.
It is possible to reduce PCASL sensitivity to off-resonance effects by shortening the inter-pulse interval of the pulse train. This can be achieved with the latest commercial scanner hardware. However, in most cases, the degree of off-resonance typically encountered at 7T is large enough that compensation of off-resonance effects will still be necessary. The range of measured off-resonance phase in this study at 7T was −143° to 83°, equivalent to −233 to 135 Hz (assuming no 2π phase wrap). In comparison, the off-resonance phase in the previous studies at 3T ranged from approximately −50° to −25°, equivalent to −84 to −42 Hz (21), and from −35° to 30°, equivalent to −106 to 91 Hz (22). Even if the inter-pulse interval is reduced by half, the off-resonance correction will still be required at 7T since the tagging efficiency reduces to about 50% for phase offsets at ±45°. In addition, the use of a shorter RF pulse interval may lead to increased SAR, thus limiting the use of such an approach at 7T.
Another source of lower tagging efficiency at 7T is lower B1 at the tagging location when using a head-size RF excitation coil. Preliminary data indicate that lower B1 may result in as much as 20% reduction in the perfusion signal (20). To mitigate this problem, it should be possible to employ a strategy to determine the required RF amplitude as part of the PCASL Prescan procedure. The increase in SAR can be mitigated with the application of variable-rate selective-excitation (VERSE) RF pulses (30).
In the current implementation, the ROIs of flow territories were manually selected. In most cases, this was straightforward since the ASL signal intensity difference among flow territories across different phase offsets could be easily recognized. It should also be possible to automate the ROI selection to improve the data processing speed.
Although off-resonance compensation using a Prescan is generally not required at lower fields such as 3T, it may prove useful for applications involving tagging in the neck area since B0 becomes less homogeneous away from iso-center. Use of the Prescan procedure may also help to reduce inter-subject variations in perfusion at lower field strengths by compensating any residual inhomogeneity that maybe present after shimming. In addition, differences in perfusion signals across territories that arise from field inhomogeneity induced tagging efficiency differences could also be corrected using the Prescan procedure demonstrated in this study.
In conclusion, magnetic field inhomogeneity at the tagging vessels is detrimental to PCASL tagging efficiency at 7T. Using the PCASL Prescan method to sample the phase offsets in a pair-wise fashion by observing the ASL signal of different perfusion territories with large voxels and short PLD, the proper phase offsets can be determined robustly in 1–2 minutes. With the extra Gx/Gy to compensate for the magnetic field inhomogeneity at the tagging vessels, high quality PCASL images can be successfully obtained at 7T.
Acknowledgments
The authors would like to thank Drs. Eric Wong, Thomas Liu, and Youngkyoo Jung at UCSD for helpful discussion and Dr. Vinai Roopchansingh at NIMH for streamlining real-time data transfer from the scanner. This research was supported by the Intramural Research Program of NIMH and NINDS.
References
- 1.Detre JA, Wang J, Wang Z, Rao H. Arterial spin-labeled perfusion MRI in basic and clinical neuroscience. Curr Opin Neurol. 2009;22(4):348–355. doi: 10.1097/WCO.0b013e32832d9505. [DOI] [PubMed] [Google Scholar]
- 2.Petersen ET, Mouridsen K, Golay X. The QUASAR reproducibility study, Part II: Results from a multi-center Arterial Spin Labeling test-retest study. Neuroimage. 2010;49(1):104–113. doi: 10.1016/j.neuroimage.2009.07.068. [DOI] [PMC free article] [PubMed] [Google Scholar]
- 3.Luh WM, Wong EC, Bandettini PA. How Long to Tag? Optimal Tag Duration for Arterial Spin Labeling at 1.5T, 3T, and 7T. Proceedings of the 16th Annual Meeting of ISMRM; Toronto, Canada. 2008. p. 186. [Google Scholar]
- 4.Edelman RR, Siewert B, Darby DG, Thangaraj V, Nobre AC, Mesulam MM, Warach S. Qualitative Mapping of Cerebral Blood-Flow and Functional Localization with Echo-Planar Mr-Imaging and Signal Targeting with Alternating Radio-Frequency. Radiology. 1994;192(2):513–520. doi: 10.1148/radiology.192.2.8029425. [DOI] [PubMed] [Google Scholar]
- 5.Kwong KK, Chesler DA, Weisskoff RM, Donahue KM, Davis TL, Ostergaard L, Campbell TA, Rosen BR. MR Perfusion Studies with T1-Weighted Echo-Planar Imaging. Magnetic Resonance in Medicine. 1995;34(6):878–887. doi: 10.1002/mrm.1910340613. [DOI] [PubMed] [Google Scholar]
- 6.Kim SG. Quantification of Relative Cerebral Blood-Flow Change by Flow-Sensitive Alternating Inversion-Recovery (Fair) Technique - Application to Functional Mapping. Magnetic Resonance in Medicine. 1995;34(3):293–301. doi: 10.1002/mrm.1910340303. [DOI] [PubMed] [Google Scholar]
- 7.Wong EC, Buxton RB, Frank LR. Implementation of quantitative perfusion imaging techniques for functional brain mapping using pulsed arterial spin labeling. NMR in Biomedicine. 1997;10(4–5):237–249. doi: 10.1002/(sici)1099-1492(199706/08)10:4/5<237::aid-nbm475>3.0.co;2-x. [DOI] [PubMed] [Google Scholar]
- 8.Detre JA, Leigh JS, Williams DS, Koretsky AP. Perfusion imaging. Magn Reson Med. 1992;23(1):37–45. doi: 10.1002/mrm.1910230106. [DOI] [PubMed] [Google Scholar]
- 9.Williams DS, Detre JA, Leigh JS, Koretsky AP. Magnetic resonance imaging of perfusion using spin inversion of arterial water. Proc Natl Acad Sci U S A. 1992;89(1):212–216. doi: 10.1073/pnas.89.1.212. [DOI] [PMC free article] [PubMed] [Google Scholar]
- 10.Alsop DC, Detre JA. Reduced transit-time sensitivity in noninvasive magnetic resonance imaging of human cerebral blood flow. Journal of Cerebral Blood Flow and Metabolism. 1996;16(6):1236–1249. doi: 10.1097/00004647-199611000-00019. [DOI] [PubMed] [Google Scholar]
- 11.Alsop DC, Detre JA. Multisection cerebral blood flow MR imaging with continuous arterial spin labeling. Radiology. 1998;208(2):410–416. doi: 10.1148/radiology.208.2.9680569. [DOI] [PubMed] [Google Scholar]
- 12.Wong EC, Buxton RB, Frank LR. Quantitative imaging of perfusion using a single subtraction (QUIPSS and QUIPSS II) Magnetic Resonance in Medicine. 1998;39(5):702–708. doi: 10.1002/mrm.1910390506. [DOI] [PubMed] [Google Scholar]
- 13.Dixon WT, Du LN, Faul DD, Gado M, Rossnick S. Projection angiograms of blood labeled by adiabatic fast passage. Magn Reson Med. 1986;3(3):454–462. doi: 10.1002/mrm.1910030311. [DOI] [PubMed] [Google Scholar]
- 14.Luh WM, Bodurka J, Bandettini PA. Cardiac Phase Related Limitation on Lower Brain Perfusion Measurements Using Quantitative Pulsed Arterial Spin Labeling. Proceedings of the 12th Annual Meeting of Human Brian Mapping; Florence, Italy. 2006. p. 262. TH-PM. [Google Scholar]
- 15.Talagala SL, Ye FQ, Ledden PJ, Chesnick S. Whole-brain 3D perfusion MRI at 3. 0 T using CASL with a separate labeling coil. Magn Reson Med. 2004;52(1):131–140. doi: 10.1002/mrm.20124. [DOI] [PubMed] [Google Scholar]
- 16.Talagala SL, Li TQ, Merkle H, Wang S, Bodurka J, Van Gelderen P, Duyn J. Comparison of Continuous Arterial Spin Labeling Perfusion MRI at 7T and 3T. Proceedings of the 16th Annual Meeting of ISMRM; Toronto, Canada. 2008. p. 1916. [Google Scholar]
- 17.Wong EC. Vessel-encoded arterial spin-labeling using pseudocontinuous tagging. Magn Reson Med. 2007;58(6):1086–1091. doi: 10.1002/mrm.21293. [DOI] [PubMed] [Google Scholar]
- 18.Wu WC, Fernandez-Seara M, Detre JA, Wehrli FW, Wang J. A theoretical and experimental investigation of the tagging efficiency of pseudocontinuous arterial spin labeling. Magn Reson Med. 2007;58(5):1020–1027. doi: 10.1002/mrm.21403. [DOI] [PubMed] [Google Scholar]
- 19.Dai W, Garcia D, de Bazelaire C, Alsop DC. Continuous flow-driven inversion for arterial spin labeling using pulsed radio frequency and gradient fields. Magn Reson Med. 2008;60(6):1488–1497. doi: 10.1002/mrm.21790. [DOI] [PMC free article] [PubMed] [Google Scholar]
- 20.Luh WM, Li TQ, Wong EC, Bandettini PA. Pseudo-Continuous Arterial Spin Labeling at 7T. Proceedings of the 16th Annual Meeting of ISMRM; Toronto, Canada. 2008. p. 3339. [Google Scholar]
- 21.Jung Y, Wong EC, Liu TT. Multiphase pseudocontinuous arterial spin labeling (MP-PCASL) for robust quantification of cerebral blood flow. Magn Reson Med. 2010;64(3):799–810. doi: 10.1002/mrm.22465. [DOI] [PubMed] [Google Scholar]
- 22.Wu WC, Jiang SF, Yang SC, Lien SH. Pseudocontinuous arterial spin labeling perfusion magnetic resonance imaging--a normative study of reproducibility in the human brain. Neuroimage. 2011;56(3):1244–1250. doi: 10.1016/j.neuroimage.2011.02.080. [DOI] [PubMed] [Google Scholar]
- 23.Jahanian H, Noll DC, Hernandez-Garcia L. B(0) field inhomogeneity considerations in pseudo-continuous arterial spin labeling (pCASL): effects on tagging efficiency and correction strategy. NMR in biomedicine. 2011;24(10):1202–1209. doi: 10.1002/nbm.1675. [DOI] [PubMed] [Google Scholar]
- 24.Luh WM, Talagala SL, Bandettini PA. Robust Prescan for Pseudo-Continuous Arterial Spin Labeling at 7T: Estimation and Correction for Off-Resonance Effects. Proceedings of the 18th Annual Meeting of ISMRM; Stockholm, Sweden. 2010. p. 520. [Google Scholar]
- 25.van Gelderen P, de Zwart JA, Starewicz P, Hinks RS, Duyn JH. Real-time shimming to compensate for respiration-induced B0 fluctuations. Magn Reson Med. 2007;57(2):362–368. doi: 10.1002/mrm.21136. [DOI] [PubMed] [Google Scholar]
- 26.Maccotta L, Detre JA, Alsop DC. The efficiency of adiabatic inversion for perfusion imaging by arterial spin labeling. NMR in biomedicine. 1997;10(4–5):216–221. doi: 10.1002/(sici)1099-1492(199706/08)10:4/5<216::aid-nbm468>3.0.co;2-u. [DOI] [PubMed] [Google Scholar]
- 27.Ogawa S, Menon RS, Tank DW, Kim SG, Merkle H, Ellermann JM, Ugurbil K. Functional Brain Mapping by Blood Oxygenation Level-Dependent Contrast Magnetic-Resonance-Imaging - a Comparison of Signal Characteristics with a Biophysical Model. Biophysical Journal. 1993;64(3):803–812. doi: 10.1016/S0006-3495(93)81441-3. [DOI] [PMC free article] [PubMed] [Google Scholar]
- 28.Buxton RB, Frank LR, Wong EC, Siewert B, Warach S, Edelman RR. A general kinetic model for quantitative perfusion imaging with arterial spin labeling. Magnetic Resonance in Medicine. 1998;40(3):383–396. doi: 10.1002/mrm.1910400308. [DOI] [PubMed] [Google Scholar]
- 29.Jung Y, Rack-Gomer AL, Wong EC, Buracas GT, Liu TT. Pseudo-Continuous Arterial Spin Labeling with Optimized Tagging Efficiency for Quantitative ASL fMRI. Proceedings of the 17th Annual Meeting of ISMRM; Honolulu, Hawaii, USA. 2009. p. 1578. [Google Scholar]
- 30.Luh WM, Wong EC, Talagala SL, Bandettini PA. Tagging efficiency improvement using velocity-matched pseudo-continuous arterial spin labeling and VERSE. Proceedings of the 16th Annual Meeting of ISMRM; Toronto, Canada. 2008. p. 3341. [Google Scholar]