

Abstract
Sub-Saharan African children have an increased incidence of Wilms tumor (WT) and experience alarmingly poor outcomes. Although these outcomes are largely due to inadequate therapy, we hypothesized that WT from this region exhibit features of biologic aggressiveness that may warrant broader implementation of high-risk therapeutic protocols. We evaluated 15 Kenyan WT (KWT) for features of aggressive disease (blastemal predominance, Ki67/cellular proliferation) and treatment resistance (anaplasia, p53 immunopositivity). To explore additional biologic features of KWT, we determined the mutational status of the CTNNB1/β-catenin and WT1 genes and performed immunostaining for markers of Wnt pathway activation (β-catenin) and nephronic progenitor cell self-renewal (WT1, CITED1, SIX2). We characterized the proteome of KWT using imaging mass spectrometry (IMS). Results were compared to histology and age-matched North American WT (NAWT) controls. For KWT patients, blastemal predominance was noted in 53.3% and anaplasia in 13%. We detected increased loss to follow up (p=0.028), disease relapse (p=0.044), mortality (p=0.001), and nuclear unrest (p=0.001) in KWT patients compared to controls. KWT and NAWT showed similar Ki67/cellular proliferation. We detected an increased proportion of epithelial nuclear β-catenin in KWT (p=0.013). All 15 KWT were found to harbor wild-type β-catenin, and 1 contained a WT1 nonsense mutation. WT1 was detected by immunostaining in 100% of KWT, CITED1 in 80%, and SIX2 in 80%. IMS revealed a molecular signature unique to KWT that was distinct from NAWT. African WTs appear to express markers of adverse clinical behavior and treatment resistance and may require alternative therapies or implementation of high-risk treatment protocols.
Keywords: Wilms tumor, Kenya, Africa, β-catenin, WT1, Imaging mass spectrometry
Introduction
Wilms tumor (WT) is the most common childhood kidney cancer worldwide, yet its incidence and behavior vary between ethnic groups.1–3 Children residing in resource-constrained regions of sub-Saharan Africa experience high incidence rates of WT and alarmingly dismal outcomes. Compared to 4-year overall survival rates exceeding 90% in developed countries, certain developing nations in sub-Saharan Africa achieve only a 2-year relapse-free survival rate of 35–40%.4–8 Presentation with advanced stages of disease, severe anemia, and acute malnutrition are common among WT patients from this region, complicating adequate treatment and rendering recipients of chemotherapy considerably more vulnerable to treatment toxicities.9 Although much of this poor survival can be attributed to inadequate health care resources and incomplete delivery of standard WT therapies, the contribution of unique biological properties to the high incidence and adverse behavior of WT within these vulnerable populations has not been previously reported.
Several histologic features of WT have been associated with adverse behavior and treatment resistance. Anaplasia (unfavorable histology) is defined by the presence of multipolar mitoses, hyperchromatic nuclei, and nuclear gigantism. Although present in only 5% of WT, anaplasia accounts for half of WT-associated deaths in developed countries.10–12 Anaplasia can be present in all stages of WT and is, therefore, not directly associated with tumor aggressiveness; however, it is strongly associated with treatment resistance.13 In contrast, blastemal predominance in WT has been associated with significant aggressiveness (i.e. advanced stage of disease); however, these tumors are typically responsive to initial therapy.13 Nuclear unrest, or the presence of abnormally large and hyperchromatic nuclei without multipolar mitoses, has been described as a potential intermediate step in the degeneration from favorable to unfavorable histology (anaplasia).14 Nuclear unrest has been observed to appear in WT specimens from disease relapse (in some cases accompanied also by anaplasia), although the direct clinical significance of this observation is unclear.14
Several tumor markers have been identified in WT that associate with adverse clinical disease features. Accumulation of the tumor suppressor gene, p53, in WT specimens has been associated with anaplasia and treatment resistance.15–17 A proliferative index greater than 5% in WT specimens, as defined by percent positive Ki67 staining nuclei, has also been associated with greatly increased disease progression and decreased tumor-specific survival.18
Wilms tumorigenesis stems from dysregulation of pathways critical to normal kidney development. β-catenin, the protein product of the CTNNB1 gene, is involved in cadherin-mediated cell-adhesion and the Wnt signaling pathway. In WT, as in other cancers, nuclear localization of β-catenin has been shown to signify either Wnt pathway activation or stabilizing mutations of β-catenin itself.19,20 β-catenin mutations in cancers cluster at exon 3 of the CTNNB1 gene, which codes for critical amino acid residues that regulate its nuclear localization and transcriptional activity upon phosphorylation.21 Wnt pathway activation and nuclear localization of β-catenin have been implicated as key features of tumorigenesis in a rat nephroblastoma model.22 β-catenin mutations and upregulation of β-catenin target genes have been associated with WT1-mutant WT. Dysregulated β-catenin activation in the context of absent WT1 tumor suppression is thought to represent a critical tumorigenic step in this WT sub-population.23 In WT, CTNNB1 mutations in exons 7 and 8 have been shown to cluster with mutations in the WTX gene, while CTNNB1 mutations in exon 3 cluster with mutations in WT1.24, 25 WTX is an associated protein involved in the Wnt signaling pathway that is responsible for ubiquination and degradation of β-catenin.26 It is estimated that one third of WT possess mutations in WT1, WTX, and/or CTNNB1/β-catenin.27
WTs are postulated to arise from persistence of nephronic progenitor cells, comprising the metanephric mesenchyme (MM) of the embryonic kidney, which have escaped pathways of epithelial differentiation.28 WT1, CITED1, and SIX2 are genes active in the MM that are down-regulated in fated cells undergoing epithelial differentiation.29–32 While the self-renewing component of the MM is defined by CITED1+SIX2+ cells, only SIX2 has been shown to directly regulate self-renewal.31 In late gestation, when the MM has fully differentiated and is no longer present, WT1 expression persists in podocytes and epithelial cells of Bowman’s capsule, while CITED1 and SIX2 are not expressed and remain inactive in the postnatal kidney.33 Loss of heterozygosity (LOH) of WT1 has been identified in a small, but significant, proportion of WT patients and leads to nephrogenic rests, a WT precursor lesion defined as abnormal persistence of nephronic progenitor cells.27, 34 We have published previously that CITED1 remains active in both WT and nephrogenic rests, and associates with advanced stages of disease in favorable histology WT.35 Although SIX2 expression parallels CITED1 closely in development, its expression, tumorigenic, or pathogenic properties in WT have not been reported.
While a number of poor prognostic markers have been characterized in WT, the use of high-throughput proteomic analysis allows for molecular characterization of aggressive tumors or high-risk populations beyond described markers. Matrix Assisted Laser Desorption Ionization Time of Flight (MALDI-TOF) Imaging Mass Spectrometry (IMS) has been shown recently to be an innovative, high-throughput means to analyze the proteome of formalin fixed, paraffin embedded (FFPE) tissues, the only currently available means of tissue preservation in resource-constrained regions of sub-Saharan Africa.36 This tool enables the characterization of high-risk molecular signatures, as well as the potential discovery of novel therapeutic targets. We have recently characterized the proteome of stage and histology matched North American WT tissues using IMS37 and, in the current study, we compare our established signature to that of WT from Sub-Saharan Africa.
Although much of the poor outcome for WT patients residing in resource-constrained regions of sub-Saharan Africa can be attributed to inadequate access to therapy, we hypothesized that WT from these regions show evidence of more biologically aggressive disease, warranting therapy designed for higher-risk categories. In addition, given the high incidence of WT in Africa, we questioned whether these patients exhibit unique disease biology on the proteomic level when compared with North American WT patients.
Materials and Methods
Acquisition of WT specimens and epidemiologic data
A surgical resident in our laboratory traveled to Kenya to query the electronic records of all WT patients treated from January 1, 1992 to July 1, 2010 at a faith-based mission hospital in Kenya. This mission hospital also provides regional pathology services to healthcare facilities in eastern Africa.
60 total WT patients were identified, and 21 had available FFPE tissue specimens. The available patient specimens originated from five different hospitals in this region. Regardless of treating institution, the medical records were absent or incomplete because of patient loss to follow-up in nearly every case. When possible, Children’s Oncology Group (COG) criteria were used to stage patients based on pathologic characteristics and clinical details.10 When complete clinical details were not available, a minimum stage was calculated using COG criteria based on the pathology report alone.
A control group of 20 North American WT (NAWT) patient specimens was assembled from our institutional pathology archives. This control group contained 10 consecutive Black and White patients treated at our institution, respectively. NAWT controls were matched to the KWT specimens in terms of patient age, gender, and percentage of unfavorable histology; however, we could not match the controls exactly stage-for-stage to the KWT specimens because of incomplete clinical data from Africa.
Pathologic Review of Acquired Specimens
A dedicated, board-certified pediatric pathologist reviewed all acquired KWT and NAWT specimens. For KWT, we received 70 total tissue blocks from 21 patients, with 67 tissue blocks requiring deparaffinization and re-embedding. Because of significant tumor necrosis on H&E staining, tissue blocks from 6 patients were excluded from further analysis.
The 15 remaining specimens were reviewed and assessed for integrity of tissue fixation, diagnosis, favorable or unfavorable histology (diffuse anaplasia), triphasic histology, and cellular predominance. No fresh tissue specimens were available for molecular analysis.
Immunohistochemistry
To characterize expression of p53, Ki67, β-catenin, WT1, CITED1, and SIX2 in Kenyan WT, we performed immunoperoxidase staining of the aforementioned 15 FFPE KWT tissues. All samples were subjected to heat-induced epitope retrieval in 10mM citrate buffer. As described previously, 5-μm sections were incubated in affinity-purified rabbit anti-CITED1 (1:50 dilution; Lab Vision Corp., Fremont, CA) or rabbit anti-SIX2 (1:25 dilution; US Biological Corp., Marblehead, MA) for 1 hour at room temperature.35 Goat-anti-rabbit secondary antibody (1:200 dilution; Santa Cruz Biotechnology, Santa Cruz, CA) was applied to tissues at room temperature for 45 minutes. Tissues were visualized with a Vectastain ABC kit (Vector Laboratories, Burlingame, CA). Tissues were similarly incubated in rabbit anti-β-catenin (1:50 dilution; Cell Signaling, Danvers, MA), rabbit anti-WT1 (1:500 dilution; Santa Cruz), or rabbit anti-p53 (1:50 dilution; Cell Signaling) overnight at 4°C. Tissues were then visualized with an anti-rabbit Dako EnVision kit (DakoCytomation; Carpinteria, California). For Ki67, sections were rehydrated and placed in heated Target Retrieval Solution (Labvision, Fremont, CA). Endogenous peroxidase was neutralized with 0.03% hydrogen peroxide followed by a casein-based protein block (DakoCytomation) to minimize nonspecific staining. The sections were incubated with Ki-67 (Catalog #VP-K451, Vector Laboratories) diluted 1:2000 for 60 minutes. The Dako Envision+ HRP/DAB System (DakoCytomation) was used to produce localized, visible staining.
Positive immunostaining was defined as either crisp nuclear or cytoplasmic immunoperoxidase positivity by light microscopy. For Ki67, a marker of cellular proliferation, Photoshop software (Adobe, San Jose, CA) was used to quantify the percent area of immunoperoxidase positivity relative to the total area of nuclei per slide. A proliferative index was estimated and defined as the percent positive staining Ki67 cells averaged over 5 high power fields (400X magnification). Counting of individual Ki67-labeled cells was deemed imprecise due to the inability to distinguish one nucleus from another because of high cellular density in blastemal predominant regions.
Characterization of β-catenin and WT1 mutations in Kenyan Specimens
To characterize the mutational status of β-catenin and WT1 in KWT specimens, we sequenced exons 3, 7, and 8 of CTNNB1 gene and exons 2–10 of WT1 using previously described techniques.20, 25, 38–40 Given the critical importance of phosphorylation residues in CTNNB1 exon 3 on Wnt signaling pathway activation, analysis of exon 3 was conducted using two previously described primer sets.20, 25 All PCR and sequencing primer sequences are available on request and are also included as supplementary data. Briefly, four 10μm paraffin-embedded sections from each KWT specimen were deparaffinized and digested in proteinase K (Qiagen; Germantown, MD) for 12 hours. Genomic DNA was isolated using a QIAamp DNA FFPE tissue kit (Qiagen). From isolated genomic DNA, we amplified the aforementioned exons of the CTNNB1 and WT1 genes using PCR with Taq DNA polymerase (Sigma-Aldrich Corp; St. Louis, MO). PCR products were gel purified using a QIAquick gel extraction kit (Qiagen) and subsequently directly sequenced using BigDye Terminator chemistry (Applied Biosystems; Foster City, CA), resolved on an ABI 3730 DNA Analyzer (Applied Biosystems). Generated sequences and chromatographs were compared to wild-type CTNNB1 and WT1 sequences using the Basic Local Alignment Search Tool (BLAST; NCBI; Bethesda, MD) to determine the mutational status of each specimen. Suspected mutations were confirmed by repeating both the PCR and sequencing reactions. Base pair references are made with respect to sequence NM_001098209.1 for CTNNB1 and NM_000378.4 (Wilms tumor protein isoform A) for WT1.
Imaging Mass Spectrometry
To identify unique biological features of Kenyan WT, we compared the proteome of these specimens to previously characterized ethnic-specific WT signatures.37 Using IMS as previously described,36, 41 we analyzed a single tissue section from each of two distinct specimen blocks from 5 KWT. Two 6μm serial sections from each specimen block were cut, one of which was H&E stained. Photomicrographs of these 6 H&E slides were marked for 300μm diameter histologic regions of interest (Figure 5A). Corresponding tissue sections for mass spectrometry analysis were deparaffinized and subjected to heat-induced antigen retrieval. Coordinates of the histological annotations were transferred to an acoustic robotic microspotter for deposition of trypsin and α-cyano-4-hydroxycinnamic acid matrix(10 mg/ml in 50:49.9:0.1 acetonitrile:water:trifluoroacetic acid) onto corresponding unstained serial sections. Spectra were collected using a Bruker AutoFlex Speed mass spectrometer equipped with a SmartBeam™ laser (Bruker Daltonics, Billerica, MA). Each spectrum was the sum of 1600 laser shots collected throughout the entire area of each matrix spot. The data were preprocessed (baseline subtraction, noise level estimation, and alignment to common peaks). Data were statistically analyzed using ClinPro Tools statistical analysis software package (Bruker Daltonics). Peak picking was performed manually to assure proper peak boundaries and selection of only the monoisotopic peak. Unsupervised clustering and principal component analysis were performed to classify peptide spectra in KWT and NAWT. To control for differences in peptide spectra between histologic compartments, comparisons were made between specific cell compartments only (e.g., blastema versus blastema; Figure 5A). All experiments were completed in duplicate.
Figure 5. Imaging mass spectrometry analysis of Kenyan WT.

(A) Image guided selection of histologic areas of interest in two Kenyan WT (KWT). To control for differences in peptide spectra between histologic compartments, comparisons were made between specific cell compartments only (e.g., blastema versus blastema; stroma versus stroma). (B) Unsupervised hierarchical clustering of peptide spectra from blastema only. Kenyan (K) WT specimens cluster together and separately from North American specimens (B, Black patient; W, White patient; numbers identify duplicate specimens from same patient WT). (C) Principal component displays two peptides detected in the blastemal compartment that distinguish Kenyan from North American WT.
Results
Clinical Features of Wilms tumors
Gender, age at diagnosis, COG stage at presentation, disease-relapse, and vital status are reported for the Kenyan WT patients and compared to NAWT controls in Table 1. For the KWT specimens, obtaining complete patient data was rendered difficult due to incomplete medical records and a majority of patients having been lost to follow-up. Three of 15 KWT patients (20%) received postoperative follow-up and were documented to be alive in the year before this study was initiated (Table 1). There are no known survivors of disease-relapse among the KWT patients. Of those patients who had documented disease-relapse, two are known to be dead, while two others were lost to follow-up and are presumed dead. Using available data, a conservative estimate of survival among KWT patients is 44% and the rate of known disease relapse was 50% (Table 1).
Table 1.
Demographic and histologic features of Kenyan Wilms tumor
| Patient | Race | Sex | Age at Diagnosis (months) |
Stage at Diagnosis |
Disease Relapse |
Vital Status |
Histology | Nuclear Unrest |
Cellular Predominance |
WT1 | CITED1 | SIX2 | β- Catenin exons 3, 7, 8 |
WT1 | Nuclear β- Catenin in Blastema |
Nuclear β-Catenin in Epithelia |
p53 | Estimated Proliferative index: (proportion Ki67 positive) |
|---|---|---|---|---|---|---|---|---|---|---|---|---|---|---|---|---|---|---|
| 1 | B | M | 25 | 3 | No | Alive | FH | − | Triphasic | + | + | + | wt | wt | + | + | + | 63% |
| 2 | B | M | 9 | ≥2 | No | LTF | FH | − | Triphasic | + | + | + | wt | SNP | + | + | − | 66% |
| 3 | B | M | 60 | * | * | * | UH | N/A | Triphasic | + | + | + | wt | wt | − | − | + | 15% |
| 4 | B | M | 36 | * | * | * | FH | − | Triphasic | + | + | + | wt | wt | + | + | + | 11% |
| 5 | B | M | 48 | 3 | Yes | LTF | FH | − | Blastemal | + | + | + | wt | SNP | + | − | − | 4% |
| 6 | B | F | 48 | * | * | * | FH | − | Blastemal | + | + | − | wt | Wt | + | + | − | 17% |
| 7 | B | M | 30 | 2 | Yes | Dead | FH | + | Blastemal | + | + | + | wt | wt | + | + | − | 24% |
| 8 | B | F | 26 | 2 | No | Alive | FH | + | Triphasic | + | − | − | wt | wt | + | + | − | 34% |
| 9 | B | M | 60 | 3 | Yes | LTF | FH | + | Triphasic | + | − | + | wt | wt | − | + | − | 25% |
| 10 | B | M | 24 | 4 | * | Dead | FH | + | Blastemal | + | + | + | wt | MUT | + | + | − | 15% |
| 11 | B | F | * | ≥3 | * | * | FH | + | Blastemal | + | − | + | wt | wt | + | − | + | 10% |
| 12 | B | F | 48 | * | * | * | FH | + | Blastemal | + | + | − | wt | wt | + | + | + | 46% |
| 13 | B | M | * | 3 | Yes | Dead | FH | + | Triphasic | + | + | + | wt | wt | + | − | − | 5% |
| 14 | B | F | 20 | * | * | * | FH | + | Blastemal | + | + | + | wt | wt | + | − | − | 30% |
| 15 | B | F | 54 | ≥3 | No | Alive | UH | N/A | Blastemal | + | + | + | wt | SNP | + | + | + | 59% |
| Summary Kenyan WT | 100% Black | 60% male | Median = 36 mos | - | ≥4 disease relapse | 20% known alive | 13% UH | 61.5% unrest in FH | 53.3% blastemal | 100% | 80% | 80% | 100% wild-type | 6.7% mutant WT1 | 86.7% nuclear | 66.7% nuclear | 40% positive | Mean = 28% |
| Summary North American WT | 50% Black | 55% male | Median = 29 mos | - | 2 disease relapse | 95% known alive | 5% UH | 5.6% unrest in FH | 45% blastemal | N/A | N/A | N/A | N/A | N/A | 95% nuclear | 20% nuclear | 40% positive | Mean = 23% |
| Comparison‡ | N/A | p=1.00 | p=0.2113 | N/A | p=0.044 | p=0.0013 | p=0.565 | P=0.001 | p=0.738 | N/A | N/A | N/A | N/A | N/A | p=0.560 | p=0.013 | p=1.00 | p=0.790 |
Indicates data missing.
Wilcoxon rank sum used for continuous variables, Fisher’s exact test for categorical variables
KWT = Kenyan Wilms Tumor; NAWT = North American Wilms tumor; B = Black; LTF = Lost to follow up; FH = Favorable histology; UH = Unfavorable histology; N/A = not applicable; wt = wild-type; MUT = mutation; SNP = synonymous single nucleotide polymorphism = Minimum stage at presentation (complete data not available)
Staging by COG criteria10
Only 1 of 20 (5%) NAWT patients was lost to follow-up (Table 1). Excluding documented mortalities and unavailable data, we detected significant differences in loss to follow-up (p=0.028) between KWT and NAWT patients (Table 1). Excluding patients for whom clinical details were not available, we detected significant differences in disease relapse (p=0.044) and mortality (p=0.001) between KWT patients and controls (Table 1). No differences were detected in age at diagnosis or gender between groups.
Histologic features of aggressive disease
Of the 15 KWT tumors analyzed, two patients (13%) were determined to have diffuse anaplasia (unfavorable histology) (Figure 1, C–D). Nuclear unrest was present in 8 of 13 (61.5%) favorable histology KWT tumor specimens, but only in 1 of 19 (5.6%) favorable histology NAWT (p=0.001; Figure 1B). Blastemal predominance was present in 8 of 15 WT specimens (53.3%; Figure 1A), a rate that was similar to controls (45%; Table 1).
Figure 1. Favorable and unfavorable histology Kenyan WT.

(A) Favorable histology WT showing monophasic blastemal predominance (400X). (B) Triphasic favorable histology WT with nuclear unrest (400X). (C) WT from Patient #3 shows diffuse anaplasia with hyperchromatic nuclei and nuclear gigantism (600X). (D) WT from patient #15 shows diffuse anaplasia, displaying hallmark multipolar mitoses (arrowhead) and nuclear gigantism (600X). (E) Nuclear detection of p53 in favorable histology triphasic WT (400X). Detection is present in both blastema and epithelia, but not stroma. p53 detection was more sparse and less intense in favorable histology specimens when compared with unfavorable histology. (F) Nuclear p53 detection in unfavorable histology WT from Patient #15 (400X).
Markers of treatment resistance and poor prognosis (p53/Ki67)
Immunoperoxidase staining detected p53 in 40% of KWT (Table 1) and was most intense and extensive in the two unfavorable histology specimens (Figure 1F). p53 was also detected in 4 favorable histology KWT, but was considerably less widespread and intense when compared with unfavorable histology (Table 1; Figure 1E). Due to incomplete clinical outcome data, we were unable to correlate p53 positivity with stage of disease at diagnosis, disease-relapse or last known vital status (Table 1). We did not detect a difference in p53 immunopositivity between KWT specimens and NAWT controls (p=1.00; Table 1).
A proliferative index was estimated by the percent of blastemal or epithelial Ki67 positive cells averaged over 5 high power fields for both KWT specimens and NAWT controls (Table 1). Fourteen of 15 KWT (93%) had estimated proliferative indices > 5%, and 8 of 15 (53%) KWT had estimated proliferative indices > 20% (Table 1). For NAWT, 17 of 20 (85%) of tumors had estimated proliferative indices > 5%, and 12 of 20 (60%) > 20% (Table 1). The mean proliferative index was trivially higher in KWT specimens (0.28) compared to NAWT controls (0.23; p=0.79; Table 1).
β-catenin presence and subcellular localization
All 15 KWT specimens exhibited strong β-catenin immunostaining (Figure 2, Table 1). Nuclear detection of β-catenin was present in 14 of 15 KWT (93%, Table 1) and was present in both favorable and unfavorable histology specimens (Figure 2). In 13 of 15 (86.7%) KWT, nuclear β-catenin was detected in the blastemal compartment. Nuclear β-catenin was detected in the epithelial compartment in 10 of 15 (66.7%) KWT. There was often significant heterogeneity within each tumor specimen, and nuclear positive β-catenin was sometimes limited to very discrete areas of blastema or epithelia (<10% of cells). KWT β-catenin staining, as stratified by favorable histology, nuclear unrest, and unfavorable histology, is shown in Figure 2. No difference was detected in percentage of blastemal nuclear β-catenin between KWT and controls (p=0.560), however a significant difference was detected in epithelial nuclear β-catenin positivity (66.7% KWT nuclear positive, 20.0% NAWT controls; p=0.013; Table 1).
Figure 2. β-catenin expression patterns in Kenyan WT.

(A) β-catenin expression in blastemal and epithelial elements of favorable histology triphasic WT (100X). (B) High power photomicrograph of same specimen shows nuclear detection in blastemal elements and membrane detection in epithelial elements (400X). (C,D) β-catenin expression in two different specimens of favorable histology having nuclear unrest (400X). β-catenin is richly detected in the nucleus of blastema and is mixed between the nucleus and membrane of epithelial elements. (E,F) β-catenin shows rich nuclear expression in blastema of unfavorable histology WT (200X, 400X).
Mutational analysis of CTNNB1 and WT1
Sequencing exons 3, 7, and 8 of the CTNNB1/β-catenin gene revealed wild-type β-catenin in all 15 KWT (Table 1; Figure 3A). Since CTNNB1 and WT1 mutations often cluster in WT, we also performed a mutational analysis of WT1 in these specimens. A single WT contained a homozygous nonsense mutation at position 1244 of exon 7 (Figure 3B), which resulted in a transition from an arginine to a stop codon (p.Arg352X; c.1244 C>T). This mutation was not detected in adjacent areas of normal kidney (Figure 3C). A synonymous single nucleotide polymorphism (SNP; rs2234590) was detected at a single position of exon 6 in 3 specimens (specimens 2, 5, and 15; Table 1): p.Gln336Gln; c.1198 A>G. Additionally, a synonymous SNP (rs16754) was detected in exon 7 of specimen 5 (Table 1): p.Arg352Arg; c.1246 A>G.
Figure 3. Mutational analysis of CTNNB1 and WT1 in Kenyan WT.
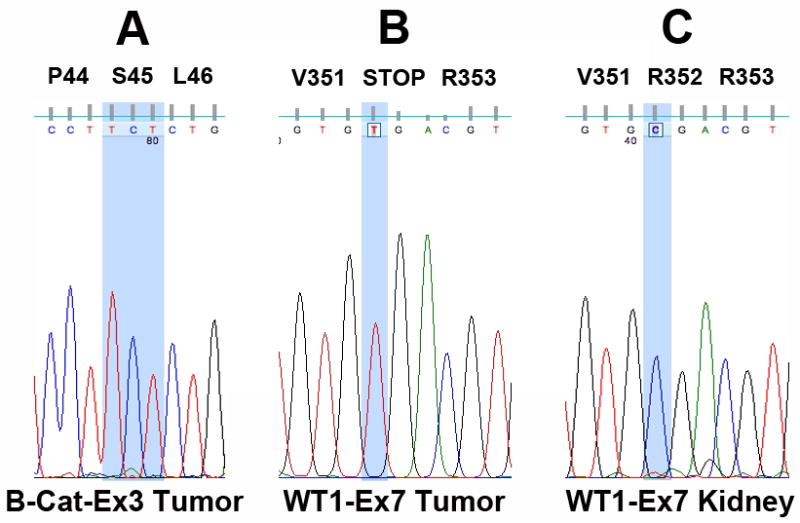
(A) Despite high levels of β-catenin nuclear expression, mutational analysis revealed wild-type β-catenin in all cases at exons 3, 7, and 8. The wild-type sequence coding Serine 45 (S45), a critical phosphorylation residue in exon 3, is highlighted. (B) A single mutation (p.Arg352X; c.1244 C>T) predicted to alter the function of WT1 was detected in specimen 10. The homozygous C to T mutation responsible for conversion of Arginine to a stop codon is highlighted. (C) The wild-type sequence corresponding to (B) was detected in adjacent areas of normal kidney.
Expression of embryonic nephronic progenitor markers
WT1 was detected by immunohistochemistry 100% of KWT (Figure 4A–D). Staining was predominantly nuclear and exclusively in the blastemal and epithelial compartments of tumors (Figure 4A–D). CITED1 was detected in 80% of KWT overall. 66% of tumors showed intense blastemal CITED1 staining, while 47% had epithelial CITED1 staining (Figure 4E–H). CITED1 was detected exclusively in the epithelial compartment of two specimens. Epithelial staining overall was more frequently cytosolic and was less intense than blastemal staining. SIX2 was detected in 80% of KWT specimens, predominantly labeling the blastemal compartment (Figure 4I–L). In 4 of 15 KWT specimens (27%) SIX2 expression was detected in the epithelial compartment of tumors; all tumors with epithelial SIX2 positivity also showed blastemal SIX2 positivity. CITED1 and SIX2 staining patterns overlapped considerably (Figure 4F–L); however, rare circumstances were observed in which blastema expressed CITED1 or SIX2, but not both. A summary of WT1, CITED1, and SIX2 staining in KWT is included in Table 1.
Figure 4. Expression of nephronic progenitor markers in Kenyan WT.

WT1 expression in favorable histology (A,B) and unfavorable histology (C,D) triphasic WT (200X, 400X). CITED1 expression in favorable histology (E,F) and unfavorable histology (G,H) triphasic WT (200X, 400X). SIX2 expression in triphasic WTs with favorable histology (I,J) and unfavorable histology (K,L) (200X, 400X). Serial sections of the same favorable histology (F,J) and unfavorable histology (G,K) WTs show similar expression patterns of CITED1 and SIX2.
Imaging mass spectrometry
Unsupervised hierarchical clustering of KWT and NAWT specimens according to blastemal peptide spectra is shown in Figure 5B. This method clusters tumor specimens based on all peptide peaks collected from the blastemal compartments in each WT sample. The KWT specimens clustered distinctly with one another, yet separately from stage and histology matched North American specimens that were analyzed based on patient race (Figure 5B). Principal component analysis was used to identify pairs of peptide peaks (e.g. 1661 Da and 1762 Da) that revealed distinct separation between KWT and NAWT (Figure 5C). Black NAWT clustered closer to KWT on unsupervised hierarchical clustering (Figure 5B) and marginally closer on principal component analysis (Figure 5C).
Discussion
Our study not only establishes the feasibility of conducting molecular research on WT tissues originating from a resource-constrained region of sub-Saharan Africa, but also highlights the obstacles and limitations of this endeavor. Using available clinical data, immunohistochemistry, DNA sequencing, and imaging mass spectrometry, we were able to preliminarily characterize a unique and aggressive biological phenotype in WT originating from Kenya. Although these Kenyan WTs show many of the classical and typical features associated with this embryonal renal cancer, our findings of disease aggressiveness, treatment resistance, and a distinct molecular signature suggest a unique tumor phenotype in patients native to this region, which may contribute to the high incidence and adverse behavior of WT in sub-Saharan Africa.
To explore molecular features that might contribute to the poor WT outcomes realized in this region of the world, we investigated whether this subset of KWT expressed known features of aggressive biology and treatment resistance. Diffuse anaplasia is detected in approximately 5% of NAWT10 and, notably, was present in 13.3% of KWT analyzed in this study. Anaplasia is more common in older children presenting with WT10, and, indeed, the two Kenyan patients having diffuse anaplasia in our study were among the oldest in the cohort. This observation perhaps implicates diagnostic and treatment delays in the accumulation of aggressive disease features in African WT. The NAWT control group was selected to contain a similar number of unfavorable histology specimens, and thus no fair comparison can be made between these two groups in this regard. Nuclear unrest, previously reported to be present in approximately 15% of WT14, was detected in 61.5% of KWT and 5.6% of NAWT controls in our study. Nuclear unrest has been noted to appear in specimens with disease relapse and is thought to represent an intermediary between favorable and unfavorable histology. Although WTs with nuclear unrest have been noted to exhibit clinical features similar to favorable histology14, the high proportion of this histologic feature in KWT is suggestive of a biological difference between this population and NAWT.
Consistent with previous reports, immunostaining for p53, a marker of unfavorable histology, was intensely detected in the two anaplastic KWT examined.15 We also detected p53 in 4 favorable histology KWT (31% of favorable histology tumors); however, when compared with diffusely anaplastic WTs, p53 positive cells were less frequent and stained less intensely in the favorable histology specimens. Although our finding of p53 accumulation in 31% of favorable histology KWT appears to contradict prior reports, these studies, such as that by Govender et. al., used widespread (>50%) positivity to define p53 accumulation and detected it in only 3 of 86 (3%) favorable histology WT specimens examined.15 Therefore, our results are likely consistent with prior reports. Lahoti, et. al. reported a strong association between p53 immunopositivity and metastatic or recurrent tumors.42 P53 accumulation in WT implies mutation of this protein and potential loss of tumor suppressor function.17,43 We did not detect a difference in p53 expression between KWT specimens and NAWT controls. Our results suggest that unfavorable histology also correlates with p53 mutations in KWT and illustrate that p53 immunostaining is a straightforward application that can be used to identify treatment resistance in this population.
High cellular proliferation is associated with poor prognosis in WT, and Ki67 detection in over 5% of cells has been identified as a marker of disease progression and decreased survival.18 However, that study was conducted on WT specimens having been treated with neoadjuvant chemotherapy and the results suggest that cellular proliferation despite chemotherapy is a poor prognostic indicator. In our study, estimated proliferative index, as determined from percent Ki67 positive cellular area averaged over 5 hpf, was greater than 5% in all but two KWT analyzed. The rate of Ki67 positivity was slightly greater in KWT compared to NAWT controls. Only one patient was pretreated with chemotherapy prior to resection in our control group, however; we do not know the proportion of patients who received neoadjuvant chemotherapy among the KWT patients. Although these KWT appear to express features of high cellular turnover and self-renewal when compared to previous reports, the similar proliferation detected between KWT and NAWT patients in this study emphasizes the importance of determining the patient’s chemotherapy status when interpreting these numbers in WT.
In addition to markers directly linked to adverse clinical disease features, we also aimed to explore dysregulation of developmental pathways linked to Wilms tumorigenesis. In light of all studied KWT containing wild-type β-catenin by DNA sequencing of CTNNB1 exons 3, 7, and 8 (which have previously been associated with WT)20, 24, the intense detection of β-catenin and its propensity for nuclear enrichment in this cohort signify aberrant canonical Wnt signaling by another mechanism. Since CTNNB1 and WT1 mutations often cluster in WT, our rate of 1 in 15 (6.7%) KWT found to have function-altering WT1 mutations supports our findings of wild-type CTNNB1 in these specimens. The SNP rs16754 detected in specimen #5 has been shown to correlate with higher WT1 mRNA expression and may have prognostic significance in pediatric acute myeloid leukemia, however, its role in WT has not been previously studied.44 Furthermore the SNP rs2234590 detected in 3 specimens in the current study has been associated with focal segmental glomerulosclerosis in the African American population.45 All KWT in our study strongly expressed β-catenin, and 93% of tumors showed nuclear localization. Although nuclear positive cells were predominantly located in the blastemal compartment of these KWT, which was not different from NAWT controls, we detected a markedly increased proportion (66.7%) of tumors showing epithelial nuclear β-catenin in KWT specimens. Notably, Koesters et. al detected nuclear β-catenin in 56% of WT examined. One-third of tumors examined in their study showed β-catenin mutations in exon 3, and all of these tumors revealed nuclear localization of β-catenin. However, the majority of tumors having nuclear positive staining harbored wild-type nuclear β-catenin, signifying β-catenin stabilization via canonical Wnt pathway activation.20 They noted nuclear positivity in approximately 5–10% of cells per tumor and only detected nuclear β-catenin in the epithelial compartment of 1/36 tumors. Our results differ from those and also from our control group observations in that we detected nuclear β-catenin in the epithelial compartment of 10/15 Kenyan WT. The high incidence of nuclear β-catenin and its increased frequency of detection in the epithelial compartment of these Kenyan specimens suggest a unique biology related to constitutive Wnt signaling pathway activation.
The African WTs in our study showed widespread expression of WT1, CITED1, and SIX2, factors that label a population of self-renewing nephronic progenitor cells in kidney development. We have shown previously that increased expression of CITED1 in untreated, favorable histology WT correlates with advanced stages of disease.35 The presence of WT1 immunopositivity is found in both WT1 wild-type and mutant tumors.46 The expression of SIX2 in WT often parallels that of CITED1 and provides an additional ontogenic link to the metanephric mesenchyme of the developing kidney.47 Taken together, broad expression of these three genes that label a self-renewing stem cell population in kidney development may also define a population of malignant cells with a stem-like phenotype and the capacity to self-renew or differentiate. These genes and their associated pathways may represent potential future targets for therapies that promote terminal differentiation of WT.
To investigate differences between Kenyan and North American WT beyond these described tumor markers, we utilized imaging mass spectrometry (IMS). We have previously studied proteomic differences in stage and histology matched White and Black patients in a biologic analysis of race disparities in North American WT.48 In the current study, we compared the proteome of 5 Kenyan WT to this previously established signature. Our preliminary IMS results contained herein demonstrate the feasibility of performing a proteomic analysis on FFPE tissues archived in resource-constrained regions of sub-Saharan Africa. Furthermore, unsupervised hierarchical clustering of the total collected blastemal peptide spectra demonstrated distinct separation between KWT and NAWT specimens. Principal component analysis was used to select the two peptide peaks (1661 Da and 1762 Da) that together represent the greatest statistical difference in expression between the KWT and NAWT. Interestingly, North American Black patients clustered closer to Kenyan patients on unsupervised hierarchical clustering and marginally closer by principal component analysis. We can only speculate on the reason for this phenomenon; however, it may represent ethnic-specific biology in the development of Wilms tumor that is conserved among patients of Black African heritage. Future areas for investigation include validating these signatures in larger patient groups and sequencing peptides that are uniquely expressed or downregulated in African WT. Such knowledge may enable detection of novel biomarkers or therapeutic targets in WT.
The incomplete clinical data in this report highlight the need for more comprehensive tumor registries and tissue repositories in resource-constrained regions of the world and principally sub-Saharan Africa. While the clinical data are incomplete for our cohort of Kenyan WT patients, the conservatively estimated survival rate of 44% in this study parallels previously documented outcomes in this region and continues to differ drastically from the approximately 90% overall survival attainable by North American WT patients and the 95% survival rate detected in our control group.4–7, 10 Even for children who receive chemotherapy and aggressive surgical resection, recent reports from resource-constrained regions of sub-Saharan Africa indicate poor survival (approximately 40%) when compared to series from the developed world.8 The role of delayed presentation in the accumulation of aggressive tumor features is assumed, based on knowledge of cancer biology, but remains unreported in this at-risk population until now. Whether accumulation of aggressive tumor features represents an inherent biological difference in the pathogenesis of WT in Africa or is related to a delay in diagnosis, the presence of these features at the time of initial therapy seems to warrant broader implementation of high-risk treatment protocols in this patient population.
Our results indicate that WT from sub-Saharan Africa may indeed have a more aggressive and unique biological phenotype, displaying features that associate with higher mortality, disease-relapse, and treatment resistance in other regions of the world. In conclusion, we have shown the feasibility of conducting molecular research on WT in a resource-constrained region of sub-Saharan Africa, where this otherwise treatable embryonal tumor is a highly lethal childhood disease. However, considerable efforts must be made to enable translational application and potential benefit of these studies to enhance outcomes of WT patients in Africa. Our findings not only underscore the need for more adequate therapies in this resource-constrained region, but also signify that even current and standard risk protocols may under treat this population.
Supplementary Material
Statement of Novelty/Impact.
This is the first molecular characterization of Wilms tumor (WT) from a resource-constrained region of sub-Saharan Africa, where the WT incidence and mortality are notably higher than in the developed world. We detected an aggressive/unique biologic phenotype in African WT that may warrant more intensive or alternative therapies. Most importantly, we call attention to the need for tumor registries and implementation of standardized treatment protocols in this developing region of the world.
Acknowledgments
Experiments were conducted according to the ethical standards for human subjects research from the Vanderbilt University Institutional Review Board (IRB study numbers 020888 and 100734) and the Kijabe Mission Hospital Ethics Committee. Work was supported by the Vanderbilt CTSA grant UL1 RR024975 and NCI grants 5T32CA106183-06A1 (JRA and AJM) and 4R00CA135695-03 (HNL). Mass spectrometry work was supported in part by VICC grant P30-CA68485 and DOD W81XWH-05-1-0179. We would like to thank Jamie Allen for help with sample preparation. We would also like to acknowledge the services of the Vanderbilt Translational Pathology Shared Resource (NCI grant P30 CA68485), the Vanderbilt DNA sequencing facility, and the GenHunter Coporation (Nashville, TN).
Abbreviations used
- WT
Wilms tumor
- KWT
Kenyan Wilms tumor
- NAWT
North American Wilms tumor
- MM
metanephric mesenchyme
- FFPE
formalin fixed paraffin embedded
- MALDI-TOF-IMS
matrix assisted laser desorption ionization time of flight imaging mass spectrometry
- IMS
imaging mass spectrometry
- H&E
hematoxylin and eosin
- LOH
loss of heterozygosity
- COG
Children’s Oncology Group
- SNP
single nucleotide polymorphism
Footnotes
The authors have no financial or personal conflicts of interest.
References
- 1.Gurney JG, Severson RK, Davis S, Robison LL. Incidence of cancer in children in the United States. Sex-, race-, and 1-year age-specific rates by histologic type. Cancer. 1995;75:2186–95. doi: 10.1002/1097-0142(19950415)75:8<2186::aid-cncr2820750825>3.0.co;2-f. [DOI] [PubMed] [Google Scholar]
- 2.Metzger ML, Dome JS. Current therapy for Wilms’ tumor. Oncologist. 2005;10:815–26. doi: 10.1634/theoncologist.10-10-815. [DOI] [PubMed] [Google Scholar]
- 3.Breslow N, Olshan A, Beckwith JB, Green DM. Epidemiology of Wilms tumor. Med Pediatr Oncol. 1993;21:172–81. doi: 10.1002/mpo.2950210305. [DOI] [PubMed] [Google Scholar]
- 4.Kyambi JM, Kasili EG, Onyango JN, Kitonyi GW. The management of Wilms’ tumour in Kenya. East Afr Med J. 1981;58:424–30. [PubMed] [Google Scholar]
- 5.Kasili EG, Kyambi JM, Onyango JN, Kitonyi GW, Owade JN, Njenga GJ. Nephroblastoma: an example of cancer curable by appropriate intervention even in developing countries. East Afr Med J. 1987;64:828–35. [PubMed] [Google Scholar]
- 6.Abdallah FK, Macharia WM. Clinical presentation and treatment outcome in children with nephroblastoma in Kenya. East Afr Med J. 2001;78:S43–7. [PubMed] [Google Scholar]
- 7.Ekenze SO, Agugua-Obianyo NE, Odetunde OA. The challenge of nephroblastoma in a developing country. Ann Oncol. 2006;17:1598–600. doi: 10.1093/annonc/mdl167. [DOI] [PubMed] [Google Scholar]
- 8.Wilde JC, Lameris W, van Hasselt EH, Molyneux EM, Heij HA, Borgstein EG. Challenges and outcome of Wilms’ tumour management in a resource-constrained setting. Afr J Paediatr Surg. 2010;7:159–62. doi: 10.4103/0189-6725.70416. [DOI] [PubMed] [Google Scholar]
- 9.Israels T, Ribeiro RC, Molyneux EM. Strategies to improve care for children with cancer in Sub-Saharan Africa. Eur J Cancer. 2010;46:1960–6. doi: 10.1016/j.ejca.2010.03.027. [DOI] [PubMed] [Google Scholar]
- 10.Davidoff AM. Wilms’ tumor. Curr Opin Pediatr. 2009;21:357–64. doi: 10.1097/MOP.0b013e32832b323a. [DOI] [PMC free article] [PubMed] [Google Scholar]
- 11.Faria P, Beckwith JB, Mishra K, Zuppan C, Weeks DA, Breslow N, Green DM. Focal versus diffuse anaplasia in Wilms tumor--new definitions with prognostic significance: a report from the National Wilms Tumor Study Group. Am J Surg Pathol. 1996;20:909–20. doi: 10.1097/00000478-199608000-00001. [DOI] [PubMed] [Google Scholar]
- 12.Beckwith JB. National Wilms Tumor Study: an update for pathologists. Pediatr Dev Pathol. 1998;1:79–84. doi: 10.1007/s100249900010. [DOI] [PubMed] [Google Scholar]
- 13.Beckwith JB, Zuppan CE, Browning NG, Moksness J, Breslow NE. Histological analysis of aggressiveness and responsiveness in Wilms’ tumor. Med Pediatr Oncol. 1996;27:422–8. doi: 10.1002/(SICI)1096-911X(199611)27:5<422::AID-MPO6>3.0.CO;2-O. [DOI] [PubMed] [Google Scholar]
- 14.Hill DA, Shear TD, Liu T, Billups CA, Singh PK, Dome JS. Clinical and biologic significance of nuclear unrest in Wilms tumor. Cancer. 2003;97:2318–26. doi: 10.1002/cncr.11325. [DOI] [PubMed] [Google Scholar]
- 15.Govender D, Harilal P, Hadley GP, Chetty R. p53 protein expression in nephroblastomas: a predictor of poor prognosis. Br J Cancer. 1998;77:314–8. doi: 10.1038/bjc.1998.48. [DOI] [PMC free article] [PubMed] [Google Scholar]
- 16.Sredni ST, de Camargo B, Lopes LF, Teixeira R, Simpson A. Immunohistochemical detection of p53 protein expression as a prognostic indicator in Wilms tumor. Med Pediatr Oncol. 2001;37:455–8. doi: 10.1002/mpo.1229. [DOI] [PubMed] [Google Scholar]
- 17.Beniers AJ, Efferth T, Fuzesi L, Granzen B, Mertens R, Jakse G. p53 expression in Wilms’ tumor: a possible role as prognostic factor. Int J Oncol. 2001;18:133–9. [PubMed] [Google Scholar]
- 18.Ghanem MA, Van der Kwast TH, Sudaryo MK, Mathoera RB, van den Heuvel MM, Al-Doray AA, Nijman RM, van Steenbrugge GJ. MIB-1 (KI-67) proliferation index and cyclin-dependent kinase inhibitor p27(Kip1) protein expression in nephroblastoma. Clin Cancer Res. 2004;10:591–7. doi: 10.1158/1078-0432.ccr-0884-02. [DOI] [PubMed] [Google Scholar]
- 19.Nusse R. Cancer. Converging on beta-catenin in Wilms tumor. Science. 2007;316:988–9. doi: 10.1126/science.1143337. [DOI] [PubMed] [Google Scholar]
- 20.Koesters R, Niggli F, von Knebel Doeberitz M, Stallmach T. Nuclear accumulation of beta-catenin protein in Wilms’ tumours. J Pathol. 2003;199:68–76. doi: 10.1002/path.1248. [DOI] [PubMed] [Google Scholar]
- 21.Provost E, Yamamoto Y, Lizardi I, Stern J, D’Aquila TG, Gaynor RB, Rimm DL. Functional correlates of mutations in beta-catenin exon 3 phosphorylation sites. J Biol Chem. 2003;278:31781–9. doi: 10.1074/jbc.M304953200. [DOI] [PubMed] [Google Scholar]
- 22.Ehrlich D, Bruder E, Thome MA, Gutt CN, von Knebel Doeberitz M, Niggli F, Perantoni AO, Koesters R. Nuclear accumulation of beta-catenin protein indicates activation of wnt signaling in chemically induced rat nephroblastomas. Pediatr Dev Pathol. 2010;13:1–8. doi: 10.2350/08-03-0443.1. [DOI] [PMC free article] [PubMed] [Google Scholar]
- 23.Li CM, Kim CE, Margolin AA, Guo M, Zhu J, Mason JM, Hensle TW, Murty VV, Grundy PE, Fearon ER, D’Agati V, Licht JD, et al. CTNNB1 mutations and overexpression of Wnt/beta-catenin target genes in WT1-mutant Wilms’ tumors. Am J Pathol. 2004;165:1943–53. doi: 10.1016/s0002-9440(10)63246-4. [DOI] [PMC free article] [PubMed] [Google Scholar]
- 24.Fukuzawa R, Anaka MR, Weeks RJ, Morison IM, Reeve AE. Canonical WNT signalling determines lineage specificity in Wilms tumour. Oncogene. 2009;28:1063–75. doi: 10.1038/onc.2008.455. [DOI] [PubMed] [Google Scholar]
- 25.Fukuzawa R, Heathcott RW, More HE, Reeve AE. Sequential WT1 and CTNNB1 mutations and alterations of beta-catenin localisation in intralobar nephrogenic rests and associated Wilms tumours: two case studies. J Clin Pathol. 2007;60:1013–6. doi: 10.1136/jcp.2006.043083. [DOI] [PMC free article] [PubMed] [Google Scholar]
- 26.Major MB, Camp ND, Berndt JD, Yi X, Goldenberg SJ, Hubbert C, Biechele TL, Gingras AC, Zheng N, Maccoss MJ, Angers S, Moon RT. Wilms tumor suppressor WTX negatively regulates WNT/beta-catenin signaling. Science. 2007;316:1043–6. doi: 10.1126/science/1141515. [DOI] [PubMed] [Google Scholar]
- 27.Ruteshouser EC, Robinson SM, Huff V. Wilms tumor genetics: mutations in WT1, WTX, and CTNNB1 account for only about one-third of tumors. Genes Chromosomes Cancer. 2008;47:461–70. doi: 10.1002/gcc.20553. [DOI] [PMC free article] [PubMed] [Google Scholar]
- 28.Li CM, Guo M, Borczuk A, Powell CA, Wei M, Thaker HM, Friedman R, Klein U, Tycko B. Gene expression in Wilms’ tumor mimics the earliest committed stage in the metanephric mesenchymal-epithelial transition. Am J Pathol. 2002;160:2181–90. doi: 10.1016/S0002-9440(10)61166-2. [DOI] [PMC free article] [PubMed] [Google Scholar]
- 29.Boyle S, Shioda T, Perantoni AO, de Caestecker M. Cited1 and Cited2 are differentially expressed in the developing kidney but are not required for nephrogenesis. Dev Dyn. 2007;236:2321–30. doi: 10.1002/dvdy.21242. [DOI] [PubMed] [Google Scholar]
- 30.Kobayashi A, Valerius MT, Mugford JW, Carroll TJ, Self M, Oliver G, McMahon AP. Six2 defines and regulates a multipotent self-renewing nephron progenitor population throughout mammalian kidney development. Cell Stem Cell. 2008;3:169–81. doi: 10.1016/j.stem.2008.05.020. [DOI] [PMC free article] [PubMed] [Google Scholar]
- 31.Hendry C, Rumballe B, Moritz K, Little MH. Defining and redefining the nephron progenitor population. Pediatr Nephrol. 2011 doi: 10.1007/s00467-010-1750-4. [DOI] [PMC free article] [PubMed] [Google Scholar]
- 32.Armstrong JF, Pritchard-Jones K, Bickmore WA, Hastie ND, Bard JBL. The expression of the Wilms’ tumour gene, WT1, in the developing mammalian embryo. Mechanisms of Development. 1993;40:85–97. doi: 10.1016/0925-4773(93)90090-k. [DOI] [PubMed] [Google Scholar]
- 33.Kreidberg JA. WT1 and kidney progenitor cells. Organogenesis. 2010;6:61–70. doi: 10.4161/org.6.2.11928. [DOI] [PMC free article] [PubMed] [Google Scholar]
- 34.Vuononvirta R, Sebire NJ, Dallosso AR, Reis-Filho JS, Williams RD, Mackay A, Fenwick K, Grigoriadis A, Ashworth A, Pritchard-Jones K, Brown KW, Vujanic GM, et al. Perilobar nephrogenic rests are nonobligate molecular genetic precursor lesions of insulin-like growth factor-II-associated Wilms tumors. Clin Cancer Res. 2008;14:7635–44. doi: 10.1158/1078-0432.CCR-08-1620. [DOI] [PMC free article] [PubMed] [Google Scholar]
- 35.Lovvorn HN, Westrup J, Opperman S, Boyle S, Shi G, Anderson J, Perlman EJ, Perantoni AO, Wills M, de Caestecker M. CITED1 expression in Wilms’ tumor and embryonic kidney. Neoplasia. 2007;9:589–600. doi: 10.1593/neo.07358. [DOI] [PMC free article] [PubMed] [Google Scholar]
- 36.Groseclose MR, Massion PP, Chaurand P, Caprioli RM. High-throughput proteomic analysis of formalin-fixed paraffin-embedded tissue microarrays using MALDI imaging mass spectrometry. Proteomics. 2008;8:3715–24. doi: 10.1002/pmic.200800495. [DOI] [PMC free article] [PubMed] [Google Scholar]
- 37.Axt J, Murphy AJ, Seeley EH, Martin CA, Taylor C, Pierce J, Caprioli RM, Whiteside M, Lovvorn HN. Race Disparities in Wilms Tumor Incidence and Biology. Journal of Surgical Research. 2011 doi: 10.1016/j.jss.2011.03.011. Data in Press. [DOI] [PMC free article] [PubMed] [Google Scholar]
- 38.Wegert J, Bausenwein S, Roth S, Graf N, Geissinger E, Gessler M. Characterization of primary Wilms tumor cultures as an in vitro model. Genes Chromosomes Cancer. 2012;51:92–104. doi: 10.1002/gcc.20936. [DOI] [PubMed] [Google Scholar]
- 39.Perlman EJ, Grundy PE, Anderson JR, Jennings LJ, Green DM, Dome JS, Shamberger RC, Ruteshouser EC, Huff V. WT1 mutation and 11P15 loss of heterozygosity predict relapse in very low-risk wilms tumors treated with surgery alone: a children’s oncology group study. J Clin Oncol. 2011;29:698–703. doi: 10.1200/JCO.2010.31.5192. [DOI] [PMC free article] [PubMed] [Google Scholar]
- 40.Royer-Pokora B, Busch M, Beier M, Duhme C, de Torres C, Mora J, Brandt A, Royer HD. Wilms tumor cells with WT1 mutations have characteristic features of mesenchymal stem cells and express molecular markers of paraxial mesoderm. Hum Mol Genet. 2010;19:1651–68. doi: 10.1093/hmg/ddq042. [DOI] [PubMed] [Google Scholar]
- 41.Seeley EH, Caprioli RM. Molecular imaging of proteins in tissues by mass spectrometry. Proc Natl Acad Sci U S A. 2008;105:18126–31. doi: 10.1073/pnas.0801374105. [DOI] [PMC free article] [PubMed] [Google Scholar]
- 42.Lahoti C, Thorner P, Malkin D, Yeger H. Immunohistochemical detection of p53 in Wilms’ tumors correlates with unfavorable outcome. Am J Pathol. 1996;148:1577–89. [PMC free article] [PubMed] [Google Scholar]
- 43.Bardeesy N, Falkoff D, Petruzzi MJ, Nowak N, Zabel B, Adam M, Aguiar MC, Grundy P, Shows T, Pelletier J. Anaplastic Wilms’ tumour, a subtype displaying poor prognosis, harbours p53 gene mutations. Nat Genet. 1994;7:91–7. doi: 10.1038/ng0594-91. [DOI] [PubMed] [Google Scholar]
- 44.Ho PA, Kuhn J, Gerbing RB, Pollard JA, Zeng R, Miller KL, Heerema NA, Raimondi SC, Hirsch BA, Franklin JL, Lange B, Gamis AS, et al. WT1 synonymous single nucleotide polymorphism rs16754 correlates with higher mRNA expression and predicts significantly improved outcome in favorable-risk pediatric acute myeloid leukemia: a report from the children’s oncology group. J Clin Oncol. 2011;29:704–11. doi: 10.1200/JCO.2010.31.9327. [DOI] [PMC free article] [PubMed] [Google Scholar]
- 45.Orloff MS, Iyengar SK, Winkler CA, Goddard KA, Dart RA, Ahuja TS, Mokrzycki M, Briggs WA, Korbet SM, Kimmel PL, Simon EE, Trachtman H, et al. Variants in the Wilms’ tumor gene are associated with focal segmental glomerulosclerosis in the African American population. Physiol Genomics. 2005;21:212–21. doi: 10.1152/physiolgenomics.00201.2004. [DOI] [PubMed] [Google Scholar]
- 46.Hu Q, Gao F, Tian W, Ruteshouser EC, Wang Y, Lazar A, Stewart J, Strong LC, Behringer RR, Huff V. Wt1 ablation and Igf2 upregulation in mice result in Wilms tumors with elevated ERK1/2 phosphorylation. J Clin Invest. 2011;121:174–83. doi: 10.1172/JCI43772. [DOI] [PMC free article] [PubMed] [Google Scholar]
- 47.Murphy AJ, Pierce J, de Caestecker C, Taylor C, Anderson JR, Perantoni AO, de Caestecker MP, Lovvorn HN. SIX2 and CITED1, markers of nephronic progenitor self-renewal, remain active in primitive elements of Wilms tumor. Journal of Pediatric Surgery. 2012 doi: 10.1016/j.jpedsurg.2012.03.034. (Data in press) [DOI] [PMC free article] [PubMed] [Google Scholar]
- 48.Axt J, Murphy AJ, Seeley EH, Martin CA, Taylor C, Pierce J, Caprioli RM, Whiteside M, Lovvorn HN., 3rd Race disparities in Wilms tumor incidence and biology. J Surg Res. 2011;170:112–9. doi: 10.1016/j.jss.2011.03.011. [DOI] [PMC free article] [PubMed] [Google Scholar]
Associated Data
This section collects any data citations, data availability statements, or supplementary materials included in this article.