Abstract
Background
A framework for estimating and comparing risks of various long-term complications on a common scale is developed and applied to three different techniques for cranio-spinal irradiation of pediatric medulloblastoma patients.
Methods
Radiation dose-response parameters related to excess hazard ratios for secondary breast, lung, stomach and thyroid cancer, heart failure and myocardial infarction were derived from large published clinical series. Combined with age- and sex-specific hazards in the U.S. general population this yielded excess hazards of complications for a cancer survivor, as a function of attained age. After adjusting for competing risks of death, life years lost (LYL) were estimated based on excess hazard and prognosis of a complication, for 3D conformal radiotherapy (3D CRT), volumetric modulated arc therapy (VMAT) and intensity-modulated proton therapy (IMPT).
Results
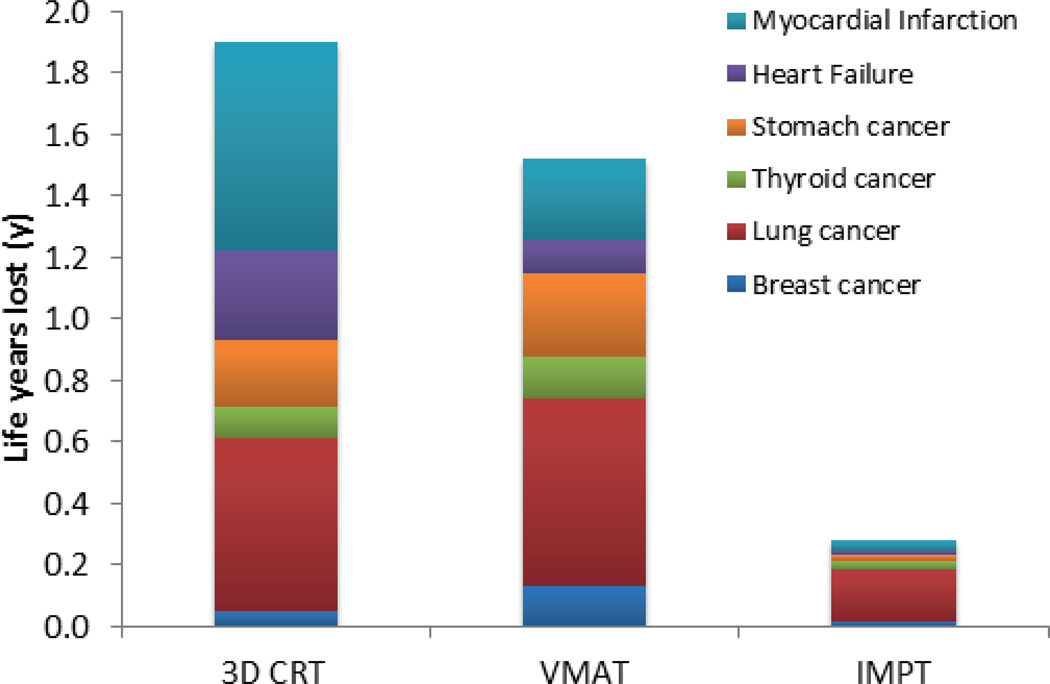
Lung cancer contributed most to the estimated LYL, followed by myocardial infarction and stomach cancer. Breast or thyroid cancer incidence was estimated higher than lung and stomach cancer incidence but LYL was lower due to the relatively good prognosis. Estimated LYL ranged between 1.90 years for 3D CRT to 0.28 years with IMPT. In a paired comparison, IMPT was associated with significantly fewer LYL than both photon techniques.
Conclusions
Estimating the risk of late complications is associated with considerable uncertainty but including prognosis and attained age at an event, to obtain the more informative LYL estimate, adds relatively little to this uncertainty.
Keywords: Life years lost, radiotherapy, late effects, secondary cancers, risk modeling
Introduction
Cancer survivors are subject to elevated risks of adverse effects such as cardiac disease, blindness, pneumonitis, neurocognitive impairment and secondary cancers (SCs).1–3 Information from cohort studies can be used to model the risk of late complications, for example to compare different treatment modalities or strategies.4,5 Risk estimates are usually expressed as a percentage excess risk or a relative risk (RR) compared with the general population. One problem is that different treatment options may give rise to different complications, and it is not straightforward to trade-off, say, an increased lifetime excess risk of severe late cardiac events with a decreased risk of inducing a SC.
Here, life years lost (LYL) is proposed as a tool for comparing multiple risks of potentially fatal late complications. This takes into account the age dependent risk of a given late event as well as its prognosis. Furthermore, a treatment-related fatality occurring at a young age will cause a greater average loss of life expectancy than the same event occurring late in life. The measure is easy to interpret and can be used to prioritize between risks of, for example cardiac events and SCs. In this study, LYL is applied to compare three cranio-spinal irradiation (CSI) techniques for ten pediatric medulloblastoma (MB) patients.
Materials and methods
Concept methodology
The LYL is estimated from the age-specific excess hazard ratio (hrexcess) of cancer survivors compared with the general population. To facilitate treatment-specific risk assessment, the dependency of hrexcess on the radiation dose, D, must be obtained for each of the studied endpoints. Also, the optimal dosimetric descriptor (e.g. mean dose, median dose or maximum dose) will have to be established for each endpoint as well as the dependency on age at exposure, e, patient sex, s, and attained age, a, or other relevant characteristics. Here, age at exposure and attained age are only included in the risk estimation model if they had a statistically significant effect on the hrexcess.
The age- and sex-specific hazard rates of the general population, ḣgen.pop., were extracted from the Surveillance Epidemiology and End Results (SEER) program unless otherwise noted.6
| (1) |
This yields an ḣexcess per year of attained age for developing the studied complication.
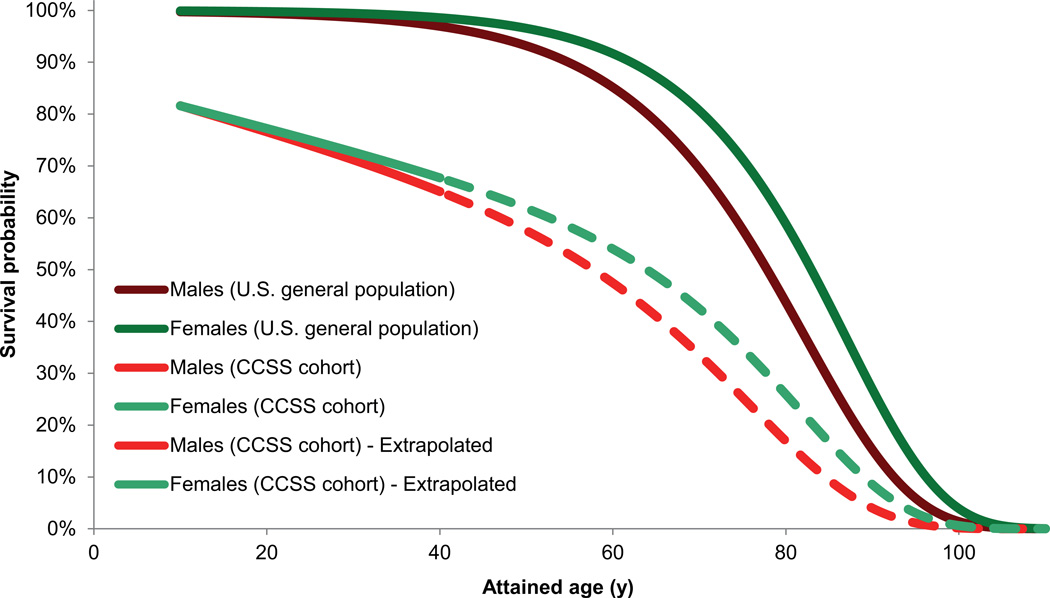
To account for competing risks of death from the primary disease, treatment related mortality or non-cancer related events, the probability of reaching age a, S(a,s) was estimated from the survival curves of the Childhood Cancer Survivor Study (CCSS) cohort relative to an age- and sex-matched U.S. general population.7 These data cover 30 years since diagnosis, but were linearly extrapolated beyond this period by assuming the same trend in survival ratio between the CCSS cohort and the general population, see Figure 1. The childhood cancer survival curve is normalized to the survival from the primary disease assuming a 5-year survival of 80%. The sensitivity of LYL to this extrapolation was tested by recalculating the survival curve assuming that the survival ratio between the CCSS cohort and general population remained constant after the last empirical observation.
Figure 1.
Age- and sex-specific survival probabilities of the U.S. general population and the Childhood Cancer Survivor Study (CCSS) cohort. Values were extrapolated based on the data up to 30 years since primary cancer diagnosis.
The age- and sex-dependent life expectancy (LE) after a complication at age a, is estimated from empirical survival data assuming the same prognosis as for a spontaneous event extracted from national registries. Integrating the survival probability yields the LE after the corresponding event. The LYL attributable to a specific endpoint occurring at age a is then the difference in LE relative to a person of the same age in the general population, conditional of having survived until that age. Hence;
| (2) |
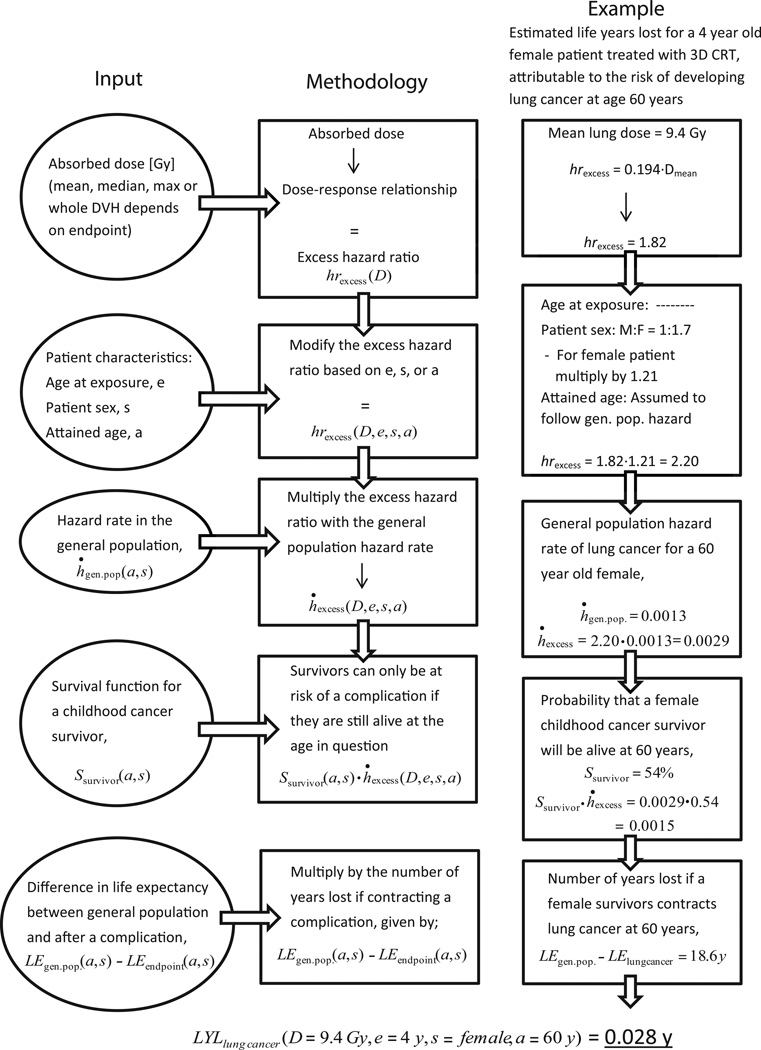
Figure 2 provides a flowchart illustrating the methodology with a corresponding example of calculating the LYL for a specific case. The total LYL attributable to each endpoint can then be derived by integrating the LYL for all attained ages after the age at exposure.
| (3) |
Figure 2.
Flowchart illustrating the life years lost (LYL) estimation methodology and a corresponding example of calculating the LYL for a specific case.
The upper limit of the integral was taken as 110 years as Ssurvivor for older ages was effectively zero.
Application to pediatric medulloblastoma patients
Different radiotherapy treatment techniques were compared with respect to LYL for ten pediatric MB patients aged 4–15 years treated in 2007–2009 with post-surgical chemotherapy and CSI at our institution.
Table 1 summarizes literature data on radiation dose-response and effect of age at exposure, attained age and patient sex. Data from pediatric studies were used where possible; alternatively, data from Hodgkin lymphoma survivors were used. The hrexcess as a function of radiation dose is normalized to that of un-irradiated individuals as the case-control design does not allow for absolute risk estimates. This assumes that deriving hrexcess from non-irradiated cancer patients is identical to deriving it from the U.S. general population.
Table 1.
Data including references for the excess hazard ratio (hrexcess) dependency used in the risk modeling.
| Studied endpoint | Dose-response function, hrexcess/Gy |
Type of study for dose-response |
Age at exposure dependence, e |
Male:Female risk ratio |
References |
|---|---|---|---|---|---|
| Breast cancer | hrexcess = 0.149·Dmean | Nested case-control study of female HL survivors diagnosed at age ≤ 30 years |
No trend in risk for childhood cancer patients ages < 21 years |
- | Dose-response: Travis et al. (2003) Age and sex: Kenney et al. (2004) |
| Lung cancer | hrexcess = 0.194·Dmean | Nested case-control study of HL survivors |
Too few cases from childhood cancer survivors to see effect |
1:1.7* | Dose-response: Travis et al. (2005) Age and sex: Swerdlow et al. (2000) Bassal et al. (2006) |
| Thyroid cancer | hrexcess = β1D·exp(−β4D2) | Nested case-control study of childhood cancer survivors |
Significant linear trend: β1 = 2·81−0·15·e B4 = 0·00164 |
1:1.7 | Dose-response: Bhatti et al. (2010) Age and sex: Bhatti et al. (2010) |
| Stomach cancer | hrexcess = 0.84·Dmean | Cohort/Nested case-control study of survivors of testicular cancer or HL |
Patients < 20 years at higher risk than adults but no trend in childhood data |
1:3.7* | Dose-response: Belt-Dusebout et al. (2009) Age and sex: Belt-Dusebout et al. (2009) Bassal et al. (2006) |
|
Cardiac complications - Heart Failure - Myocardial infarction |
hrexcess = 0.117·Dmean hrexcess = 0.096·Dmean |
Cohort study of childhood cancer survivors with siblings as comparison |
Almost significant linear trends of higher risk for younger age |
1:1.4 1:0.6 |
Dose-response: Mulrooney et al. (2009) Age and sex: Mulrooney et al. (2009) |
Based on adult data
HL - Hodgkin Lymphoma
Age- and sex-specific hazard rates and survival data for thyroid, breast and lung cancer were obtained from the SEER registry.6 Data for cardiac events were obtained as hospital discharge rates from the Centers for Disease Control and prevention (CDC) database.8 After a heart failure diagnosis, however, the same patient may be hospitalized repeatedly.
Therefore age-specific mortality rates, ḣmort, were obtained from the CDC database and LYL estimated as:
| (4) |
Treatment plans for the ten MB patients delivering 36 Gy to the cranio-spinal axis and 54 Gy to the posterior fossa were generated in accordance with published guidelines9 using three-dimensional conformal therapy (3D CRT), volumetric modulated arc therapy (VMAT) and spot-scanned intensity-modulated proton therapy (IMPT) using the Eclipse™ treatment planning system version 8.9 (Varian Medical Systems, USA). The 3D CRT plans consisted of two lateral opposed cranial fields to cover the whole brain and a spinal posterio-anterior field to cover the spinal canal extending caudally to the S2-S3 junction. The lateral extent of the 3D CRT spinal field was the PTV plus 10 mm as this best represented the set-up from the treatment records of the patients. The boost plans were created using four fields to cover the posterior fossa. The VMAT plans were generated using the RapidArc® (Varian Medical Systems, USA) implementation with a 360 degree cranial arc and one or two 140 degree spinal arcs. The spinal arcs were not planned as full rotations to avoid irradiating through the arms and ventral parts of the patient. The VMAT boost plans consisted of a 220 degree arc covering the posterior fossa without incident irradiation through the anterior part of the head.
The IMPT plans were generated using three fields incident from the posterior direction. One field was set to cover the caudal part of the spinal canal and the other two fields were set to cover the brain and remaining part of the spinal canal. The IMPT boost plans consisted of a single posterior field covering the posterior fossa. The CTV to PTV margin for the VMAT and IMPT plans was 5 mm for the cranial part and 7 mm for the spinal part. Note that changing the margins would change the doses to the OARs close to the target and thus affect the relative comparison between treatment techniques.
Further details regarding treatment planning and margins have been described elsewhere4. It should be noted that although the dosimetric input in the current study is based on Brodin et al., the risk estimates provided here are based on a different methodology and dose-response data. The same treatment margins were applied for IMPT as for the VMAT technique although in practice, larger margins are sometimes applied with proton therapy due to the range uncertainty in proton dose deposition. OARs were delineated by an experienced radiologist (AKB).
Estimated organ-specific secondary neutron doses were obtained from a spot-scanned proton beam simulated using Monte Carlo methods on a pediatric mathematical phantom receiving cranio-spinal proton irradiation.10 The induction of late effects attributable to secondary neutrons is subject to large uncertainty. As a conservative approach, the recommended11 relative biological effectiveness (RBE) of neutrons compared to photons, was multiplied by a factor of 5 in our estimates. Even so, the secondary neutrons inherent to proton irradiation will contribute to added uncertainty in our estimates. Also as our estimates are based on a simulated spot-scanned proton beam they might not be valid for a passively scattered beam.
Dose-response relationships for the heart, breast, lung and stomach endpoints were approximately linear, so the mean dose was used for these calculations. The dose-response for secondary thyroid cancer, however, is best modeled as a bell-shaped function.12 Consequently, the differential DVH of the thyroid was weighted to obtain an organ equivalent dose (OED)5
| (5) |
where νi is the fractional volume of the thyroid receiving dose Di and N is the number of voxels in the total volume V. The β1 parameter describes the linear ascending part of the dose-response and β4 the exponential-quadratic descending part, cf. Table 1.
Statistical analysis
Uncertainty in estimating the LYL comes mainly from the dose-response parameters. To obtain a robust comparison of LYL between treatment modalities, a paired difference Monte Carlo method was used. Samples were randomly drawn from a log-normal distribution with mean and 95% confidence interval (CI) corresponding to the published dose-response data. We thus sampled over the uncertainty in dose-response for each endpoint derived from the corresponding epidemiological studies. However, this does not include systematic components, for example if the true functional form of the dose-risk curve is different from the assumed form or if the dose descriptor used here is not the best fit to the outcome data, as such uncertainties cannot be represented by the uncertainty in the model parameters.
For each endpoint, the difference in LYL between pairs of modalities was calculated and the overall LYL with 95% CI was extracted by inverse variance weighting. To avoid underestimation of the variance due to the small number of patients in this study, a bootstrapping procedure was applied where 10,000,000 samples of the ten patients were drawn with replacement. The average point estimate and CI was calculated as stated above for each sample and a normal distribution was matched to the result. Finally, a sample was randomly drawn from each of these 10,000,000 normal distributions. The final difference in LYL with 95% CI was taken as the mean and 2.5 – 97.5 percentile of the randomly drawn samples. This provided estimates of the uncertainty in the paired comparison between modalities, resulting from uncertainty in the parameters derived from the published dose-response data.
Results
Age-specific hazard rates for cancer and cardiac events in the general population were not published for ages over 85 years. It was assumed that these rates are constant for all ages over 90 years and equal to the rates published for the “85+” group. This assumption has a negligible effect on the estimated LYL.
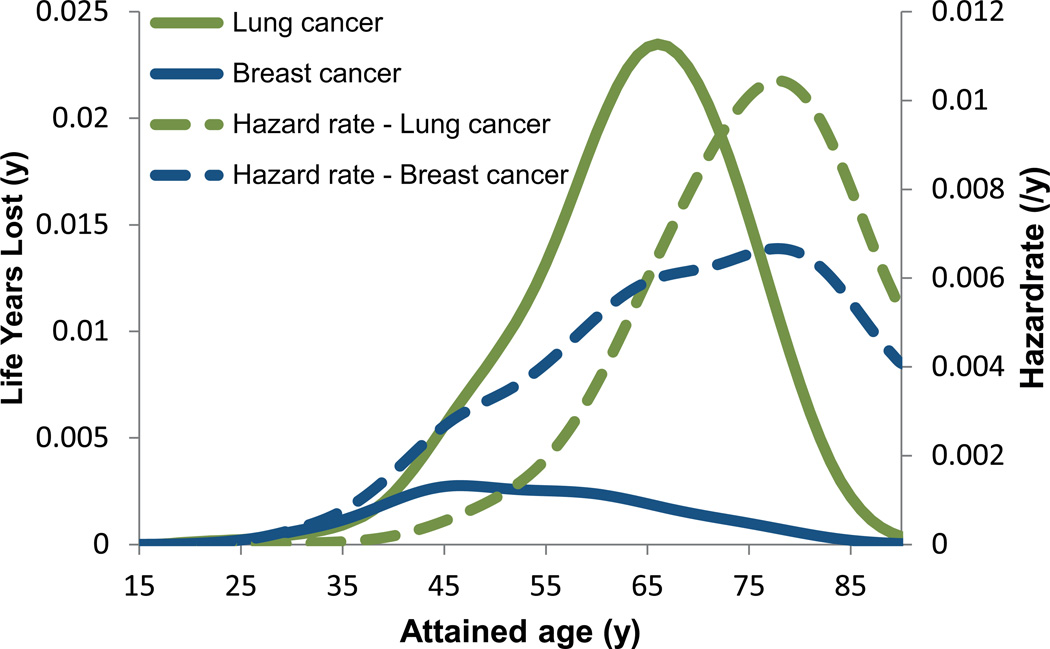
Figure 3 shows the estimated time of onset between endpoints, where the peak in attributable LYL appears earlier for breast cancer than lung cancer. The predominant contributor to the LYL for the VMAT plans is lung cancer followed by stomach cancer and myocardial infarction, see Figure 4. The estimated early onset and relatively high incidence of secondary thyroid cancer (data not shown) is offset by its favorable prognosis, when calculating the LYL. Figure 4 shows total LYL estimates according to Equation 3 for the different treatment techniques.
Figure 3.
Mean values of estimated hazard rates and life years lost (LYL) attributable to radiation-induced secondary breast and lung cancer for the ten medulloblastoma patients based on the VMAT plans. Data is shown for attained ages up to 90 years after which we assume that the hazard remains constant at the level reported for the 85+ group in the SEER registry. The LYL curves are left-shifted compared to the hazard rate curves illustrating more life years lost after an event occurring at younger age. Despite similar hazard rates for contracting breast and lung cancer, there is a large difference in LYL attributable to breast and lung cancer as a result of the different prognosis of the diseases.
Figure 4.
Mean values of the life years lost (LYL) attributable to the studied endpoints. The significance of the LYL differences between modalities was tested with the paired Monte Carlo method with bootstrapping as further explained in the text.
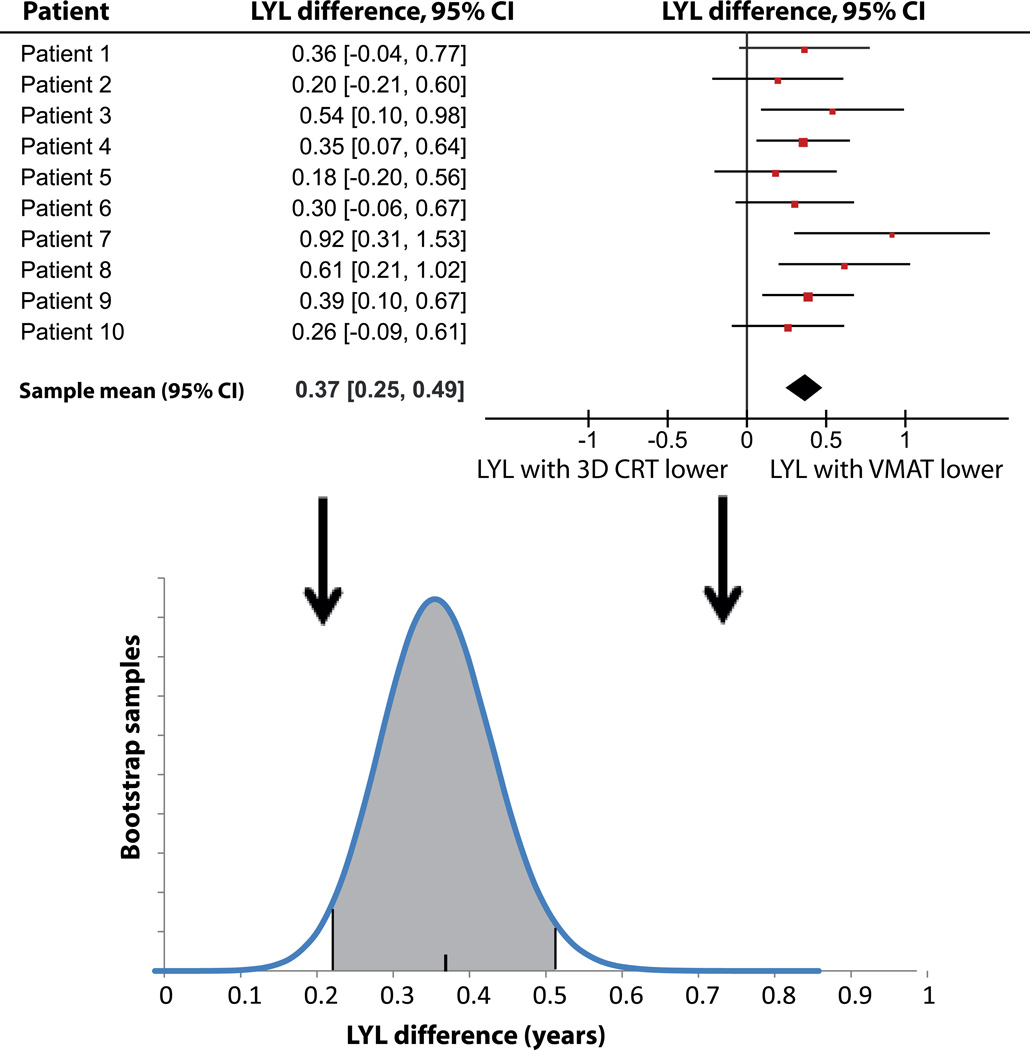
The treatment-related mean (95% CI) LYL differences between VMAT and IMPT was 1.09 y (0.80 – 1.42 y) and 0.37 y (0.23 – 0.52 y) between 3D CRT and VMAT. LYL due to SC was higher for VMAT than for 3D CRT reflecting the spread of radiation dose to OARs typical of intensity-modulated treatment. Conversely, the LYL due to cardiac events were lower for VMAT than for 3D CRT, reflecting the considerably reduced mean heart dose (7.3 Gy vs. 18.9 Gy). The difference between 3D CRT and VMAT depends on the relative weight of cardiac events compared to SC events, and is thus subject to a systematic uncertainty not included in the statistical uncertainty, and should be cautiously interpreted. The width of the spinal treatment field in 3D CRT for MB affects the risk of radiation-induced heart failure, since it directly affects the mean heart dose.4 The same holds for mean lung dose. Hence, the relative merits of these techniques depend critically on the margins used.
The sensitivity analysis of extrapolating the survival curve of the CCSS cohort to older ages showed that assuming a constant rather than a linearly decreasing ratio after the last follow-up yielded 12% higher LYL estimates for all three treatment techniques but did not affect their relative merits.
The paired samples statistical test shows a small but significant LYL difference between 3D CRT and VMAT, although it should be noted that any systematic uncertainty that might change the relative weights of SCs compared to cardiac events is not considered in the statistical analysis, and there is a risk of a systematic error stemming from a mismatch between the assumed and the true shape of the underlying dose-response relationship. The strength of the paired Monte Carlo test is that only differences in risks are considered, rendering the conclusion insensitive to uncertainties in parameters describing a monotonous dose-response curve. However, the method is, as most statistical tests, relying on the assumption that the dose descriptor (typically mean dose) is indeed the correct descriptor, and that the dose-response has the correct parameterization. Figure 5 illustrates the paired Monte Carlo test with bootstrapping for this comparison. The LYL due to secondary thyroid cancer were less for 3D CRT compared to VMAT despite a higher thyroid dose due to the bell-shaped dose-response relationship.
Figure 5.
Results of the statistical analysis for the 3D CRT - VMAT LYL difference. The mean differences with corresponding 95% confidence intervals (CI) for each patient from the Monte Carlo sampling are shown, as well as the resulting distribution of difference estimates obtained from the bootstrapping, with the final estimates of mean and 95% CI.
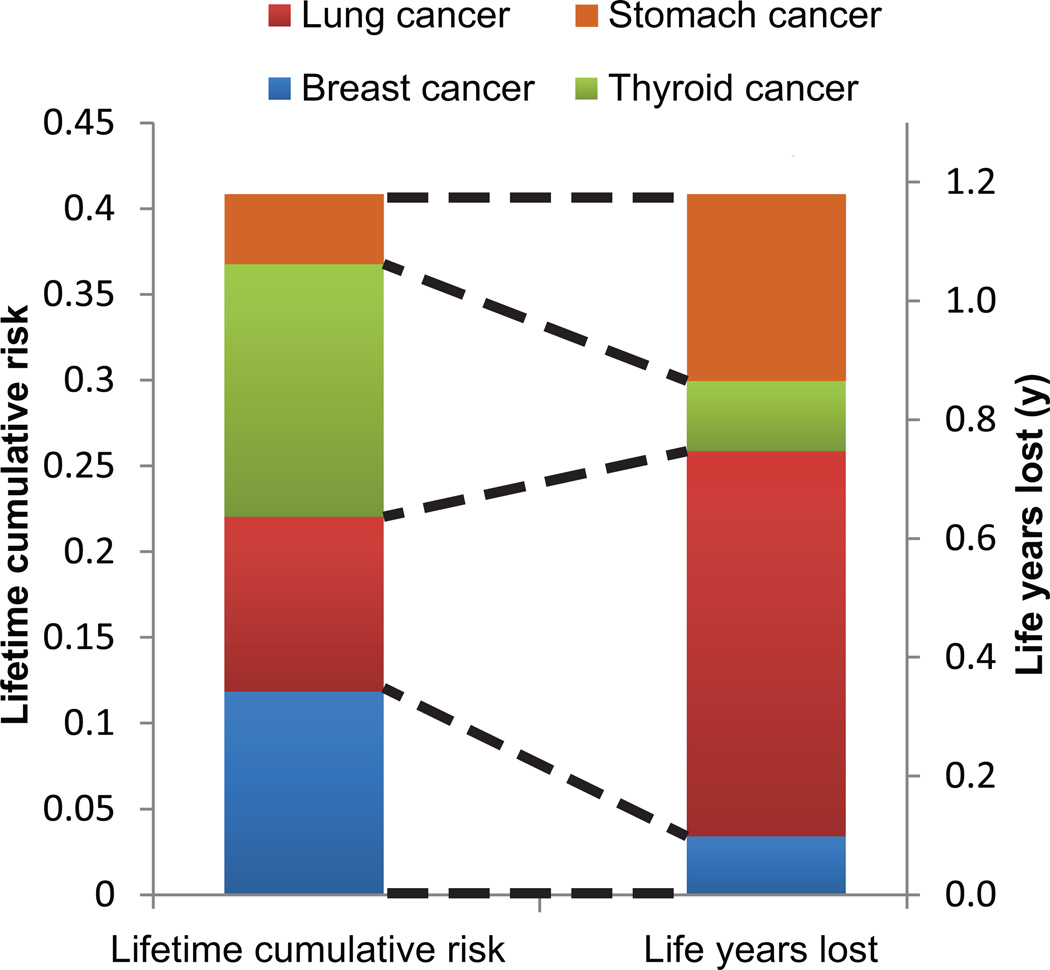
Figure 6 shows the lifetime cumulative risk of developing a SC and the corresponding LYL, clearly illustrating the impact of disease prognosis on LYL. The most frequent SCs were breast and thyroid cancer, however, the LYL attributable to these malignancies was small compared to lung cancer. The mean lifetime cumulative risk of developing any of the studied SCs was 33%, 40% and 18% for 3D CRT, VMAT and IMPT, respectively.
Figure 6.
Mean values for the VMAT plans for all patients of lifetime risk of developing a secondary cancer and the corresponding life years lost (LYL). The cumulative risk of lung cancer is fairly low (left hand bar, shown in red). However, the resulting LYL attributable to lung cancer dominate the total LYL (represented by the right hand bar), due to the poor prognosis. Conversely, despite a high cumulative lifetime risk, thyroid cancer (shown in green) contributes relatively little to the LYL due to its favorable prognosis.
Discussion
A framework was developed for estimating the life years lost (LYL) attributable to late complications of radiation therapy such as SC and cardiac events. The advantage of the LYL estimate over assessment of lifetime cumulative risks is that the time to event and the prognosis are taken into account. The uncertainty in relating radiation dose to excess hazard dominates the uncertainty of both the LYL estimate and estimates of lifetime cumulative risk. The additional data needed for estimating LYL are extracted from population-based registries and are therefore known with comparatively high precision. A required assumption is that the prognosis after SCs or radiation induced non-malignant toxicity is similar to that seen after a non-radiation related etiology. Consequently, LYL is easier to interpret when assessing the relative merits of alternative radiation therapy plans than lifetime cumulative risks and is only associated with a minor increase in uncertainty. Although informative, the LYL measure is a result of modeling various risks based on epidemiological studies and it should therefore be used with caution at the individual patient level. Further validation of the model is required, and the conclusions regarding the relative merits of radiation modalities should be tested in independent data sets.
In the present study, dose-response relationships were extracted from large clinical series and hazard rates documented for the U.S. general population. When interpreting case-control study data for an endpoint, hrexcess for an un-irradiated cancer survivor was assumed identical to that of an age-and sex-matched person in the general population, thus assuming no impact of chemotherapy and genetic predisposition. A similar problem was identified by Travis et al.13 when estimating cumulative absolute risks of secondary breast cancer after treatment for Hodgkin lymphoma based on a nested case-control study.14 They proposed treating the RR from the case-control study as an internal risk and estimate an external risk for the same cohort related to the general population breast cancer incidence and then combining these to estimate absolute risks. This approach requires individual patient level data from the case-control study. Additionally, it is unclear whether age at exposure and attained age significantly affect the late complication risk. The estimates shown in Figure 3 primarily represent the possibility of affecting the LYL by re-distribution of radiation dose. Including also non-radiation related risks more closely represents the absolute treatment-induced LYL of a cancer survivor. It is indeed possible to include risks such as anthracycline-related cardiac complications in the presented framework, but the required data could not be extracted from current literature.
The statistical uncertainty illustrates the need for higher quality dose-dependent risk data, reported as standardized incidence ratios (SIRs) relative to the general population. However, the dose-dependence of complication risks and the risk modifying effect of patient-related factors are often not reported in sufficient detail for optimal estimation of LYL. In the current analysis, the dependence on age at exposure was only available for the thyroid cancer estimates. Ideally, fitting parameters with confidence intervals and the functional form of the multivariate model should be reported as for example in Bhatti et al.12
The translation of risk estimates derived from large epidemiological studies with retrospective dosimetry to the patients in our study contributes to the overall uncertainty. This is especially true for endpoints where the dose-response was based on adult data since a general concern is that a developing child might be more susceptible to radiation-induced cancers. Also, long-term follow-up studies like the CCSS reflect the risk of treatment given some 20–30 years ago, making it difficult to extrapolate the results to modern treatment techniques such as VMAT or IMPT. These uncertainties mean that validation against independent data sets is crucial if a LYL measure is to be trusted for clinical decision support.
A recent publication15 estimated the non-relapse associated LYL in MB survivors at 4.3 years based on published mortality data from the CCSS.7 This value is larger than our estimates, probably because only a few causes of mortality are considered here. The estimate of lifetime cumulative risks of SC of 33% for 3D CRT and 40% for VMAT are roughly in agreement with other estimates for pediatric MB patients at 20–55%.16,17 Interestingly, Mertens et al.7 reported no cardiac deaths for MB survivors, possibly because the patients studied have not yet reached an age where the risk of cardiac events in the general population becomes apparent.
The present study assumes a similar prognosis after a treatment-induced and a spontaneous event. Cancer survivors may be followed more closely than the general population, possibly leading to earlier detection of a SC. The SC may also be of a different phenotype, more or less difficult to manage, than its spontaneous counterpart. Treatment-related cardiac complications may have a worse prognosis because of the relatively high prevalence of cardiac risk factors among cancer survivors.18 Such nuances can easily be incorporated in the LYL estimation, if the appropriate data becomes available.
A logical, but challenging, extension of the LYL concept would be inclusion of late relapse of the primary disease. Curing the primary disease must be the highest priority in cancer care and failure to do this would yield a large number of LYL. Including estimates of tumor control requires reliable clinical dose-response data and ideally, a quantification of the loss of tumor control if part of the target volume is undertreated. Another extension of our model would be to include non-lethal late complications affecting quality of life, in order to estimate quality-adjusted LYL (QALYL). QALYL would theoretically allow optimization of both health-related quality of life and life expectancy and thereby to assess the cost-benefit of advanced therapy options, such as proton therapy.19 Finally, LYL or QALYL could form the basis for radiotherapy plan optimization.
In summary, LYL estimates attributable to late effects are objective, easy to interpret and take prognosis and time to the event into account when comparing alternative treatment options. Our current limited knowledge of treatment-induced late effects does limit the accuracy of long-term risk estimates. However, a number of large clinical studies are in progress that will reduce the uncertainty of dose-response and clinical risk factor data and thereby improve the accuracy of LYL estimates.
Acknowledgments
Funding
This work was supported by a grant from the Danish Child Cancer Foundation to Patrik Brodin. Søren Bentzen acknowledges support from the National Cancer Institute grant no. 2P30 CA 014520-34.
Footnotes
Financial disclosures
Per Munck af Rosenschöld has a research agreement with Varian Medical Systems.
Reference List
- 1.Armstrong GT. Long-term survivors of childhood central nervous system malignancies: The experience of the Childhood Cancer Survivor Study. Eur J Paediatr Neurol. 2010 Jan 26; doi: 10.1016/j.ejpn.2009.12.006. [DOI] [PMC free article] [PubMed] [Google Scholar]
- 2.Darby SC, McGale P, Taylor CW, et al. Long-term mortality from heart disease and lung cancer after radiotherapy for early breast cancer: prospective cohort study of about 300,000 women in US SEER cancer registries. Lancet Oncol. 2005 Aug;6(8):557–565. doi: 10.1016/S1470-2045(05)70251-5. [DOI] [PubMed] [Google Scholar]
- 3.Meadows AT, Friedman DL, Neglia JP, et al. Second neoplasms in survivors of childhood cancer: findings from the Childhood Cancer Survivor Study cohort. J Clin Oncol. 2009 May 10;27(14):2356–2362. doi: 10.1200/JCO.2008.21.1920. [DOI] [PMC free article] [PubMed] [Google Scholar]
- 4.Brodin NP, Rosenschold PM, Aznar MC, et al. Radiobiological risk estimates of adverse events and secondary cancer for proton and photon radiation therapy of pediatric medulloblastoma. Acta Oncol. 2011 Aug;50(6):806–816. doi: 10.3109/0284186X.2011.582514. [DOI] [PubMed] [Google Scholar]
- 5.Schneider U, Zwahlen D, Ross D, et al. Estimation of radiation-induced cancer from threedimensional dose distributions: Concept of organ equivalent dose. Int J Radiat Oncol Biol Phys. 2005 Apr 1;61(5):1510–1515. doi: 10.1016/j.ijrobp.2004.12.040. [DOI] [PubMed] [Google Scholar]
- 6.Howlader N, Noone AM, Krapcho M, et al. SEER Cancer Statistics Review, 1975–2008. Bethesda, MD: National Cancer Institute; 2011. http://seer.cancer.gov/csr/1975_2008/ Based on November 2010 SEER data submission, posted to the SEER web site. [Google Scholar]
- 7.Mertens AC, Liu Q, Neglia JP, et al. Cause-specific late mortality among 5-year survivors of childhood cancer: the Childhood Cancer Survivor Study. J Natl Cancer Inst. 2008 Oct 1;100(19):1368–1379. doi: 10.1093/jnci/djn310. [DOI] [PMC free article] [PubMed] [Google Scholar]
- 8.Centers for Disease Control and Prevention. National Center for Health Statistics. Health Data Interactive; [Accessed Jan. 2011]. www.cdc.gov/nchs/hdi.htm. [Google Scholar]
- 9.Lannering B, Rutkowski S, Gustafsson G, et al. HIT-SIOP PNET4 a ranomized multicentre study of hyperfractionated versus conventional radiotherapy in children with standrad risk medulloblastoma. Neuro-Oncology. (10) PNET/MED 15 June 2008 (abstract) [Google Scholar]
- 10.Newhauser WD, Fontenot JD, Mahajan A, et al. The risk of developing a second cancer after receiving craniospinal proton irradiation. Phys Med Biol. 2009 Apr 21;54(8):2277–2291. doi: 10.1088/0031-9155/54/8/002. [DOI] [PMC free article] [PubMed] [Google Scholar]
- 11.ICRP. Ann. ICRP. Oxford: International Commission on Radiological Protection; 2003. Relative biological efectiveness (RBE), quality factor (Q), and radiation weighting factor (w(R)) Report No.: 92. [DOI] [PubMed] [Google Scholar]
- 12.Bhatti P, Veiga LH, Ronckers CM, et al. Risk of second primary thyroid cancer after radiotherapy for a childhood cancer in a large cohort study: an update from the childhood cancer survivor study. Radiat Res. 2010 Dec;174(6):741–752. doi: 10.1667/RR2240.1. [DOI] [PMC free article] [PubMed] [Google Scholar]
- 13.Travis LB, Hill D, Dores GM, et al. Cumulative absolute breast cancer risk for young women treated for Hodgkin lymphoma. J Natl Cancer Inst. 2005 Oct 5;97(19):1428–1437. doi: 10.1093/jnci/dji290. [DOI] [PubMed] [Google Scholar]
- 14.Travis LB, Hill DA, Dores GM, et al. Breast cancer following radiotherapy and chemotherapy among young women with Hodgkin disease. JAMA. 2003 Jul 23;290(4):465–475. doi: 10.1001/jama.290.4.465. [DOI] [PubMed] [Google Scholar]
- 15.Yeh JM, Nekhlyudov L, Goldie SJ, et al. A model-based estimate of cumulative excess mortality in survivors of childhood cancer. Ann Intern Med. 2010 Apr 6;152(7):409–408. doi: 10.1059/0003-4819-152-7-201004060-00005. [DOI] [PMC free article] [PubMed] [Google Scholar]
- 16.Mu X, Bjork-Eriksson T, Nill S, et al. Does electron and proton therapy reduce the risk of radiation induced cancer after spinal irradiation for childhood medulloblastoma? A comparative treatment planning study. Acta Oncol. 2005;44(6):554–562. doi: 10.1080/02841860500218819. [DOI] [PubMed] [Google Scholar]
- 17.Miralbell R, Lomax A, Cella L, et al. Potential reduction of the incidence of radiation-induced second cancers by using proton beams in the treatment of pediatric tumors. Int J Radiat Oncol Biol Phys. 2002 Nov 1;54(3):824–829. doi: 10.1016/s0360-3016(02)02982-6. [DOI] [PubMed] [Google Scholar]
- 18.Geenen MM, Bakker PJ, Kremer LC, et al. Increased prevalence of risk factors for cardiovascular disease in long-term survivors of acute lymphoblastic leukemia and Wilms tumor treated with radiotherapy. Pediatr Blood Cancer. 2010 Oct;55(4):690–697. doi: 10.1002/pbc.22518. [DOI] [PubMed] [Google Scholar]
- 19.Lundkvist J, Ekman M, Ericsson SR, et al. Cost-effectiveness of proton radiation in the treatment of childhood medulloblastoma. Cancer. 2005 Feb;103(4):793–801. doi: 10.1002/cncr.20844. [DOI] [PubMed] [Google Scholar]


