Abstract
Quantitative information about concentrations of several metabolites in human skeletal muscle can be obtained through localized 31P-MRS methods. However, these methods have shortcomings: long acquisition times, limited volume coverage, and coarse resolution. Significantly higher spatial and temporal resolution of imaging of single metabolites can be achieved through spectrally selective 3D-imaging methods. This study reports the implementation of a 3D spectrally selective turbo spin echo (TSE) sequence, on a 3T clinical system, to map the concentration of phosphocreatine (PCr) in the human calf muscle with significantly increased spatial resolution and in a clinically feasible scan time. Absolute PCr quantification was performed with the use of external phantoms after relaxation and flip angle correction of the TSE voxel signal. The mean ± standard deviation of the PCr concentration measured in five healthy volunteers was 29.4 ± 2.5 mM, with signal-to-noise ratio of 14:1 and voxel size of 0.52 ml.
Keywords: TSE imaging, 31P imaging, calf muscle, phosphocreatine
INTRODUCTION
Magnetic Resonance Spectroscopy (MRS) methods have been extensively used for the quantitative study of high-energy phosphate metabolites in human muscle, at healthy and diseased states, for more than three decades (1–7). 31P MRS techniques offer the direct non-invasive measurement of metabolites that play important roles in energy metabolism of tissue, and have therefore contributed to a better understanding of common metabolic diseases that have a rapidly increasing socioeconomic impact among the elderly and the young (8–14).
We can obtain further insight into the dynamics and propagation patterns of several musculoskeletal diseases by means of spatially localized experiments. Widely used chemical shift imaging (CSI) methods offer the simultaneous measurement of important metabolites such as adenotriphosphate (ATP), phosphocreatine (PCr), and inorganic phosphate (Pi), typically with voxel sizes of 75 ml (15). However, these methods yield resolutions that make it difficult to disentangle signals arising from muscular tissue, blood vessels, and bones. Recent studies have applied higher spatial resolution spectroscopic sequences to image 31P (16) and have reported voxel sizes as small as 3.6 ml (17,18). They could potentially be combined with promising undersampling methods such as compressed sensing (19,20), to further increase spatial resolution.
Higher temporal and spatial resolution, compared to that obtained by MRS methods, can be achieved with the use of spectrally selective imaging sequences that excite and acquire only a single resonance of the 31P spectrum (21–27). By shifting the frequency of the excitation pulse, the same experiment can be repeated several times to obtain images of multiple phosphate metabolites (27).
In this work, we report the development and implementation of a 3D spectrally selective turbo spin echo (TSE) sequence on a 3T clinical scanner for quantitative mapping PCr concentration in the entire volume of the calf muscle of healthy subjects.
MATERIALS AND METHODS
MR imaging and spectroscopy experiments
All 31P and 1H imaging and unlocalized spectroscopy experiments were performed on healthy volunteers with a 3T Siemens clinical scanner (MAGNETOM Tim Trio, Siemens Medical Solutions, Erlangen, Germany) employing a dual-tuned 31P/1H quadrature volume coil (Rapid MRI, Ohio) with 18 cm inner diameter and 20 cm resonator length. Five healthy volunteers were recruited, three male and two female (mean ± standard deviation age: 33.6 ± 4.9 yr). The New York University School of Medicine Institutional Review Board approved the examination protocol for the study, and all subjects provided written consent for participation in the study.
We used unlocalized spectroscopic sequences to measure T1 and T2 relaxation rates of PCr in the calf muscle of all five volunteers. T1 was measured with the use of a pulse-acquire product sequence. Repetition times (TR) varied (1.0, 2.5, 5, 7.5, 10, 12.5, 17.5, 22.5 and 30 s) and the spectroscopic peak amplitude of PCr was fitted to a single exponential growth function. To assess the spectral quality we measured the linewidth of the PCr peak (defined as the full width at half maximum (FWHM)) of the fully relaxed spectra (TR = 30 s). For measuring T2, the spectroscopic peak of PCr acquired using an unlocalized spin-echo product sequence at echo times (TE) of 35, 50, 100, 150, 200, 300, 600 and 800 ms, was fitted to a single exponential decay function. We employed the same methods to measure the T1 and T2 relaxation rates of two 50 ml PCr solutions of 25 and 50 mM concentration respectively.
The TSE imaging sequence was developed by using the ‘SequenceTree’ software (28,29). The pulse sequence, a schematic of which is shown in Fig. 1a, uses a spectrally selective excitation pulse and samples k-space in a fully centric manner. A narrowband 90° Gaussian pulse (16 ms duration) excites a single resonance peak of the 31P spectrum (i.e. PCr), without the use of a slice selective gradient. A train of 24 non-selective square refocusing (180°) pulses, of 800 μs duration, is used, with the phase of each pulse held constant at 90° relative to the initial excitation pulse (Carr-Purcell-Meiboom-Gill condition). To avoid any wrap-around aliasing artifacts due to lack of slab selective gradients, the field of view (FOV: 220 × 220 × 200 mm) is kept longer than the sensitive region of the coil. The acquisition matrix size is 48 × 48 × 8, resulting in voxel size of 0.52 ml, with TR of 12 s, and scan time of 3 min and 12 s per average. For absolute quantification of metabolite concentration, four 50-ml reference phantoms were placed by the calf of each volunteer: two containing PCr (25 mM and 50 mM) and two containing Pi (25 mM and 50 mM).
Fig. 1.
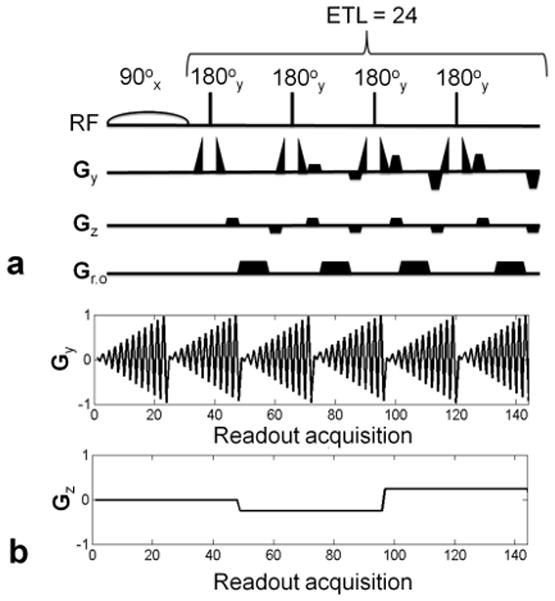
a) Schematic of the 3D-TSE sequence. The moment for the z-gradient (Gz) is kept constant for a given echo train, while the y-phase (Gy) encoding gradient is stepped to cover kz space in segmented fashion. The echo train length (ETL) is 24. b) Gradient waveform for the y (top) and the z (bottom) gradients for six echo trains. The z-gradient remains constant during each echo train.
The waveform of the phase encoding gradients is shown in Fig. 1. b. The center of k-space is sampled at 26 ms, which minimizes any possible contamination from ATP signal (21), and the echo-spacing is set to 26 ms. Data are acquired at each readout with a 2.5 kHz bandwidth (dwell time: 400 μs). In TSE sequences increased blurring is expected in the direction where the ETL is sampled (y-directions in this case). We simulated the effect of modulation of signal during the ETL acquisition in order to predict the point spread function (PSF) along the y-dimension (30).
In the 31P spectrum the closest peak to PCr is that of γ-ATP (2.5 ppm or 124 Hz in the scanner used in this study). We measured the bandwidth of the Gaussian pulse by acquiring a series of images of a 1000 ml solution containing 85% of phosphoric acid (Fischer Scientific, Pittsburgh, USA). We acquired 31 images by incrementing the scanner’s transmission frequency in steps of 20 Hz from 300 Hz below the resonance frequency of Pi to 300 Hz, above and measured the mean intensity of all voxels. To further confirm the selectivity of the pulse, we acquired 3D-TSE images of three 50 ml solutions containing 50 mM of ATP, PCr, and Pi by centering the transmission frequency on PCr, Pi and γ-ATP respectively.
Since 31P images of the calf muscle are acquired in the entire volume of sensitivity of the coil, significant drop of signal is expected, especially in the volume slices close to the edge of the coil and will affect the quantification of PCr. To study this signal drop across the volume of the coil we generated B1 field maps for two volunteers by acquiring a pair of 3D spin-echo images: the first with 60° excitation and 120° refocusing pulses, the second with 120° excitation and 240° refocusing pulses (as has been described elsewhere (31)). Other parameters of the spin-echo were: TR: 15 s, TE: 13 ms, matrix size 16 × 16 × 8, FOV: 220 × 220 × 200 mm. The total acquisition time for both scans is 1 hr and 4 min.
To verify muscle anatomy, we used a product TSE sequence to acquire 3D-1H TSE images (with the same FOV and orientation as the 31P images) of all volunteers.
FA and PCr concentration mapping
By taking the ratio, r, of the signal intensity of the two spin-echo images the flip angle (FA) maps can be reconstructed with the use of the following formula (31,32):
| [1] |
Due to the long duration of the B1 measurement experiment, an accurate mapping of the FA for each volunteer is impractical. We averaged the datasets obtained from the two volunteers, and estimated the mean FA in the volume of the coil. We then manually segmented the reference phantoms and the calf muscle, and corrected their signals for T1, T2 and FA on a voxel-by-voxel basis. The following formula, which has been modified from (4,6), was used for signal correction:
| [2] |
Where S is the voxel signal after correction, S0 the voxel signal before correction, TR the repetition time (12 s) and TE the effective echo time (26 ms) of the 31P TSE sequence. T1 and T2 are the bulk relaxation parameters of the known concentration of reference phantoms (for the voxels that contain signal from the phantoms), or the relaxation parameters of the calf muscle (for the respective voxels) and FA the local flip angle calculated from the B1 maps. A concentration calibration line is obtained by fitting a linear function to the mean signal of the voxels from noise, and from the 25 and 50 mM phantoms, and a voxel-by-voxel comparison between the signal from the calf muscle and the calibration line is performed to extract. These concentrations are in mmol/L tissue and can be converted to mmol/L cell water (mM) through multiplication by a conversion factor (in this case equal to 1.41) that takes into account the water content of the muscle (33).
RESULTS
We measured spectral width of the PCr peak at 10.9 ± 3.6 Hz (mean ± SD) from the fully relaxed unlocalized spectra. The bandwidth profile of the 16 ms Gaussian pulse can be seen in Fig. 2. a. The full width at half maximum (FWHM) is 122 Hz, which is narrow enough to excite only the PCr resonance peak without contamination from other metabolites, especially γ-ATP which has the closest peak separation (124 Hz). We experimentally confirmed the spectral selectivity of the pulse with the results shown in Fig. 2. b–e. In the 1H image, three solutions of 50 mM ATP, PCr, and Pi can be seen (Fig. 2. b). By centering the excitation pulse of the 3D -TSE on the respective peak of each metabolite a single resonance is imaged with no contamination from the other peaks (Fig. 2. c–e).
Fig. 2.
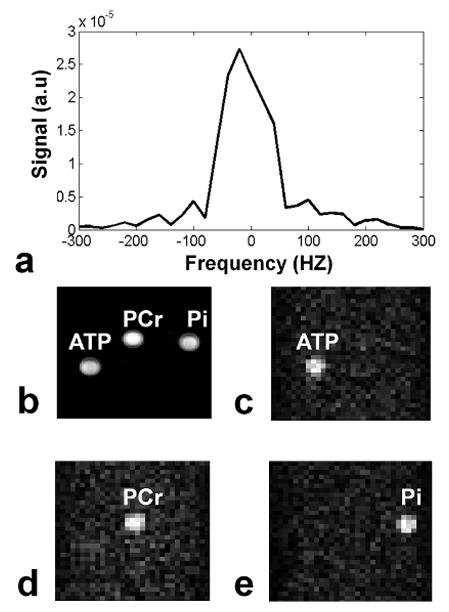
a) Experimentally derived bandwidth profile of the Gaussian excitation pulse (FWHM: 122 Hz). The bandwidth is narrow enough to avoid excitation of spins from unwanted resonances. b) 1H image of all three phantoms. c–e) Imaging resulting from the 3D spectrally selective TSE centered on the γ-ATP, PCr and Pi peaks respectively.
The mean relaxation values for all five volunteers are T1: 5.57 ± 0.26 s and T2: 365 ± 38 ms (mean ± SD). For the reference PCr phantoms, the T1 and T2 are 7.52 s and 250 ms, respectively.
Centric-ordered acquisition methods result in images with minimal T2 weighting, hence requiring less accurate knowledge of the local T2 in order to recover the concentration of certain spins from Eq.[2]. In our imaging experiments the center of k-space is sampled first, and at each subsequent ky line magnetization decays with T2 relaxation. This way of sampling results in modulation of the signal and creates blurring or ghosting artifacts in the image domain (30), the extent of which depends mainly on the T2 rate and the ETL length. To understand the extend of blurring from our 3D-TSE sampling scheme, we performed a simulation of the signal modulation during the ETL and estimated the resulting point spread function (PSF). The signal decay at each acquisition is shown in Fig. 3. a, while the resulting modulation in the ky direction is displayed in Fig. 3. b. A simulation of the blurring resulting from the 3D-TSE sequence on phantoms with relaxation parameters equal to those of the calf muscle is shown in Fig. 3. c. The PSF in the y-direction in Fig. 3. d results from the Fourier transform of the modulation in ky, and the FWHM is 1.6 pixels.
Fig. 3.
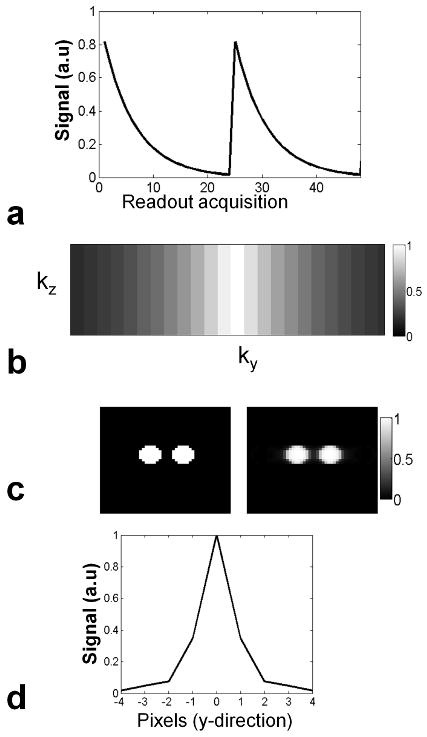
a) Signal decays during echo-train acquisition. The centre of k-space is sampled with maximum magnetization, while lines in the periphery are sampled with magnetization that has decayed due to T2 relaxation. After one ETL (24 echoes) is acquired, magnetization is allowed to recover to its steady state value, defined by TR and T1. The subsequent ETL is acquired in the next repetition of the pulse sequence. b) k-space signal modulation resulting from the implemented centric 3D-TSE sampling scheme. c) Blurring effect of the sampling scheme on a simulated phantom with relaxation parameters equal to those measured in the calf muscle of the volunteers. d) PSF resulting from the Fourier transform of the signal modulation in the y-direction with FWHM of 1.6 pixels.
From the average FA maps from two volunteers, in the volume of the calf muscle, the mean ± standard deviation of the FA was equal to 92.6 ± 6.3 degrees.
The mean SNR of the acquired PCr images as a function of acquisition time is shown in Fig. 4. a. The SNR, defined as the mean signal intensity of the entire calf muscle divided by the standard deviation of the noise, for three averages (i.e 9 min and 36 s) is 9.6 ± 0.7 (mean ± SD) and 14.0 ± 1.5 for eight averages (i.e 25 min and 36 s). An example of a PCr image in one of the volunteers (with eight averages) is shown in Fig. 4. b The PCr image (top) has been bilinearly interpolated to match the matrix size of the anatomical 1H image (bottom).
Fig. 4.
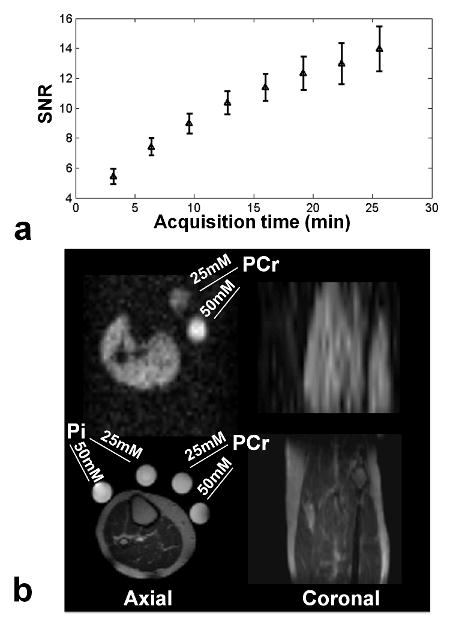
a) Mean and standard deviation of the SNR as a function of acquisition time (i.e number of averages) for all the five volunteers. b) Example of axial (left) and coronal slices (right) of a volunteer acquired in 25 min (eight averages). The PCr images have been bilinearly interpolated to match the matrix size of the 1H image for visualization purposes.
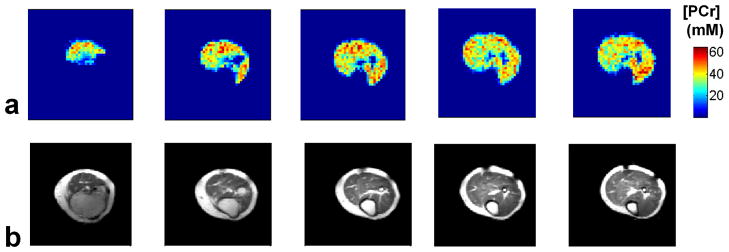
After signal correction (for T1, T2 and FA) using Eq.[1–2], PCr concentration maps are generated (Fig. 5. a). The muscle/bone anatomy can be identified in the corresponding 1H cross-sectional images. The mean PCr concentration in the calf muscle is 29.4 ± 2.5 mM in the recruited healthy volunteers.
Fig. 5.
a) Representative PCr concentration maps (axial plane) of the calf muscle obtained from one of the healthy volunteer. The PCr concentration maps are reconstructed by correcting for T1, T2 and FA, without any spatial interpolation. b) Corresponding 1H anatomical slices.
DISCUSSION
The main aim of this study was to develop a method to quantitatively map PCr concentration in the entire human calf muscle at high spatial resolution on a 3T clinical system within clinically relevant acquisition time. Most quantitative studies in literature use either unlocalized or localized single or large multi-voxel MRS methods that require additional assumptions about the origin of the signal due to partial volume effects (1–7,15,33,14). Absolute quantification of metabolite concentration in the entire calf muscle is possible in this study with the use of a volume coil, which is not limited by penetration depth restrictions that are typical of surface coils.
PCr as well as other 31P metabolites have long T1 relaxation times, especially at 3T (34,17). Long T1 rates limit the SNR efficiency of imaging sequences due to the requirement for long repetition times. In this study, T1 of PCr in the muscle was measured at 5.57 s, which requires a repetition time of 17.5 s for 95 % relaxation and 27.5 s for 99% relaxation. For the employed TR (12 s), steady state magnetization is reached at 88.4% of the equilibrium magnetization. It is important to mention that the T1 values measured for PCr in this study are not the true longitudinal relaxation times, but rather apparent T1 values, since PCr undergoes chemical exchanges with other metabolites (i.e. ATP) (35,36). The real T1 rates can be measured with magnetization transfer experiments, taking into account the chemical exchange rates between the different metabolites.
T2 rates of 31P metabolites are relatively long (365 ms in this case for PCr), and justify the use of turbo spin-echo (TSE) approaches for efficient sampling, at the expense of blurring along the direction in which the ETL is sampled. The FWHM of the PSF in our study is 1.6 pixels in the y-direction for an acquisition time accelerated twenty four-fold. Several ways have been suggested in the literature to reduce TSE blurring, or divide blurring between the two phase encode directions, and will be investigated in future studies (30).
The mean PCr concentration in the calf muscles of the five recruited volunteers is 29.4 ± 2.5 mM (mean ± SD) is very close to the concentrations obtained with MRS methods and published in the literature (37,7,15,33). The main advantage of this high-resolution 3D-imaging approach, (0.52 ml voxel), is the reduction of partial volume effects (from bones and blood vessels) that in coarser resolutions requires complicated assumptions about the origin of the signal. We achieved SNR of 9.6 ± 0.7 (mean ± SD) in less than 10 min, in the case of PCr. Therefore multiple metabolites can be imaged, such as Pi, although at lower SNR due to the lower concentration of inorganic phosphate, by shifting the frequency of the selective pulse as described elsewhere (27).
According to Eq.[2], PCr concentration can be recovered after signal correction for FA, T1 and T2. In our experiment, we measure bulk T1 and T2 relaxation parameters and we apply corrections to the voxel signal of the entire muscle. However, local variations are expected due to muscle fibre composition. This approach can introduce large errors when the images are heavily T1 and T2 weighted. For long TR and short effective echo (12 s and 26 ms respectively), T1 and T2 weighting are minimal and the errors are expected to be at the noise level.
One of the limitations of this study is that FA mapping was performed only in a subset of the imaged population. Although the same volume can be imaged every time (with the center of imaging volume coinciding with the isocenter of the magnet), B1 (and therefore FA) distribution will vary among volunteers. A more robust approach would require FA maps from each subject at each imaging session. Traditional spin-echo approaches, such as the one used here, require long acquisition times especially for long T1 species (1 hr and 4 min) and cannot be used for every imaging session. More rapid FA mapping sequences need to be explored in the future.
In most 31P metabolites (including PCr) chemical shift anisotropy (CSA) is a competing relaxation mechanism (17,38) with an effect on T1 rate that is inversely proportional to field strength. T1 rates of PCr showed a 40% decrease at 7T compared to 3T as reported in other studies (17). Therefore, 31P imaging at 7T will not only result in SNR increase due to increased polarization but would also allow the reduction of repetition time, and both combined will increase time efficiency of the imaging sequences.
The measurement of baseline concentration of PCr alone is of limited clinical importance when it is not combined with additional measurements, such as PCr resynthesis rates (9,39) and saturation transfer measurements that determine the synthesis rate of ATP in the resting stage (40). In this technical note, we demonstrated the potential of our imaging sequence and setup (i.e. birdcage coil) for imaging 31P metabolites quantitatively in the entire calf muscle without contamination caused by signal from other peaks. In the future, we would like to use this setup to image both PCr and Pi, although the latter would be imaged at lower SNR or spatial resolution due to the lower concentration of inorganic phosphate. In addition, by adding a preparation module (i.e. selective saturation of ATP), we could image PCr to measure spatially the chemical exchange rates between the two metabolites. Finally, we could implement this sequence using lower spatial and accelerated temporal resolution to image the recovery of PCr after exercise, which is an accepted index of mitochondrial metabolism, to map the resynthesis rates of PCr in various muscles of the human calf.
Acknowledgments
Grant sponsor: The authors would like to acknowledge the support by research grants RO1 AR053133, RO1 AR056260, and RO1 AR060238 from the National Institute of Arthritis and Musculoskeletal and Skin Diseases (NIAMS), National Institutes of Health (NIH).
References
- 1.Chance B, Eleff S, Leigh JS. Non-invasive, non-destructive approaches to cell bioenergetics. Proc Natl Acad Sci USA. 1980;77(12):7430–7434. doi: 10.1073/pnas.77.12.7430. [DOI] [PMC free article] [PubMed] [Google Scholar]
- 2.Chance B, Eleff S, Leigh JS, Sokolow D, Sapega A. Mitochondrial regulation of phosphocreatine inorganic-phosphate ratios in exercising human-muscle- a gated 31P NMR study. Proc Natl Acad Sci USA. 1981;78(11):6714–6718. doi: 10.1073/pnas.78.11.6714. [DOI] [PMC free article] [PubMed] [Google Scholar]
- 3.Newman RJ, Bore PJ, Chan L, Gadian DG, Styles P, Taylor D, Radda GK. Nuclear magnetic-resonance studies of forearm muscle in Duchenne dystrophy. Brit Med J. 1982;284(6322):1072–1074. doi: 10.1136/bmj.284.6322.1072. [DOI] [PMC free article] [PubMed] [Google Scholar]
- 4.Bottomley PA, Charles HC, Roemer PB, Flamig D, Engeseth H, Edelstein WA, Mueller OM. Human invivo phosphate metabolite imaging with 31P NMR. Magn Reson Med. 1988;7(3):319–336. doi: 10.1002/mrm.1910070309. [DOI] [PubMed] [Google Scholar]
- 5.Venkatasubramanian PN, Mafee MF, Barany M. Quantitation of phosphate metabolites in human leg invivo. Magn Reson Med. 1988;6(3):359–363. doi: 10.1002/mrm.1910060314. [DOI] [PubMed] [Google Scholar]
- 6.Bottomley PA, Hardy CJ, Roemer PB. Phosphate metabolite imaging and concentration measurements in human heart by nuclear magnetic resonance. Magn Reson Med. 1990;14(3):425–434. doi: 10.1002/mrm.1910140302. [DOI] [PubMed] [Google Scholar]
- 7.Dunn JF, Kemp GJ, Radda GK. Depth selective quantification of phosphorus metabolites in human calf muscle. NMR Biomed. 1992;5(3):154–160. doi: 10.1002/nbm.1940050309. [DOI] [PubMed] [Google Scholar]
- 8.Miller RG, Boska MD, Moussavi RS, Carson PJ, Weiner MW. 31P nuclear magnetic resonance studies of high-energy phosphates and pH in human-muscle fatigue-comparison of aerobic and anaerobic exercise. J Clin Invest. 1988;81(4):1190–1196. doi: 10.1172/JCI113434. [DOI] [PMC free article] [PubMed] [Google Scholar]
- 9.Kemp GJ, Taylor DJ, Radda GK. Control of phosphocreatine resynthesis during recovery from exercise in human skeletal-muscle. NMR Biomed. 1993;6(1):66–72. doi: 10.1002/nbm.1940060111. [DOI] [PubMed] [Google Scholar]
- 10.Prompers JJ, Jeneson JAL, Drost MR, Oomens CCW, Strijkers GJ, Nicolay K. Dynamic MRS and MRI of skeletal muscle function and biomechanics. NMR Biomed. 2006;19(7):927–953. doi: 10.1002/nbm.1095. [DOI] [PubMed] [Google Scholar]
- 11.Haseler LJ, Lin A, Hoff J, Richardson RS. Oxygen availability and PCr recovery rate in untrained human calf muscle: evidence of metabolic limitation in normoxia. Am J Physiol-Reg I. 2007;293(5):R2046–R2051. doi: 10.1152/ajpregu.00039.2007. [DOI] [PubMed] [Google Scholar]
- 12.Schrauwen-Hinderling VB, Kooi ME, Hesselink MKC, Jeneson JAL, Backes WH, van Echteld CJA, van Engelshoven JMA, Mensink M, Schrauwen P. Impaired in vivo mitochondrial function but similar intramyocellular lipid content in patients with type 2 diabetes mellitus and BMI-matched control subjects. Diabetoliogia. 2007;50(1):113–120. doi: 10.1007/s00125-006-0475-1. [DOI] [PubMed] [Google Scholar]
- 13.Phielix E, Mensink M. Type 2 diabetes mellitus and skeletal muscle metabolic function. Physiol Behav. 2008;94(2):252–258. doi: 10.1016/j.physbeh.2008.01.020. [DOI] [PubMed] [Google Scholar]
- 14.Banerjee B, Sharma U, Balasubramanian K, Kalaivani M, Kalra V, Jagannathan NR. Effect of creatine monohydrate in improving cellular energetics and muscle strength in ambulatory Duchenne muscular dystrophy patients: a randomized, placebo-controlled (31)P MRS study. Magn Reson Imaging. 2010;28(5):698–707. doi: 10.1016/j.mri.2010.03.008. [DOI] [PubMed] [Google Scholar]
- 15.Doyle VL, Payne GS, Collins DJ, Verrill MW, Leach MO. Quantification of phosphorus metabolites in human calf muscle and soft-tissue tumours from localized MR spectra acquired using surface coils. Phys Med Biol. 1997;42(4):691–706. doi: 10.1088/0031-9155/42/4/006. [DOI] [PubMed] [Google Scholar]
- 16.Chmelik M, Schmid AI, Gruber S, Szendroedi J, Krssak M, Trattnig S, Moser E, Roden M. Three-dimensional high-resolution magnetic resonance spectroscopic imaging for absolute quantification of P-31 metabolites in human liver. 2008;60(4):796–802. doi: 10.1002/mrm.21762. [DOI] [PubMed] [Google Scholar]
- 17.Bogner W, Chmelik M, Schmid AI, Moser E, Trattnig S, Gruber S. Assessment of (31)P Relaxation Times in the Human Calf Muscle: A Comparison between 3 T and 7 T In Vivo. Magn Reson Med. 2009;62(3):574–582. doi: 10.1002/mrm.22057. [DOI] [PubMed] [Google Scholar]
- 18.Kobus T, Bitz AK, van Uden MJ, Lagemaat MW, Rothgang E, Orzada S, Heerschap A, Scheenen TWJ. In Vivo 31P MR spectroscopic imaging of the human prostate at 7 T: Safety and feasibility. 2012:n/a–n/a. doi: 10.1002/mrm.24175. [DOI] [PubMed] [Google Scholar]
- 19.Lustig M, Donoho D, Pauly JM. Sparse MRI: The application of compressed sensing for rapid MR imaging. Magn Reson Med. 2007;58(6):1182–1195. doi: 10.1002/mrm.21391. [DOI] [PubMed] [Google Scholar]
- 20.Kampf T, Fischer A, Basse-Luesebrink TC, Ladewig G, Breuer F, Stoll G, Jakob PM, Bauer WR. Application of compressed sensing to in vivo 3D (19)F CSI. J Magn Reson. 2010;207(2):262–273. doi: 10.1016/j.jmr.2010.09.006. [DOI] [PubMed] [Google Scholar]
- 21.Chao H, Bowers JL, Holtzman D, Mulkern RV. Multi-echo 31P spectroscopic imaging of ATP: A scan time reduction strategy. J Magn Reson Im. 1997;7(2):425–433. doi: 10.1002/jmri.1880070229. [DOI] [PubMed] [Google Scholar]
- 22.Chao H, Bowers JL, Holtzman D, Mulkern RV. RARE imaging of PCr in human forearm muscles. J Magn Reson Im. 1997;7(6):1048–1055. doi: 10.1002/jmri.1880070617. [DOI] [PubMed] [Google Scholar]
- 23.Greenman RL, Elliott MA, Vandenborne K, Schnall MD, Lenkinski RE. Fast imaging of phosphocreatine using a RARE pulse sequence. Magn Reson Med. 1998;39(5):851–854. doi: 10.1002/mrm.1910390523. [DOI] [PubMed] [Google Scholar]
- 24.Greenman RL, Axel L, Ferrari VA, Lenkinski RE. Fast imaging of phosphocreatine in the normal human myocardium using a three-dimensional RARE pulse sequence at 4 tesla. J Magn Reson Im. 2002;15(4):467–472. doi: 10.1002/jmri.10081. [DOI] [PubMed] [Google Scholar]
- 25.Greenman RL. Quantification of the P-31 metabolite concentration in human skeletal muscle from RARE image intensity. Magn Reson Med. 2004;52(5):1036–1042. doi: 10.1002/mrm.20258. [DOI] [PubMed] [Google Scholar]
- 26.Greenman RL, Smithline HA. The feasibility of measuring phosphocreatine recovery kinetics in muscle using a single-shot (31)P RARE MRI sequence. Acad Radiol. 2011;18(7):917–923. doi: 10.1016/j.acra.2011.02.014. [DOI] [PMC free article] [PubMed] [Google Scholar]
- 27.Greenman RL, Wang X, Smithline HA. Simultaneous acquisition of phosphocreatine and inorganic phosphate images for Pi:PCr ratio mapping using a RARE sequence with chemically selective interleaving. Magn Reson Imaging. 2011;29(8):1138–1144. doi: 10.1016/j.mri.2011.05.001. [DOI] [PMC free article] [PubMed] [Google Scholar]
- 28.Hennig J, Nauerth A, Friedburg H. RARE imaging-a fast imaging method for clinical MR. Magn Reson Med. 1986;3(6):823–833. doi: 10.1002/mrm.1910030602. [DOI] [PubMed] [Google Scholar]
- 29.Magland J, Wehrli FW. Pulse sequence programming in a dynamic visual environment. Proc ISMRM; 2006; Seattle WA. p. 578. [DOI] [PMC free article] [PubMed] [Google Scholar]
- 30.Kholmovski EG, Parker DL, Alexander AL. A generalized k-sampling scheme for 3D fast spin echo. J Magn Reson Im. 2000;11(5):549–558. doi: 10.1002/(sici)1522-2586(200005)11:5<549::aid-jmri11>3.0.co;2-g. [DOI] [PubMed] [Google Scholar]
- 31.Insko EK, Bolinger L. Mapping of the radiofrequency field. J Magn Reson Ser A. 1993;103(1):82–85. [Google Scholar]
- 32.Greenman RL, Rakow-Penner R. Evaluation of the RF field uniformity of a double-tuned P-31/H-1 birdcage RF coil for spin-echo MRI/MRS of the diabetic foot. J Magn Reson Imag. 2005;22(3):427–432. doi: 10.1002/jmri.20372. [DOI] [PubMed] [Google Scholar]
- 33.Kemp GJ, Meyerspeer M, Moser E. Absolute quantification of phosphorus metabolite concentrations in human muscle in vivo by P-31 MRS: a quantitative review. NMR Biomed. 2007;20(6):555–565. doi: 10.1002/nbm.1192. [DOI] [PubMed] [Google Scholar]
- 34.Meyerspeer M, Krssak M, Moser E. Relaxation times of P-31-metabolites in human calf muscle at 3 T. Magnetic Resonance in Medicine. 2003;49(4):620–625. doi: 10.1002/mrm.10426. [DOI] [PubMed] [Google Scholar]
- 35.Alger JR, Shulman RG. NMR-studies of enzymatic rates invitro and invivio by magnetization transfer. Q Rev Biophys. 1984;17(1):83–124. doi: 10.1017/s0033583500005266. [DOI] [PubMed] [Google Scholar]
- 36.Galban CJ, Spencer RG. Measurement of spin-lattice relaxation times and chemical exchange rates in multiple-site systems using progressive saturation. Magn Reson Med. 2007;58(1):8–18. doi: 10.1002/mrm.21185. [DOI] [PubMed] [Google Scholar]
- 37.Roth K, Hubesch B, Meyerhoff DJ, Naruse S, Gober JR, Lawry TJ, Boska MD, Matson GB, Weiner MW. Noninvasive quantitation of phosphorus metabolites in human tissue by NMR spectroscopy. J Magn Reson. 1989;81(2):299–311. [Google Scholar]
- 38.Bogner W, Chmelik M, Andronesi OC, Sorensen AG, Trattnig S, Gruber S. In Vivo (31)P Spectroscopy by Fully Adiabatic Extended Image Selected In Vivo Spectroscopy: A Comparison Between 3 T and 7 T. Magn Reson Med. 2011;66(4):923–930. doi: 10.1002/mrm.22897. [DOI] [PubMed] [Google Scholar]
- 39.Meyerspeer M, Robinson S, Nabuurs C, Scheene T, Schoisengeier A, Unger E, Kemp GJ, Moser E. Comparing localized and nonlocalized dynamic 31P magnetic resonance spectroscopy in exercising muscle at 7T. Magn Reson Med. doi: 10.1002/mrm.24205. [DOI] [PMC free article] [PubMed] [Google Scholar]
- 40.Schmid AI, Schrauwen-Hinderling VB, Andreas M, Wolzt M, Moser E, Roden M. Comparison of measuring energy metabolism by different 31P-magnetic resonance spectroscopy techniques in resting, ischemic, and exercising muscle. Magn Reson Med. doi: 10.1002/mrm.23095. [DOI] [PubMed] [Google Scholar]


