

Abstract
BACKGROUND AND PURPOSE
IFN-γ levels are increased in chronic obstructive airway disease (COPD) patients compared with healthy subjects and are further elevated during viral exacerbations. IFN-γ can ‘prime’ macrophages to enhance the response to toll-like receptor (TLR) ligands, such as LPS. The aim of this study was to examine the effect IFN-γ on corticosteroid sensitivity in alveolar macrophages (AM).
EXPERIMENTAL APPROACH
AM from non-smokers, smokers and COPD patients were stimulated with IFN-γ and/or LPS with or without dexamethasone. IL-6, TNF-α and IFN-γ-induced protein 10 kDa (IP-10) levels were measured by elisa, and Western blots were used to investigate the IFN-γ-stimulated Janus kinase (JAK)/signal transducer and activator of transcription (STAT) signalling pathway. Real-time PCR and flow cytometry were used to investigate TLR levels following IFN-γ treatment.
KEY RESULTS
In all three subject groups, IFN-γ alone had no effect on IL-6 and TNF-α production but enhanced the effects of LPS on these cytokines. In contrast, IFN-γ alone increased the production of IP-10. IFN-γ increased TLR2 and TLR4 expression in AM. Cytokine induction and STAT1 activation by IFN-γ were insensitive to dexamethasone for all groups. The inhibition of JAK and STAT1 repressed all these IFN-γ effects.
CONCLUSIONS AND IMPLICATIONS
Our results demonstrate that IFN-γ–induced STAT-1 signalling is corticosteroid resistant in AMs, and that targeting IFN-γ signalling by JAK inhibitors is a potentially novel anti-inflammatory strategy in COPD.
Keywords: COPD, alveolar macrophage, IFN-γ priming, corticosteroid insensitivity, JAK/STAT, IP-10, TNF-α, IL-6, toll-like receptors
Introduction
Chronic obstructive airway disease (COPD) is characterized by persistent and progressive airway inflammation and obstruction (Rabe et al., 2007). Corticosteroids are the most widely used anti-inflammatory treatment for COPD; these drugs reduce cytokine production by suppressing the activity of transcription factors such as NF-κB and AP-1 (Adcock et al., 2004). However, the clinical benefits of corticosteroids are limited, and novel anti-inflammatory drugs are needed for COPD patients (Barnes, 2010).
IFN-γ is produced by Th1 lymphocytes and is an essential component of the host immune responses to pathogens, including viruses (Schoenborn and Wilson, 2007). There is evidence that IFN-γ signalling is increased in the lungs of COPD patients; IFN-γ levels are raised in the airways of COPD patients (Panzner et al., 2003; Hens et al., 2008; Reeves et al., 2010), the number of IFN-γ–producing lymphocytes are increased in the lungs of COPD patients (Saetta et al., 2002), and disease severity correlates with IFN-γ production by CD8 cells (Zhu et al., 2009). This increase in IFN-γ is not simply due to smoking, as CD8 cells from COPD patients release more IFN-γ than those from current smokers without COPD (Lethbridge et al., 2010). Furthermore, viruses are a major cause of COPD exacerbations, and the levels of IFN-γ are increased in COPD patients during virus-triggered exacerbations (Grumelli et al., 2004; Makris et al., 2008; Singh et al., 2010).
Macrophage numbers are increased in the airways of COPD patients, and play a central role in disease pathophysiology through the secretion of chemokines, cytokines and proteases (Barnes, 2004). IFN-γ activates the Janus kinase (JAK) – signal transducer and activator of transcription (STAT) intracellular signal pathway in macrophages, through phosphorylation of JAK2 leading to phosphorylation of STAT1 (Darnell et al., 1994). JAK-induced phosphorylation of STAT1 initiates dimerization, translocation to the nucleus and the transcription of IFN-γ-inducible genes (reviewed in Stark, 2007). Phosphorylation of STAT1 occurs on two residues, Y701 and S727, with maximal STAT1 activity only seen after phosphorylation of both residues (Kovarik et al., 1998).
IFN-γ can ‘prime’ macrophages to give an enhanced response to TLR ligands, such as the TLR4 ligand LPS (Schroder et al., 2004). This increased TLR response could be due to co-operation at the promoter regions of inflammatory genes between STAT1 and NF-κB activated by IFN-γ and TLR signalling respectively (Gough et al., 2008). Alternatively, this increased response may be due to IFN-γ upregulation of the expression of TLR signalling components (reviewed in (Schroder et al., 2006). There is also evidence that IFN-γ can disrupt negative feedback loops for TLR signalling, therefore amplifying the TLR response (reviewed in (Hu et al., 2008).
Chronic bacterial colonization is common in COPD patients, and it has been estimated that bacteria are responsible for approximately 50% of COPD exacerbations (Sethi and Murphy, 2008). For this reason, the molecular mechanisms responsible for corticosteroid insensitivity in COPD have often been studied in LPS-stimulated alveolar macrophages (AMs) (Armstrong et al., 2009). These models do not account for the possible ‘priming’ effect of IFN-γ on subsequent TLR responses. As IFN-γ levels are raised in the airways of stable COPD patients (Reeves et al., 2010), it is likely that this phenomenon is clinically relevant. Additionally, bacterial infections commonly occur after a viral exacerbation in COPD patients when IFN-γ levels are likely to be further increased (Wilkinson et al., 2006).
The primary aim of this study was to investigate whether IFN-γ enhances LPS responses in COPD AMs, and whether such responses are less sensitive to the effects of corticosteroids than LPS stimulation alone. We also evaluated the anti-inflammatory effects of targeting IFN-γ signalling using a selective JAK inhibitor. Our results demonstrate that STAT1 signalling is corticosteroid-resistant in AMs, and that targeting IFN-γ signalling using JAK inhibitors is a potentially novel anti-inflammatory strategy in COPD.
Methods
Study subjects
In total, samples from 18 non-smokers (NS), 40 smokers (S) and 56 COPD patients undergoing surgical resection for suspected or confirmed lung cancer (Table 1) were used in this study. Samples from subgroups of these patients were used for individual experiments, with numbers described in figure legends. None of the subjects had a recent history of chest infections or disease exacerbation. COPD was diagnosed based on a history of smoking for >10 pack-years, typical symptoms (productive cough, breathlessness or wheeze) and airflow obstruction, defined as forced expiratory volume in 1 s (FEV1) <80% predicted, and FEV1/ forced vital capacity (FVC) ratio <0.7, corresponding to Gold stages II to III (http://www.goldcopd.com). Subjects with a smoking history but normal pulmonary function were categorized as smokers. The South Manchester Research Ethics Committee approved this study, and written informed consent for each patient was obtained.
Table 1.
Subject demographics
| Non-smokers | Smokers | COPD | |
|---|---|---|---|
| Subjects | 18 | 40 | 56 |
| Age | 61.2 ± 14.8 | 65.9 ± 9.4 | 65.5 ± 7.0 |
| Sex (F/M) | 7/11 | 22/18 | 30/26 |
| Smoking history | 0 | 39.6 ± 23.7 | 46.8 ± 29.6 |
| Smoking status (Current/Ex) | N/A | 18/22 | 41/15 |
| FEV1% predicted | 104 ± 43.8 | 95.1 ± 21.1 | 64.4 ± 17.9 |
| FEV1/FVC% | 0.77 ± 0.06 | 0.75 ± 0.06 | 0.60 ± 0.09 |
Data presented as mean ± SD. COPD = chronic obstructive airway disease; FEV = forced expiratory volume; FVC = forced vital capacity; N/A = not applicable.
Cell culture
Cell culture methods are fully described in the online repository. Briefly, AMs were isolated from re-sected lung tissue and cultured at 37°C, 5% CO2 in supplemented RPMI-1640. AM were treated with 100 ng·mL−1 (1000 IU·mL−1) of IFN-γ for 16 h as preliminary kinetic studies showed that this concentration induces a robust, but sub-maximal, enhancement in LPS-stimulated TNF-α release (Supporting Information Figure S1). The cells were treated with JAK inhibitor 1 for 2 h or fludarabine for 24 h (Srinivasan et al., 2006) before stimulation with IFN-γ and/or 1 µg·mL−1 LPS. Armstrong et al. (2009) showed that stimulation of AM with 1 µg·mL−1 LPS for 24 h induced a submaximal effect. Corticosteroid experiments involved IFN-γ treatment prior to incubation with dexamethasone and subsequent stimulation with LPS. Supernatants were removed for cytokine analysis and cells lysed for protein or mRNA extraction. THP-1 cells were obtained from the European Collection of Cell Cultures (ECACC), Health Protection Agency, UK and cultured following ECACC guidelines (http://www.hpacultures.org.uk) and treated in the same way as the AM.
Cell viability assay
Mitochondrial dehydrogenase-dependent reduction of tetrazolium salt, 3-(4,5-dimethylthiazol-2-yl)-2,5-diphenyltetrazolium bromide (Sigma-Aldrich, Poole, UK), to formazan was used to measure cell viability. Cells treated with vehicle alone were used as controls and given the value of 100% viable. Neither JAK inhibitor 1 nor fludarabine caused a significant loss of cell viability (data not shown).
Cytokine assays
Supernatants were analysed by elisa, performed according to manufacturer's instructions (R and D systems, Abingdon, UK), to quantify TNF-α, IL-6 and IP-10 levels. The lower limits of quantification were 15.6 pg·mL−1 for TNFα, 9.4 pg·mL−1 for IL-6 and 31.25 pg·mL−1 for IP-10. Values below the lower level of detection were assigned a value of half the lower limit of detection (the mean of zero and the lowest standard) (Laan et al., 2002).
Western blots
The following antibodies were used; rabbit anti-phospho-STAT1 (Y701), rabbit anti-phospho-STAT1 (S727), rabbit anti-phospho-GR (S211) (all Cell Signalling Technology, Inc., Beverly, MA, USA), rabbit anti-β actin (Abcam Ltd., Cambridge, UK) and horseradish peroxidise-conjugated goat anti-rabbit (DakoCytomation California Inc., Carpinteria, CA, USA). The full experimental method is described in the online repository. Densitometric analysis was performed by normalizing band density to that for β-actin using Quantity One v4.6.1 software (Bio-Rad, Hercules, CA, USA).
RNA extraction and PCR
RNA purification and PCR methods are described in full in the online repository. Relative expression levels in IFN-γ stimulated cells were determined using the 2-ΔΔCt method normalizing to the endogenous control and to expression from time point matched unstimulated cells. Comparisons of TLR expression between S and COPD subjects used the 2-ΔCt method.
Flow cytometry
Flow cytometry methods for the measurement of cell surface TLR4 are described in full in the online repository. AM were treated with or without IFN-γ for 20 h prior to harvesting for analysis. Macrophages were identified using CD68 antibodies. TLR4 expression was quantified as mean PE fluorescence above IgG isotype control background.
Immunohistochemistry
Freshly resected lung tissue was fixed in formalin and paraffin-embedded. Slides were stained for phosphor-STAT1 (Y701) and percentage of positively stained AM calculated. The full methods for immunohistochemistry and image analysis are described in the online repository.
Data analysis
The primary aim of this study was to investigate the effects of dexamethasone on cytokine release from AM with and without exposure to IFN-γ. Our own data show that 21.5% difference in TNF-α production from AM can be demonstrated with 80% power with n= 7 samples (calculated using GraphPad Stat-Mate version 2.0, GraphPad Software, San Diego, CA, USA). Normality was assessed using the Kolmogorov–Smirnov test. TNF-α and IL-6 results were parametric, while IP-10 was non-parametric. Gene and protein expressions of TLR2 and 4 were non-parametric. Intragroup analysis was by either repeat measure anova with Bonferroni post-test for parametric data or Friedman test with Dunn post-test for non-parametric data. Intergroup analysis was by one-way anova with Bonferroni post-test or Kruskal–Wallis test with Dunn post-test. Effects of IFN-γ on TLR expression were analysed using Wilcoxon matched pairs test, while comparisons of expression between S and COPD subjects used the Mann–Whitney test. All statistical analysis was performed using Graphpad InStat version 5·00 (GraphPad Software Inc.; http://www.graphpad.com).
Results
The effects of IFN-γ on LPS-induced cytokine release
LPS stimulation of AM caused an increase in IL-6 and TNF-α release in all three subject groups after both 4 (Supporting Information Figure S2) and 24 h (Figure 1). The secretion of TNF-α, IL-6 and IP-10 from unstimulated or LPS-stimulated AMs was not statistically significantly different between COPD patients, S and NS after 4 h (Supporting Information Figure S2) or 24 h (Figure 1). IFN-γ alone did not stimulate TNF-α or IL-6 secretion (Figure 1 for 24 h results and Supporting Information Figure S1 for 4 h results). IFN-γ treatment before LPS stimulation enhanced TNF-α and IL-6 production at both 4 and 24 h in all subject groups, although for IL-6 at 4 h these numerical increases did not reach statistical significance (Supporting Information Figure S2B). There was no significant difference between the three subject groups in the absolute levels of TNF-α or IL-6 released by IFN-γ-treated AMs stimulated with LPS for 4 or 24 h. The fold-change in levels of LPS-stimulated TNF-α and IL-6 release by IFN-γ did not vary between groups after both 4 and 24 h LPS. IFN-γ alone induced IP-10 release (Supporting Information Figure 1C & Figure S2C). IFN-γ induced higher levels of IP-10 release in NS cells compared with COPD after 20 h (P= 0.015) (Supporting Information Figure S2C), but there was no difference after 40 h (Figure 1C). The addition of LPS after 16 h IFN-γ priming did not enhance IP-10 production.
Figure 1.
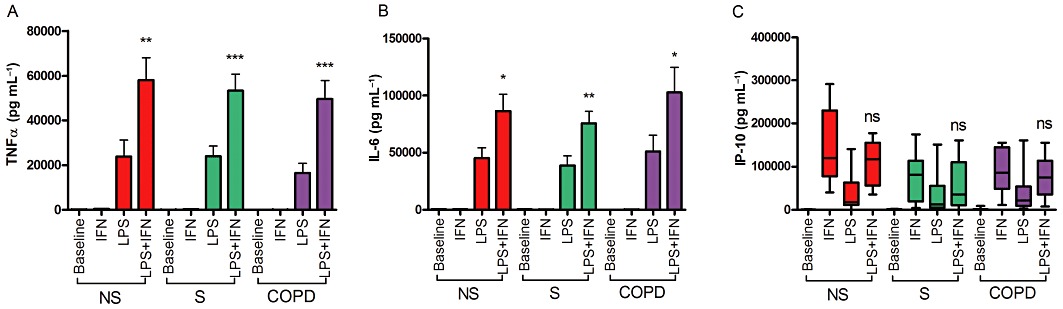
IFN-γ enhancement of LPS-stimuled AM from NS, S and COPD subjects. AM were treated with or without IFN-γ (100 ng·mL−1) for 16 h before stimulation with LPS (1 µg·mL−1) for 24 h. Culture supernatants were analysed for TNF-α (A), IL-6 (B) and IP-10 (C) levels by elisa. NS n= 8; S n= 8; COPD n= 7. Intragroup analysis was by repeated measures anova with Bonferroni post-test for TNF-α and IL-6, and Friedmen with Dunn post-test for IP-10. For all groups TNF-α and IL-6 anova results P < 0.0001. Friedmen results for IP-10 were P < 0.0002 for all groups. Intergroup analysis was by one-way anova or Kruskal–Wallis tests, with all results being non-significant. Post-test analysis results shown for LPS versus LPS + IFN-γ*P < 0.05; **P < 0.01; ***P < 0.001. Data presented as mean ± SEM for TNF-α and IL-6, and median, with whiskers showing total range, for IP-10.
The effect of corticosteroids on the IFN-γ response
Macrophages, from the subjects used in the experiments described earlier, were also incubated with dexamethasone. This drug suppressed LPS-induced IL-6 and TNF-α production (see Figure 2 and Supporting Information Figure S3 for dose response curves after 24 and 4 h respectively). The effect of dexamethasone on TNF-α release was reduced after IFN-γ treatment, with a lower percentage inhibition with 100 and 1000 nM dexamethasone in all three subject groups at both 4 and 24 h post LPS stimulation. There was also a significant reduction in the effects of dexamethasone on IL-6 release in all groups at 24 h post LPS (Figure 2). The reduction in the dexamethasone effect on Il-6 release after 4 h LPS only reach significance in the NS and COPD groups (Supporting Information Figure S3C). Absolute cytokine levels with and without IFN-γ priming are shown in Supporting Information Figures S4 and S5; TNF-α and IL-6 production after IFN-γ priming remained at high levels in the presence of dexamethasone.
Figure 2.
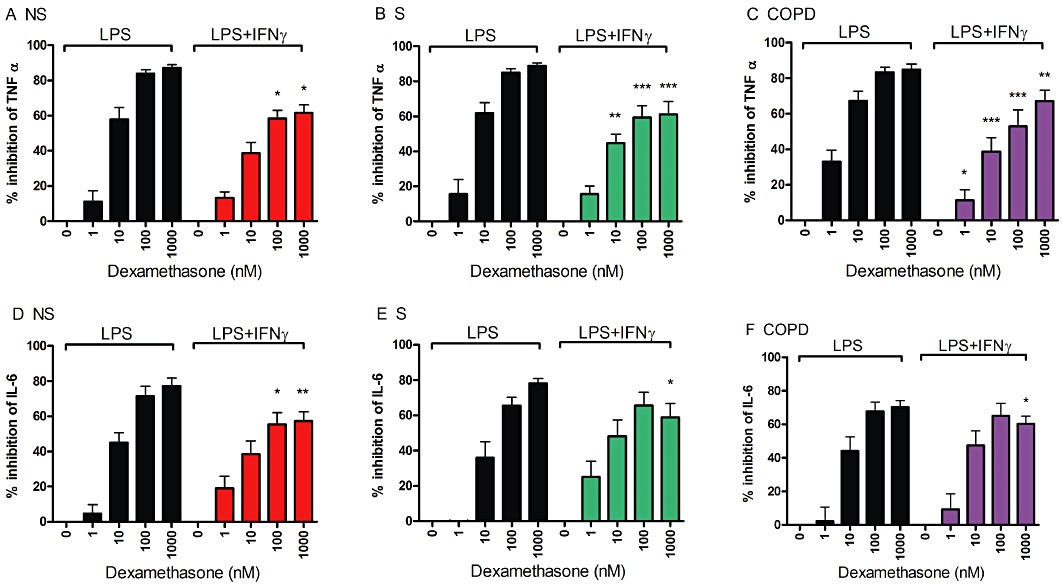
The effect of IFN-γ priming on the corticosteroid response in LPS-stimulated AM. Cells from n= 8 NS (A and D), n= 8 S (B and E) and n= 7 COPD subjects (C and F) were treated with or without IFN-γ (100 ng·mL−1) for 16 h before treatment with varying doses of dexamethasone for 1 h before stimulation with LPS (1 µg·mL−1) for 24 h. Culture supernatants were analysed for TNF-α (A–C) and IL-6 (D–F) levels by elisa. Data presented as mean % inhibition ± SEM of cytokine release by dexamethasone. Intragroup analysis was by repeated measures anova with P < 0.0001 for all results. Bonferroni post-test results for LPS versus LPS + IFN-γ at each dexamethasone concentration are shown: *P < 0.05; **P < 0.01; ***P < 0.001.
As IFN-γ alone induces IP-10 release, and this was not enhanced by LPS (Figure 1C & Supporting Information Figure S2C), AM were treated with dexamethasone for 1 h before stimulation with IFN-γ for 16 h or LPS for 24 h (Figure 3). Dexamethasone did not suppress IP-10 release in either condition, in all subject groups. We also observed no inhibitory effect of dexamethasone on IP-10 production from IFN-γ stimulated THP-1 cells (Supporting Information Figure S6).
Figure 3.
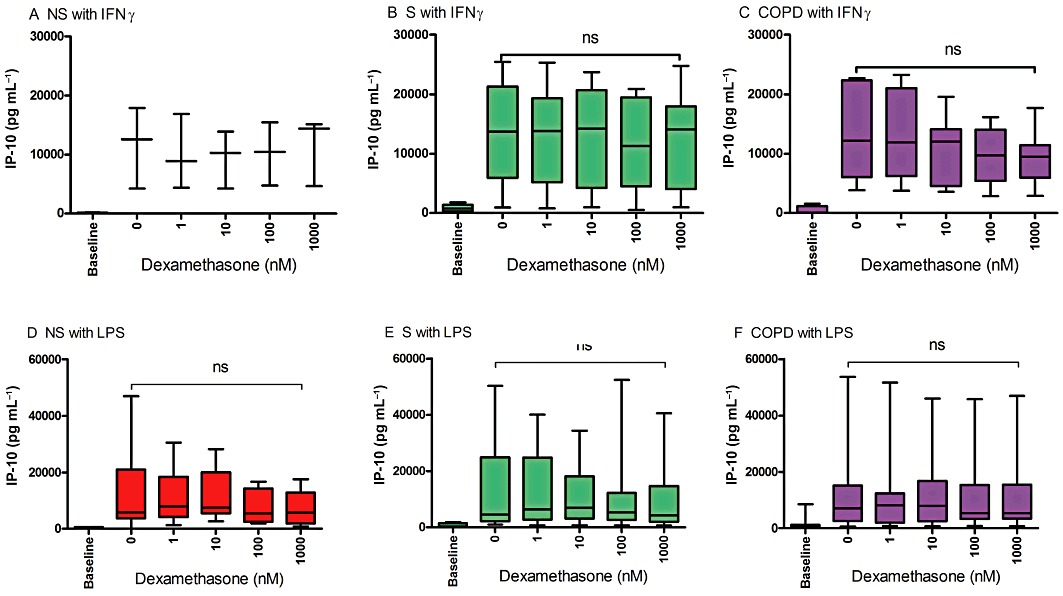
The effects of corticosteroids on IFN-γ and LPS-induced IP-10. AM were treated with dexamethasone for 1 h before stimulation with IFN-γ (100 ng·mL−1) (NS, n= 3; S, n= 8, COPD, n= 7) for 16 h (A-C) or LPS (1 µg·mL−1) (NS, n= 8; S, n= 8; COPD, n= 7) for 24 h (D–F). IP-10 levels in culture supernatants were measured by elisa. Data presented as median absolute levels of IP-10 (pg·mL−1) with whiskers showing total range. Intragroup analysis used the Freidmen test, with results for all conditions being non-significant (ns). Due to low sample numbers, statistical analysis could not be carried out on data depicted in (A).
The effect of dexamethasone on STAT1 activation
Phosphorylation of STAT1 residues Y701 and S727 were measured by Western blotting following stimulation with IFN-γ and LPS (Supporting Information Figure S7). IFN-γ stimulation caused rapid phosphorylation of Y701, with only a weak effect on S727. In comparison, LPS had a predominant effect on S727 phosphorylation. These findings are compatible with previous findings in U937-derived macrophages showing that IFN-γ has a specific effect on Y701 phosphorylation (Kovarik et al., 1998).
Macrophages were treated with 1 µM dexamethasone before stimulation with IFN-γ. Dexamethasone did not reduce activation of STAT1 at Y701 in cells from COPD patients, S or NS, or THP-1 cells; representative Western blots and corresponding densitometry analyses are shown in Figure 4 and Supporting Information Figure S8A. Band densitometry analysis of 10 repeat experiments with THP-1 cells, stimulated with IFN-γ for 10 min, showed no significant effects of dexamethasone on phosphorylation of STAT1 (Supporting Information Figure S8B). We observed concurrent activation of the glucocorticoid receptor (GR) through phosphorylation of S211.
Figure 4.
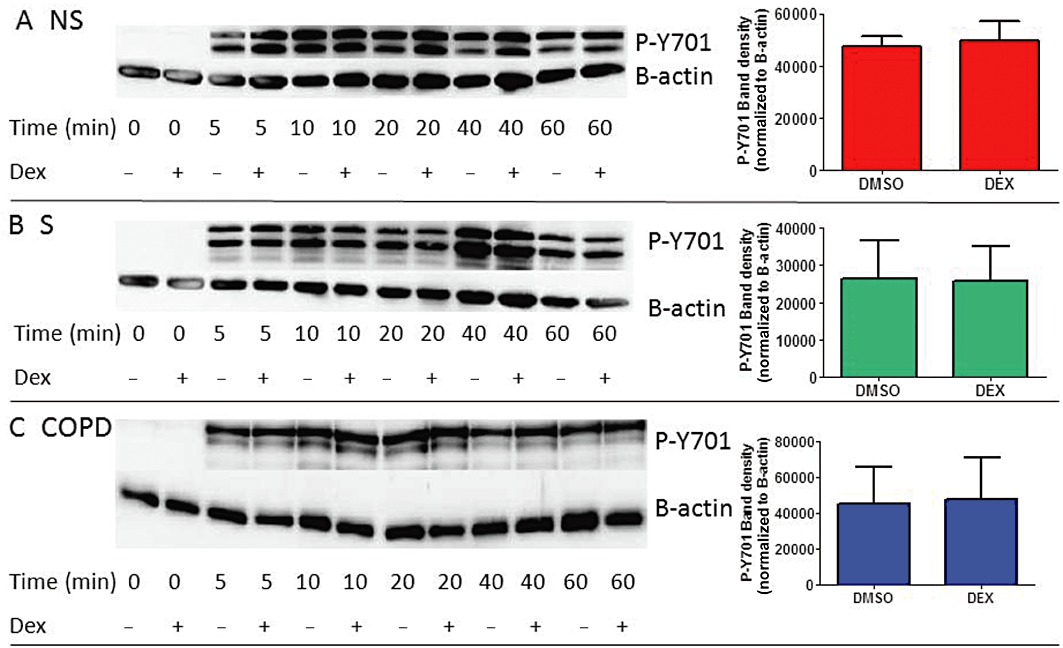
The effect of corticosteroids on IFN-γ-induced STAT1 activation. Western blots using cell lysates from NS (A), S (B) and COPD patients (C) AM treated with or without dexamethasone (1 µM) for 1 h before stimulation with IFN-γ (100 ng·mL−1) for 0–60 min. Blots were probed with antibodies for Phospho-Y701 STAT1 and the loading control β-actin. Results presented are representative blots from n= 3 experiments for each subject group. Densitometry analysis of phosphorylated STAT1 (Y701) stimulated with IFN-γ for 10 min ± dexamethasone is shown for each subject group. Data are presented as mean P-Y701 (±SEM) normalized to β-actin loading control for n= 3 subjects for each group.
Effects of JAK and STAT Inhibitors
AMs from COPD patients and smokers were used to investigate the effects of JAK and STAT1 inhibitors. As IFN-γ similarly up-regulated corticosteroid-resistant STAT1 phosphorylation in healthy and COPD cells, the data from COPD patients (n= 2) and smokers (n= 7) were combined for this analysis. The highest concentrations of the JAK inhibitor 1 (1 µM) and the STAT1 inhibitor fludarabine (50 µM) suppressed IFN-γ- induced IP-10 production by 92.6 and 55.5%, respectively (Figure 5A, B). Similarly, Figure 5C and D show that the JAK inhibitor 1 reduced STAT1 phosphorylation by 82.9%, while fludarabine had a 27.6% inhibitory effect.
Figure 5.
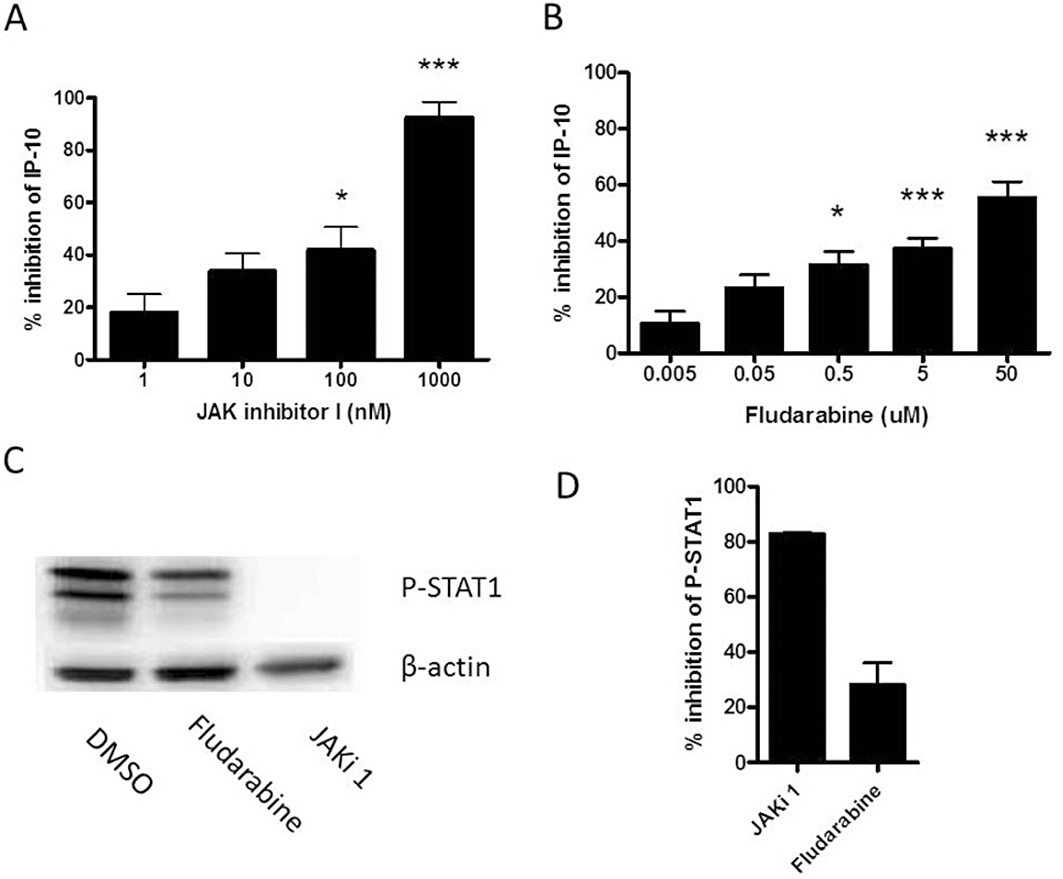
Effects of JAK and STAT1 inhibitors on IFN-γ stimulated AM. Cells from COPD (n= 2) and S (n= 5) were treated with JAK inhibitor 1 (JAKi 1, 1–1000 nM) for 2 h or fludarabine (0.005–50 µM) for 24 h before stimulation with IFN-γ (100 ng·mL−1) for either 16 h for measuring IP-10 release (A and B) or 10 min for Western blots (C). Band densitometry, from n= 3 blots using COPD cell lysates, was used to calculate % inhibition of STAT1 activation following treatment with JAK inhibitor 1 and fludarabine (D). The Friedmen test was used to evaluate inhibition of absolute levels of IP-10 release by 1 µM JAK inhibitor 1 (P < 0.0001) and 50 µM fludarabine (P < 0.0001). Dunn's post-test results for no drug versus drug are shown: *P < 0.05; ***P < 0.001. Data presented as mean % inhibition ± SEM.
The role of the JAK/STAT pathway in the IFN-γ primed LPS response was studied by treating AM from S and COPD subjects with JAK inhibitor I before stimulating with IFN-γ for 16 h, followed by LPS for 24 h. Inhibition of JAK reduced the IFN-γ–enhanced IL-6 and TNF-α release to a similar level to that from AM stimulated with LPS alone (Figure 6).
Figure 6.
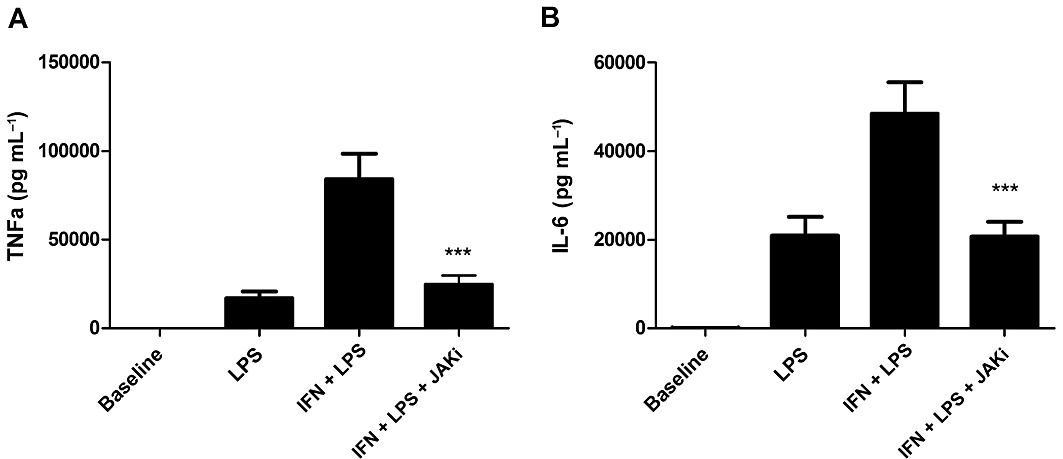
Effect of a JAK inhibitor (JAKi) on the IFN-γ enhanced LPS response in AM. Cells from COPD (n= 3) and S (n= 6) were treated with JAK inhibitor 1 (1 µM) for 2 h before treatment with IFN-γ (100 ng·mL−1) for 16 h before stimulation with LPS (1 µg·mL−1) for 24 h. TNF-α (A) and IL-6 (B) levels were measured by elisa. Repeat measures anova results of P < 0.0001 were found for both TNF-α and IL-6. Results for Bonferroni post-test are shown for IFN + LPS versus IFN + LPS + JAKi; ***P < 0.001. Data presented as mean cytokine release ± SEM.
IFN-γ regulation of TLR2 and 4 gene expression
To investigate how IFN-γ–activated JAK/STAT enhances the LPS response in AM, the effect of IFN-γ on TLR gene expression was studied in three COPD patients and four S. The preparation of LPS used signals predominantly through TLR4, but also contains lipoprotein contaminants that signal through TLR2. We therefore measured both TLR2 and TLR4 mRNA; there was no difference in the baseline levels of these TLRs between S and COPD (Figure 7A), which corresponds to the findings of von Scheele et al. (2010). However, there was greater variability in the COPD data. IFN-γ increased gene expression of both TLR2 and TLR4 in S and COPD patients, with no differences between groups (Supporting Information Figure S9). TLR4 showed the highest expression after 8 h and TLR2 after 24 h (Figure 7B & C).
Figure 7.
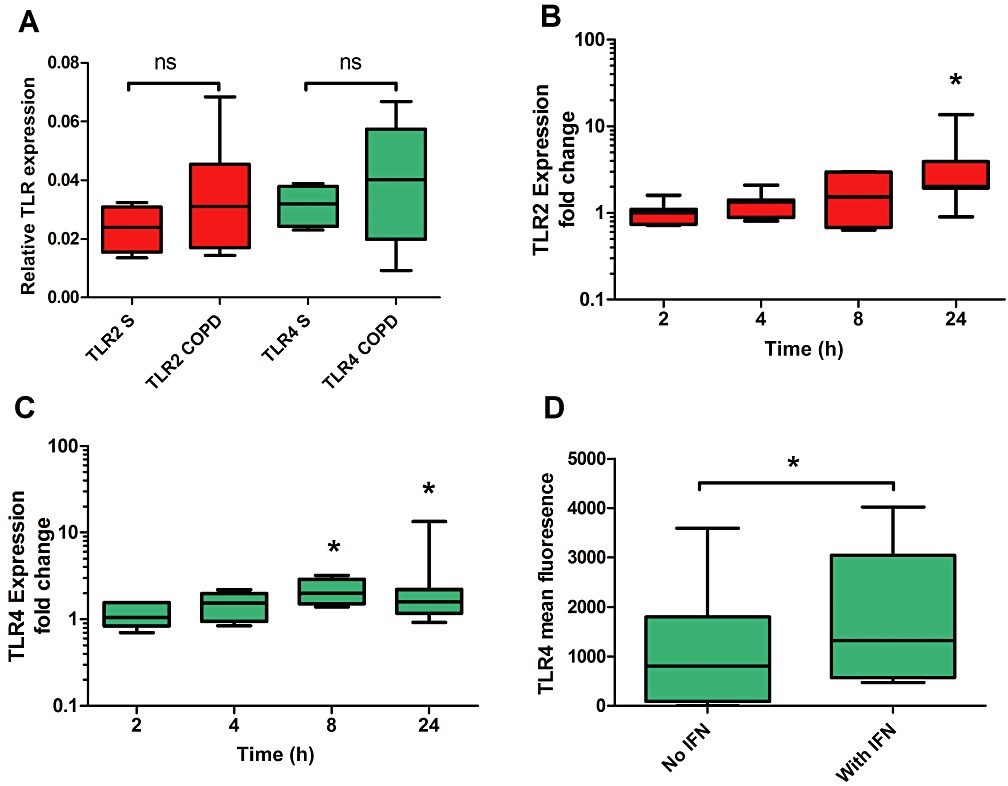
TLR2 and TLR4 expression in AM and the effect of IFN-γ. (A) Real-time PCR was used to analyse mRNA levels for TLR2 and TLR4 in unstimulated AM from S (n= 5) and COPD (n= 8) subjects. TLR expression, relative to an endogenous control (GAPDH), was determined using the 2−ΔCt method. Mann–Whitney test was used to compare levels in S and COPD subjects for each receptor: ns = non-significant. Effects of IFN-γ on TLR2 (B) and TLR4 (C) gene expression were examined for a combined group of S (n= 4) and COPD (n= 3) subjects. Relative expression levels in IFN-γ–stimulated cells were determined using the 2−ΔΔCt method normalizing to an endogenous control and to expression from time point matched unstimulated cells. Wilcoxon matched pairs test was used to compare stimulated and unstimulated: *P < 0.05. (D) The effects of IFN-γ on TLR4 surface expression were examined by flow cytometry in CD68+ AM from a combination of S (n= 2) and COPD (n= 4) subjects. Data presented as mean fluorescence above isotype control background. Wilcoxon matched pairs test was used to analyse the IFN-γ response: *P < 0.05. Data presented as medians, with whiskers showing total range.
As post-translational modification of TLRs could occur, the effect of IFN-γ on TLR4 protein cell surface expression in AM was measured by flow cytometry. AM were stimulated with IFN-γ for 20 h, as 16 h IFN-γ treatment followed by 4 h LPS enhanced TNF-α release (Supporting Information Figure S2). IFN-γ increased TLR4 antibody dependent mean fluorescence (Figure 7D).
To demonstrate that the IFN-γ-dependent upregulation of TLR gene expression was JAK-STAT-dependent, AM were treated with JAK inhibitor 1 for 2 h before stimulation with IFN-γ (100 ng·mL−1) for 8 h. RT-PCR results showed that the upregulation of both TLR2 and TLR4 was reduced after JAK inhibition (Figure 8). The previous results suggested that IFN-γ signalling in AM is corticosteroid-insensitive. AM were therefore also treated with 1 µM dexamethasone for 1 h before stimulation with or without IFN-γ (100 ng·mL−1) for 8 h. Dexamethasone increased TLR2 gene expression, but not TLR4 in unstimulated cells (Figure 8A). Treating IFN-γ–stimulated AM with dexamethasone significantly increased TLR2 expression above that of IFN-γ or dexamethasone alone. Dexamethasone inhibited IFN-γ-induced expression of TLR4 (Figure 8B).
Figure 8.
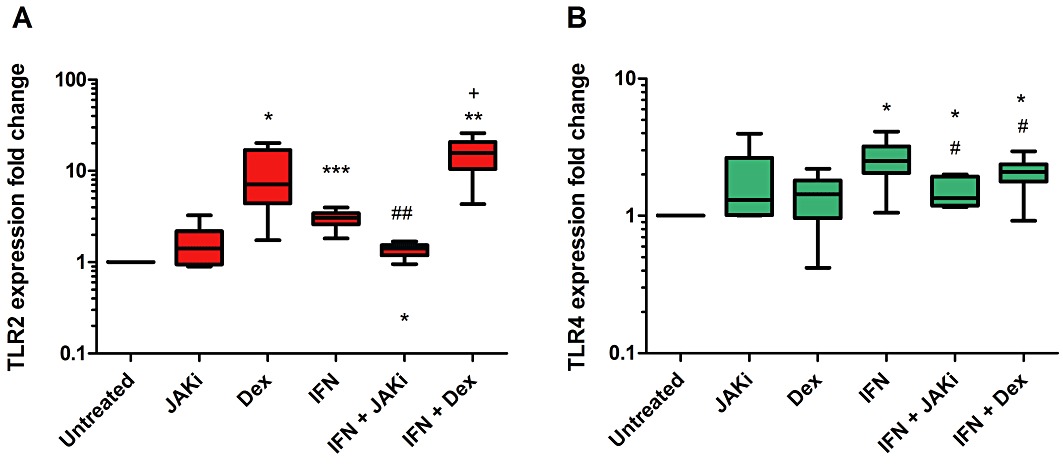
Effects of dexamethasone (corticosteroid) and JAK inhibition on IFN-γ enhanced TLR gene expression: AM from COPD (n= 5) and S (n= 1) were treated with dexamethasone (1 µM) for 1 h or JAK inhibitor 1 (1 µM) for 2 h before stimulation with or without IFN-γ (100 ng·mL−1) for 8 h. Relative expression levels in treated cells were determined using the 2−ΔΔCt method normalizing to an endogenous control (GAPDH) and to expression from time point matched untreated cells. Wilcoxon matched pairs test was used to examine the treatment response: (1) above untreated: *P < 0.05; **P < 0.01; ***P < 0.001; (2) below IFN-γ response: #P < 0.05; ##P < 0.01; (3) above IFN-γ response: +P < 0.05. Data presented as medians, with whiskers showing total range.
Immunohistochemical quantification of STAT1 activation in AM
Activated STAT1 in AM from resected lung tissue was measured by immunohistochemistry. Phosphorylated Y701 STAT1 expression was at low levels in AM from COPD (n= 10) and NS (n= 8); median values were 2.1 and 3.7%, respectively, with no significant differences between groups. Representative images are shown in Supporting Information Figure S10.
Discussion and conclusions
We observed that IFN-γ alone had no effect on TNF-α and IL-6 production by AMs, but that IFN-γ treatment synergistically increased the subsequent production of TNF-α and IL-6 after LPS stimulation. This effect was associated with an up-regulation of TLR2 and TLR4 expression. In contrast, IFN-γ alone induced IP-10 production. These IFN-γ effects on TNF-α, IL-6 and IP-10 production were corticosteroid-insensitive, being driven by STAT1 signalling that was not inhibited by dexamethasone. These corticosteroid-insensitive responses were suppressed by inhibitors of JAK/STAT1 signalling.
IFN-γ levels are known to be elevated in the lungs of COPD patients in the stable state (Barnes, 2000; Panzner et al., 2003; Hens et al., 2008; Reeves et al., 2010). We observed that the effects of IFN-γ on cytokine production from AMs were corticosteroid-resistant, both in COPD patients and controls. The corticosteroid-insensitive activation of STAT1 by Y701 phosphorylation is therefore not a COPD specific phenomenon, as it occurs in the absence of lung disease as well. However, stable COPD patients have raised IFN-γ levels (Barnes, 2000; Panzner et al., 2003; Hens et al., 2008; Reeves et al., 2010), implicating this mechanism in the poor clinical response to corticosteroids that is often seen in clinical practice. Furthermore, this corticosteroid-insensitive mechanism may be amplified during viral infections that promote IFN-γ production.
The classical function of IFN-γ priming is to prepare the innate immune response for environmental challenges, such as infections (Schroder et al., 2006). Priming speeds up this response and also leads to hyper-responsiveness with an increase in cytokine release. In healthy humans, this mechanism helps the rapid clearance of infections. However, in COPD patients, our new data suggest that this mechanism may also have harmful effects in terms of increased tissue damage. The observation that IFN-γ enhances the LPS response by increasing expression of TLRs has been described previously in human monocyte-derived macrophages (Bosisio et al., 2002). IFN-γ can also increase the expression of other components of the TLR signalling pathway, including Myd88 and CD14 (Mita et al., 2001; Schroder et al., 2006). These molecular mechanisms may have clinical relevance for COPD patients undergoing viral exacerbations, as these observations suggest that IFN-γ signalling can amplify the inflammatory response to a subsequent bacterial infection. This may explain the prolonged and excessive inflammatory response experienced by many COPD patients during exacerbations.
STAT1 induces gene expression by binding to the gamma activator sequences (GAS) response element. A study of 224 immune-related genes has shown that 54.3% of these contained GAS response elements (Saha et al., 2010). This compares with just 12.2% for NF-κB and 4.8% for AP-1. This highlights the potentially important role that elevated IFN-γ levels in COPD may play in the regulation of immune responses. We observed that IFN-γ alone caused release of IP-10, but not TNF-α or IL-6. Analysis of the promoter regions of inflammatory genes has shown that the IP-10 promoter contains response elements for STAT1, NF-κB and AP-1 (Saha et al., 2010). This explains why AMs produce IP-10 after stimulation with both IFN-γ, which signals through STAT1, and LPS, which signals through NF-κB. The regulation of IP-10 varies between cell types; it has been shown to be NF-κB-independent in bronchial epithelial cells (Tudhope et al., 2007) and human airway smooth muscle (Clarke et al., 2010). Elevated levels of IP-10 are present in the lungs of COPD patients compared with controls (Saetta et al., 2002). We have shown in AM that the increase in IP-10 induced by LPS and IFN-γ is steroid insensitive. Similar results have been shown for LPS-induced IP-10 in AM (Armstrong et al., 2009) and IFN-γ-induced IP-10 in bronchial epithelial cells (Tudhope et al., 2007) and airway smooth muscle (Clarke et al., 2010). IP-10, along with MIG and ITAC, are ligands for the chemokine receptor CXCR3, which is found on CD8 and CD4 lymphocytes. CD8 numbers are increased in the airways of COPD patients and are associated with increased CXCR3 expression (Saetta et al., 2002). Furthermore, lymphoid follicles are a hallmark feature of COPD lungs, acting as centres for the immune response. The numbers of follicles are sharply elevated in patients with severe COPD (Hogg et al., 2004). IP-10 appears to play a major role in follicle formation (Kelsen et al., 2009), being released from localized macrophage, dendritic cells, airway epithelial cells and endothelial cells. The upregulation of IP-10 production by IFN-γ may therefore play an important role in the development and progression of abnormal lymphocyte function in COPD.
We observed that IFN-γ increased TLR2 and 4 gene expression in a JAK/STAT dependent mechanism. IFN-γ enhanced TLR4 gene expression was also suppressed by corticosteroids. This suggests that the reduced effect of corticosteroids on the IFN-γ-enhanced LPS response may not be due to increased TLR4 signalling. TLR2 expression was increased by both IFN-γ and dexamethasone. Therefore, the IFN-γ-enhanced LPS response, and it subsequent insensitivity to steroids, may be due to TLR2 activation by contaminating lipoproteins in the LPS preparation used for this study. Corticosteroids have also been shown to increase TLR2 expression, but not TLR4, in bronchial epithelial cells (von Scheele et al., 2010). Cell surface expression of TLR2 is lower in AM from S and COPD patients compared with non-smoking controls (Droemann et al., 2005). However, in COPD patients the additive effect of corticosteroid use, with an increase in IFN-γ levels during a viral exacerbation, could elevate TLR2 levels and increase bacterial driven lung inflammation.
This study focused on evaluating the effects of corticosteroids on a limited number of key IFN-γ controlled inflammatory proteins. We also observed that IFN-γ activation of STAT1 was corticosteroid insensitive, but, in contrast, IFN-γ-induced TLR4 mRNA was steroid sensitive. This suggests that TLR4 expression is not solely controlled by STAT1, but is also influenced by corticosteroid sensitive pathways, such as NF-κB. It is probably the case that other IFN-γ-induced systems will also be corticosteroid sensitive. Additionally, there is evidence from co-culture systems using lymphocytes with monocytes that corticosteroids can reduce IFN-γ stimulation of monocytes through modulation of lymphocyte activity (Hu et al., 2003).
It has been demonstrated that the TNF-α promoter does not contain response elements for IFN regulatory factor (IRF)1 or a gamma activating sequence (Saha et al., 2010), which would explain why IFN-γ alone had no effect on TNF-α production. The priming effect of IFN-γ on TNF-α production cannot therefore be due to a direct effect of STAT1 on the TNF-α promoter. We now demonstrate that IFN-γ priming can occur through upregulation of TLR expression, providing a synergistic mechanism by which TNF-α production is upregulated. In contrast, response elements for STAT1 are located in the promoter region for IL-6 (Saha et al., 2010), but the lack of effect of IFN-γ alone on IL-6 levels indicate that other transcription factors play a greater role in the regulation of gene expression, such as NF-κB and AP-1. The level of control each of these transcription factors has on IL-6 expression is dependent on the stimulus and cell type (Libermann and Baltimore, 1990; Dendorfer et al., 1994; Vanden Berghe et al., 2000). In THP-1 cells, IFN-γ stimulation does not induce NF-κB binding to the IL-6 promoter region (Sanceau et al., 1995).
Our immunohistochemistry studies showed no difference in Y701 STAT1 levels in AM from lung tissue obtained from COPD patients and non-smoking controls. Previous publications have shown increased IFN-γ levels in the lungs of COPD patients (Panzner et al., 2003; Hens et al., 2008; Reeves et al., 2010), so this was a surprising result as we expected to find higher STAT Y701 expression in COPD patients. There are possible explanations from the literature for these findings; firstly, the gene expression levels of JAK/STAT pathway components are down-regulated by cigarette smoke in COPD macrophages (Kent et al., 2008; Doyle et al., 2010). Furthermore, chronic stimulation with IFN-γ can cause negative feedback mechanisms, for example, via SOCS-1 (Hu et al., 2008). It should also be noted that overall levels of STAT1 Y701 phosphorylation were very low, with <3% of cells showing positive expression. A major consideration is that phosphorylation of STAT1 is very transient (Kovarik et al., 1998), and so the low levels of expression are probably not surprising. We expect that levels of STAT1 activity in AM will be higher in subjects suffering from viral triggered COPD exacerbations, in contrast to the current data, which was generated in samples from patients in the stable state rather than during exacerbations.
Cytokine release from an LPS-stimulated COPD AM tends to be lower than those from a non-smoker AM (Brown et al., 1989; Yamaguchi et al., 1989; 1993; Soliman and Twigg, 1992; Kent et al., 2008; Armstrong et al., 2009; 2011) and this has been linked to reduced NF-κB and MAPK signalling in COPD AM (Chen et al., 2007), and a switch in the phenotype of these cells away from the classical phenotype towards the alternative activation phenotype (Shaykhiev et al., 2009). Our results are comparable to these previous findings, as there were numerically lower levels of TNF-α and IL-6 released from COPD AM after 4 h LPS treatment, and significantly lower levels of IFN-γ-induced IP-10 release from COPD AM. Release of some key inflammatory proteins, such as MMP-9, are higher from COPD AM than from S and NS control AM (Russell et al., 2002), which is compatible with an alternative activation phenotype involved in tissue remodelling. Despite the similar or even lower levels of some inflammatory cytokines released from each AM from a COPD patient compared with a healthy control, it should be noted that there is an increased absolute number of AM in the lungs of COPD patients (Di Stefano et al., 1998; Hogg et al., 2004). We suggest that the increased number of AM combined with the production of corticosteroid-insensitive cytokines such as IP-10 from these cells, plays an important role in the progression of airway inflammation.
One might have expected that increased levels of IFN-γ in the lungs of stable COPD patients would have primed the AM to release more cytokines. This was not observed in the current study. There are a number of possible reasons for this observation; the practical steps required to isolate AM from the lungs involves washing steps that remove the IFN-γ present in the lung environment. Our Western blots showed that the STAT1 pathway was not activated in these cells ex vivo before the addition of IFN-γ. Furthermore, the skewing of COPD AM towards the M2 phenotype decreases (Shaykhiev et al., 2009) the likelihood that these cells will produce more cytokines after stimulation. Also, key components of the TLR signalling pathway, such as NF-κB and MAPK, are down-regulated in AM from smokers (Chen et al., 2007). However, it is possible that our results would be different in a COPD patient with a viral exacerbation, where IFN-γ levels are increased.
Our recent work has shown that the effects of corticosteroids on LPS-stimulated AM cytokine production are similar in COPD patients and controls (Armstrong et al., 2009; 2011). Similarly, the current study has again shown no difference between COPD patients and controls. Previously, we also showed that the effect of corticosteroids varies between cytokines stimulated by LPS. The current study also demonstrates this phenomenon, as dexamethasone had absolutely no inhibitory effect on LPS-induced IP-10 production, in contrast to IL-6 and TNF-α, which were partially suppressed. Others have shown that AM from COPD patients are less sensitive to corticosteroids than cells from controls (Cosio et al., 2004; Knobloch et al., 2011). In these studies, there was higher LPS-induced cytokine release in AM from COPD patients compared with controls. The differences in LPS response, between these studies and our own, could be the underlying reason for the different pharmacological effects of corticosteroids. In this study, LPS from E. coli serotype O26:B6 was used, while Cosio et al. and Knoblock et al. used LPS from Salmonella enteritidis and Salmonella Minnesota, respectively; the different types of LPS used may contribute to the different results observed. Interestingly, Knobloch et al. also showed that LPS-induced IL-6 was lower in AM from COPD patients, compared with controls, and that there was no difference in corticosteroid sensitivity between groups for this cytokine.
The inhibition of JAK signalling reduced IFN-γ-stimulated IP-10 and IFN-γ-enhanced LPS responses in AM. As also reported for airway smooth muscle (Clarke et al., 2010), JAK inhibition was more effective than corticosteroids at preventing IFN-γ induced STAT1 activation and IP-10 release. We used a selective JAK 1 inhibitor, and the specific STAT-1 inhibitor fludarabine. The limited effect of fludarabine on STAT-1 phosphorylation indicates that this drug is not a potent inhibitor. Nevertheless, there was still 55% inhibition of IP-10 production using the highest concentration of fludarabine. The efficacy of a selective JAK1 inhibitor suggests that this class of drug could be effective in COPD. JAK inhibitors are being developed for treatment of other inflammatory disorders (Coombs et al., 2010; William et al., 2011), and our findings suggest that this therapeutic avenue is worth exploring in COPD. Pharmacological experiments on human lung cells, such as AM, using a JAK inhibitor and a corticosteroid combined could also give an indication of additive effects and interactions between these drug classes.
In summary, we have shown that IFN-γ causes priming of IL-6 and TNF-α production by LPS, and also promotes IP-10 production even without LPS. These effects are corticosteroid-insensitive, and are due to activation of STAT-1. Inhibition of JAK/STAT-1 signalling effectively suppressed these IFN-γ effects. These data support the development and evaluation of JAK inhibitors for the treatment of COPD.
Acknowledgments
This work was kindly supported by the North West Lung Research Centre, Manchester, UK.
Glossary
- AM
alveolar macrophage
- AP-1
activator protein 1
- COPD
chronic obstructive airway disease
- FEV1
forced expiratory volume in 1 second
- FVC
forced vital capacity
- GAS
gamma activator sequence
- GR
glucocorticoid receptor
- IRF
1, interferon regulatory factor 1
- IP-10
IFN-γ-induced protein 10 kDa
- JAK
Janus kinase
- mRNA
messenger RNA
- NS
non-smoker
- S
smoker
- STAT
signal transducer and activator of transcription
- Th1
T helper cell 1
- TLR
toll-like receptor
Conflicts of interest
T S, AM, SL and JP have no disclosures. SF is an employee of GlaxoSmithKline and DS has received lecture fees, research grants, consultancy fees and support for conference attendance from various pharmaceutical companies including Almirall, AstraZeneca, Chiesi, GlaxoSmithKline, Boehringer Ingleheim and Roche.
Supporting information
Additional Supporting Information may be found in the online version of this article:
Figure S1 Kinetics of IFN-γ enhanced LPS response in AM: AM from COPD patients (n = 3) were treated with varying doses of IFN-γ (0.1–1000 ng·mL−1) for between 1 and 24 h prior to stimulation with LPS (1 μg·mL−1). TNF-α levels were measured by ELISA. Data presented as mean TNF-α release from n = 3 individual experiments.
Figure S2 IFN-γ enhancement of LPS-stimuled AM from NS, S and COPD patients. AM were treated with or without IFN-γ (100 ng·mL−1) for 16 h before stimulation with LPS (1 μg·mL−1) for 4 h. Culture supernatants were analysed for TNF-α (A), IL-6 (B) and IP-10 (C) levels by ELISA. NS n = 8; S n = 7; COPD n = 13. Intragroup analysis was by repeated measures ANOVA with Bonferroni post-test for TNF-α and IL-6, and Friedmen with Dunn post-test for IP-10. For all groups TNF-α and IL-6 ANOVA results P < 0.0001. Friedmen results for IP-10 were <0.0001 for all groups. Intergroup analysis was by One-way ANOVA or Kruskal–Wallis tests, with all results being non-significant, except that IFN-γ induced higher levels of IP-10 from NS compared with COPD (P < 0.05). Post-test analysis results shown for LPS versus LPS + IFN-γ *P < 0.05; ns = non-significant. Data presented as mean ± SEM for TNF-α and IL-6, and median, with whiskers showing total range, for IP-10.
Figure S3 The effect of IFN-γ priming onthe corticosteroid response in LPS-stimulated AM. Cells from n = 8 NS (A and D), n = 7 S (B and E) and n = 13 COPD patients (C and F) were treated with or without IFN-γ (100 ng·mL−1) for 16 h prior to treatment with varying doses of dexamethasone (1–1000 nM) for 1 h before stimulation with LPS (1 μg·mL−1) for 4 h. Culture supernatants were analysed for TNF-α (A-C) and IL-6 (D–F) levels by ELISA. Data presented as mean % inhibition ± SEM of cytokine release by dexamethasone. Intragroup analysis was by repeated measures ANOVA with P < 0.0001 for all results. Bonferroni post-test results for LPS versus LPS + IFN-γ at each dexamethasone concentration are shown: *P < 0.05; **P < 0.01; ***P < 0.001.
Figure S4 The effects of corticosteroid on LPS-induced TNF-α following priming with IFN-γ. Cells from NS (A and D), S (B and E) and COPD patients (C and F) were treated with or without IFN-γ (100 ng·mL−1) for 16 h prior to treatment with varying doses of dexamethasone (1–1000 nM) for 1 h before stimulation with LPS (1 μg·mL−1) for 4(A-C) (NS n = 8; S n = 7; COPD n = 13) or 24 (D-F) (NS n = 8; S n = 8; COPD n = 7) hr. Culture supernatants were analysed for TNF-α by ELISA. Data presented as mean absolute levels of cytokine ± sem.
Figure S5 The effects of corticosteroid on LPS-induced IL-6 following priming with IFN-γ. Cells from NS (A and D), S (B and E) and COPD patients (C and F) were treated with or without IFN-γ (100 ng·mL−1) for 16 h prior to treatment with varying doses of dexamethasone (1–1000 nM) for 1 h before stimulation with LPS (1 μg·mL−1) for 4 (A-C) (NS n = 8; S n = 7; COPD n = 13) or 24 (D-F) (NS n = 8; S n = 8; COPD n = 7) hr. Culture supernatants were analysed for IL-6 by ELISA. Data presented as mean absolute levels of cytokine ± sem.
Figure S6 The IFN-γ induced IP-10 response from THP-1 cells following corticosteroid treatment. THP-1 cells were treated with varying doses of dexamethasone (1–1000 nM) for 1 h prior to stimulation with IFN-γ for 16 h. IP-10 levels in culture supernatants were measured by ELISA. Data presented as median absolute levels of IP-10 (pg·mL−1), from n = 6 repeats, with whiskers showing total range. Analysis was by the Freidmen test, with the result being non-significant (ns).
Figure S7 Activation of STAT1 in AM following treatment with IFN-γ or LPS. Western blot of protein lysates from AM stimulated with IFN-γ (100 ng·mL−1) or LPS (1 μg·mL−1) for 0 to 60 min. Blots wereprobed with antibodies for phosphorylated STAT1 at Y701 and S727 residues. Results presented are representative blots from n = 3 experiments.
Figure S8 Effects of dexamethasone on IFN-γ-induced STAT1 activation in THP-1 cells. Western blot of cell lysates from THP-1 cells treated with or without dexamethasone (1 μM) for 1 h prior to stimulation with IFN-γ (100 ng·mL−1) for 0 to 60 min (A). Blots were probed with antibodies for phosphor-Y701 STAT1. Densitometry analysis of phosphorylated STAT1 (Y701) and phosphorylated GR (S211) bands was carried out on n = 10 THP-1 cell lysates stimulated with IFN-γ for 10 min ± dexamethasone (B). No Dex versus Dex: **P < 0.01; ns = non-significant. Data presented as mean ± SEM.
Figure S9 Stimulation of TLR gene expression in AM from S and COPD patients. Real-time PCR was used to analyse mRNA levels for TLR2 and TLR4 in AM stimulated with 100 ng·mL−1 IFN-γ for 8 h from S (n = 5) and COPD (n = 8) subjects. Relative expression levels in IFN-γ stimulated cells were determined using the 2-ΔΔCt method normalizing to an endogenous control (GAPDH) and to expression from time point matched unstimulated cells. Mann–Whitney test was used to compare levels in S and COPD subjects for each receptor: ns = non-significant.
Figure S10 Levels of STAT1 activation in lung tissue macrophages. Immunohistochemistry on re-sected lung tissue was used to measure numbers of AM expressing phosphor-Y701 STAT1. AM were identified by structure and location. Comparisons were made between AM found in NS and COPD lung tissue.
Please note: Wiley–Blackwell are not responsible for the content or functionality of any supporting materials supplied by the authors. Any queries (other than missing material) should be directed to the corresponding author for the article.
References
- Adcock IM, Ito K, Barnes PJ. Glucocorticoids: effects on gene transcription. Proc Am Thorac Soc. 2004;1:247–254. doi: 10.1513/pats.200402-001MS. [DOI] [PubMed] [Google Scholar]
- Armstrong J, Sargent C, Singh D. Glucocorticoid sensitivity of lipopolysaccharide-stimulated chronic obstructive pulmonary disease alveolar macrophages. Clin Exp Immunol. 2009;158:74–83. doi: 10.1111/j.1365-2249.2009.03986.x. [DOI] [PMC free article] [PubMed] [Google Scholar]
- Armstrong J, Harbron C, Lea S, Booth G, Cadden P, Wreggett K, et al. Synergistic effects of p38 MAPK inhibition with a corticosteroid in alveolar macrophages from COPD patients. J Pharmacol Exp Ther. 2011;338:732–740. doi: 10.1124/jpet.111.180737. [DOI] [PubMed] [Google Scholar]
- Barnes PJ. Chronic obstructive pulmonary disease. N Engl J Med. 2000;343:269–280. doi: 10.1056/NEJM200007273430407. [DOI] [PubMed] [Google Scholar]
- Barnes PJ. Alveolar macrophages as orchestrators of COPD. COPD. 2004;1:59–70. doi: 10.1081/COPD-120028701. [DOI] [PubMed] [Google Scholar]
- Barnes PJ. Inhaled corticosteroids in COPD: a controversy. Respiration. 2010;80:89–95. doi: 10.1159/000315416. [DOI] [PubMed] [Google Scholar]
- Bosisio D, Polentarutti N, Sironi M, Bernasconi S, Miyake K, Webb GR, et al. Stimulation of toll-like receptor 4 expression in human mononuclear phagocytes by interferon-gamma: a molecular basis for priming and synergism with bacterial lipopolysaccharide. Blood. 2002;99:3427–3431. doi: 10.1182/blood.v99.9.3427. [DOI] [PubMed] [Google Scholar]
- Brown GP, Iwamoto GK, Monick MM, Hunninghake GW. Cigarette smoking decreases interleukin 1 release by human alveolar macrophages. Am J Physiol. 1989;256((2 Pt 1)):C260–C264. doi: 10.1152/ajpcell.1989.256.2.C260. [DOI] [PubMed] [Google Scholar]
- Chen H, Cowan MJ, Hasday JD, Vogel SN, Medvedev AE. Tobacco smoking inhibits expression of proinflammatory cytokines and activation of IL-1R-associated kinase, p38, and NF-kappaB in alveolar macrophages stimulated with TLR2 and TLR4 agonists. J Immunol. 2007;179:6097–6106. doi: 10.4049/jimmunol.179.9.6097. [DOI] [PubMed] [Google Scholar]
- Clarke DL, Clifford RL, Jindarat S, Proud D, Pang L, Belvisi M, et al. TNFalpha and IFNgamma synergistically enhance transcriptional activation of CXCL10 in human airway smooth muscle cells via STAT-1, NF-kappaB, and the transcriptional coactivator CREB-binding protein. J Biol Chem. 2010;285:29101–29110. doi: 10.1074/jbc.M109.0999952. [DOI] [PMC free article] [PubMed] [Google Scholar]
- Coombs JH, Bloom BJ, Breedveld FC, Fletcher MP, Gruben D, Kremer JM, et al. Improved pain, physical functioning and health status in patients with rheumatoid arthritis treated with CP-690,550, an orally active Janus kinase (JAK) inhibitor: results from a randomised, double-blind, placebo-controlled trial. Ann Rheum Dis. 2010;69:413–416. doi: 10.1136/ard.2009.108159. [DOI] [PubMed] [Google Scholar]
- Cosio BG, Tsaprouni L, Ito K, Jazrawi E, Adcock IM, Barnes PJ. Theophylline restores histone deacetylase activity and steroid responses in COPD macrophages. J Exp Med. 2004;200:689–695. doi: 10.1084/jem.20040416. [DOI] [PMC free article] [PubMed] [Google Scholar]
- Darnell JE, Jr, Kerr IM, Stark GR. Jak-STAT pathways and transcriptional activation in response to IFNs and other extracellular signaling proteins. Science. 1994;264:1415–1421. doi: 10.1126/science.8197455. [DOI] [PubMed] [Google Scholar]
- Dendorfer U, Oettgen P, Libermann TA. Multiple regulatory elements in the interleukin-6 gene mediate induction by prostaglandins, cyclic AMP, and lipopolysaccharide. Mol Cell Biol. 1994;14:4443–4454. doi: 10.1128/mcb.14.7.4443. [DOI] [PMC free article] [PubMed] [Google Scholar]
- Di Stefano A, Capelli A, Lusuardi M, Balbo P, Vecchio C, Maestrelli P, et al. Severity of airflow limitation is associated with severity of airway inflammation in smokers. Am J Respir Crit Care Med. 1998;158:1277–1285. doi: 10.1164/ajrccm.158.4.9802078. [DOI] [PubMed] [Google Scholar]
- Doyle I, Ratcliffe M, Walding A, Vanden Bon E, Dymond M, Tomlinson W, et al. Differential gene expression analysis in human monocyte-derived macrophages: impact of cigarette smoke on host defence. Mol Immunol. 2010;47:1058–1065. doi: 10.1016/j.molimm.2009.11.008. [DOI] [PubMed] [Google Scholar]
- Droemann D, Goldmann T, Tiedje T, Zabel P, Dalhoff K, Schaaf B. Toll-like receptor 2 expression is decreased on alveolar macrophages in cigarette smokers and COPD patients. Respir Res. 2005;6:68. doi: 10.1186/1465-9921-6-68. [DOI] [PMC free article] [PubMed] [Google Scholar]
- Gough DJ, Levy DE, Johnstone RW, Clarke CJ. IFNgamma signaling-does it mean JAK-STAT? Cytokine Growth Factor Rev. 2008;19:383–394. doi: 10.1016/j.cytogfr.2008.08.004. [DOI] [PubMed] [Google Scholar]
- Grumelli S, Corry DB, Song LZ, Song L, Green L, Huh J, et al. An immune basis for lung parenchymal destruction in chronic obstructive pulmonary disease and emphysema. PLoS Med. 2004;1:e8. doi: 10.1371/journal.pmed.0010008. [DOI] [PMC free article] [PubMed] [Google Scholar]
- Hens G, Vanaudenaerde BM, Bullens DM, Piessens M, Decramer M, Dupont LJ, et al. Sinonasal pathology in nonallergic asthma and COPD: ‘united airway disease’ beyond the scope of allergy. Allergy. 2008;63:261–267. doi: 10.1111/j.1398-9995.2007.01545.x. [DOI] [PubMed] [Google Scholar]
- Hogg JC, Chu F, Utokaparch S, Woods R, Elliott WM, Buzatu L, et al. The nature of small-airway obstruction in chronic obstructive pulmonary disease. N Engl J Med. 2004;350:2645–2653. doi: 10.1056/NEJMoa032158. [DOI] [PubMed] [Google Scholar]
- Hu X, Li WP, Meng C, Ivashkiv LB. Inhibition of IFN-gamma signaling by glucocorticoids. J Immunol. 2003;170:4833–4839. doi: 10.4049/jimmunol.170.9.4833. [DOI] [PubMed] [Google Scholar]
- Hu X, Chakravarty SD, Ivashkiv LB. Regulation of interferon and toll-like receptor signaling during macrophage activation by opposing feedforward and feedback inhibition mechanisms. Immunol Rev. 2008;226:41–56. doi: 10.1111/j.1600-065X.2008.00707.x. [DOI] [PMC free article] [PubMed] [Google Scholar]
- Kelsen SG, Aksoy MO, Georgy M, Hershman R, Ji R, Li X, et al. Lymphoid follicle cells in chronic obstructive pulmonary disease overexpress the chemokine receptor CXCR3. Am J Respir Crit Care Med. 2009;179:799–805. doi: 10.1164/rccm.200807-1089OC. [DOI] [PMC free article] [PubMed] [Google Scholar]
- Kent L, Smyth L, Clayton C, Scott L, Cook T, Stephens R, et al. Cigarette smoke extract induced cytokine and chemokine gene expression changes in COPD macrophages. Cytokine. 2008;42:205–216. doi: 10.1016/j.cyto.2008.02.001. [DOI] [PubMed] [Google Scholar]
- Knobloch J, Hag H, Jungck D, Urban K, Koch A. Resveratrol impairs the release of steroid-resistant cytokines from bacterial endotoxin-exposed alveolar macrophages in chronic obstructive pulmonary disease. Basic Clin Pharmacol Toxicol. 2011;109:138–143. doi: 10.1111/j.1742-7843.2011.00707.x. [DOI] [PubMed] [Google Scholar]
- Kovarik P, Stoiber D, Novy M, Decker T. Stat1 combines signals derived from IFN-gamma and LPS receptors during macrophage activation. EMBO J. 1998;17:3660–3668. doi: 10.1093/emboj/17.13.3660. [DOI] [PMC free article] [PubMed] [Google Scholar]
- Laan M, Palmberg L, Larsson K, Linden A. Free, soluble interleukin-17 protein during severe inflammation in human airways. Eur Respir J. 2002;19:534–537. doi: 10.1183/09031936.02.00280902. [DOI] [PubMed] [Google Scholar]
- Lethbridge MW, Kemeny DM, Ratoff JC, O'Connor BJ, Hawrylowicz CM, Corrigan CJ. A novel technique to explore the functions of bronchial mucosal T cells in chronic obstructive pulmonary disease: application to cytotoxicity and cytokine immunoreactivity. Clin Exp Immunol. 2010;161:560–569. doi: 10.1111/j.1365-2249.2010.04198.x. [DOI] [PMC free article] [PubMed] [Google Scholar]
- Libermann TA, Baltimore D. Activation of interleukin-6 gene expression through the NF-kappa B transcription factor. Mol Cell Biol. 1990;10:2327–2334. doi: 10.1128/mcb.10.5.2327. [DOI] [PMC free article] [PubMed] [Google Scholar]
- Makris D, Lazarou S, Alexandrakis M, Kourelis TV, Tzanakis N, Kyriakou D, et al. Tc2 response at the onset of COPD exacerbations. Chest. 2008;134:483–488. doi: 10.1378/chest.07-2626. [DOI] [PubMed] [Google Scholar]
- Mita Y, Dobashi K, Shimizu Y, Nakazawa T, Mori M. Toll-like receptor 2 and 4 surface expressions on human monocytes are modulated by interferon-gamma and macrophage colony-stimulating factor. Immunol Lett. 2001;78:97–101. doi: 10.1016/s0165-2478(01)00241-3. [DOI] [PubMed] [Google Scholar]
- Panzner P, Lafitte JJ, Tsicopoulos A, Hamid Q, Tulic MK. Marked up-regulation of T lymphocytes and expression of interleukin-9 in bronchial biopsies from patients with chronic bronchitis with obstruction. Chest. 2003;124:1909–1915. doi: 10.1378/chest.124.5.1909. [DOI] [PubMed] [Google Scholar]
- Rabe KF, Hurd S, Anzueto A, Barnes PJ, Buist SA, Calverley P, et al. Global strategy for the diagnosis, management, and prevention of chronic obstructive pulmonary disease: GOLD executive summary. Am J Respir Crit Care Med. 2007;176:532–555. doi: 10.1164/rccm.200703-456SO. [DOI] [PubMed] [Google Scholar]
- Reeves EP, Williamson M, Byrne B, Bergin DA, Smith SG, Greally P, et al. IL-8 dictates glycosaminoglycan binding and stability of IL-18 in cystic fibrosis. J Immunol. 2010;184:1642–1652. doi: 10.4049/jimmunol.0902605. [DOI] [PubMed] [Google Scholar]
- Russell RE, Culpitt SV, DeMatos C, Donnelly L, Smith M, Wiggins J, et al. Release and activity of matrix metalloproteinase-9 and tissue inhibitor of metalloproteinase-1 by alveolar macrophages from patients with chronic obstructive pulmonary disease. Am J Respir Cell Mol Biol. 2002;26:602–609. doi: 10.1165/ajrcmb.26.5.4685. [DOI] [PubMed] [Google Scholar]
- Saetta M, Mariani M, Panina-Bordignon P, Turato G, Buonsanti C, Baraldo S, et al. Increased expression of the chemokine receptor CXCR3 and its ligand CXCL10 in peripheral airways of smokers with chronic obstructive pulmonary disease. Am J Respir Crit Care Med. 2002;165:1404–1409. doi: 10.1164/rccm.2107139. [DOI] [PubMed] [Google Scholar]
- Saha B, Jyothi Prasanna S, Chandrasekar B, Nandi D. Gene modulation and immunoregulatory roles of interferon gamma. Cytokine. 2010;50:1–14. doi: 10.1016/j.cyto.2009.11.021. [DOI] [PubMed] [Google Scholar]
- Sanceau J, Kaisho T, Hirano T, Wietzerbin J. Triggering of the human interleukin-6 gene by interferon-gamma and tumor necrosis factor-alpha in monocytic cells involves cooperation between interferon regulatory factor-1, NF kappa B, and Sp1 transcription factors. J Biol Chem. 1995;270:27920–27931. doi: 10.1074/jbc.270.46.27920. [DOI] [PubMed] [Google Scholar]
- von Scheele I, Larsson K, Palmberg L. Budesonide enhances toll-like receptor 2 expression in activated bronchial epithelial cells. Inhal Toxicol. 2010;22:493–499. doi: 10.3109/08958370903521216. [DOI] [PubMed] [Google Scholar]
- Schoenborn JR, Wilson CB. Regulation of interferon-gamma during innate and adaptive immune responses. Adv Immunol. 2007;96:41–101. doi: 10.1016/S0065-2776(07)96002-2. [DOI] [PubMed] [Google Scholar]
- Schroder K, Hertzog PJ, Ravasi T, Hume DA. Interferon-gamma: an overview of signals, mechanisms and functions. J Leukoc Biol. 2004;75:163–189. doi: 10.1189/jlb.0603252. [DOI] [PubMed] [Google Scholar]
- Schroder K, Sweet MJ, Hume DA. Signal integration between IFNgamma and TLR signalling pathways in macrophages. Immunobiology. 2006;211:511–524. doi: 10.1016/j.imbio.2006.05.007. [DOI] [PubMed] [Google Scholar]
- Sethi S, Murphy TF. Infection in the pathogenesis and course of chronic obstructive pulmonary disease. N Engl J Med. 2008;359:2355–2365. doi: 10.1056/NEJMra0800353. [DOI] [PubMed] [Google Scholar]
- Shaykhiev R, Krause A, Salit J, Strulovici-Barel Y, Harvey BG, O'Connor TP, et al. Smoking-dependent reprogramming of alveolar macrophage polarization: implication for pathogenesis of chronic obstructive pulmonary disease. J Immunol. 2009;183:2867–2883. doi: 10.4049/jimmunol.0900473. [DOI] [PMC free article] [PubMed] [Google Scholar]
- Singh M, Lee SH, Porter P, Xu C, Ohno A, Atmar RL, et al. Human rhinovirus proteinase 2A induces TH1 and TH2 immunity in patients with chronic obstructive pulmonary disease. J Allergy Clin Immunol. 2010;125:1369–1378 e1362. doi: 10.1016/j.jaci.2010.02.035. [DOI] [PMC free article] [PubMed] [Google Scholar]
- Soliman DM, Twigg HL., 3rd Cigarette smoking decreases bioactive interleukin-6 secretion by alveolar macrophages. Am J Physiol. 1992;263((4 Pt 1)):L471–L478. doi: 10.1152/ajplung.1992.263.4.L471. [DOI] [PubMed] [Google Scholar]
- Srinivasan S, Ito M, Kajiya H, Key LL, Jr, Johnson-Pais TL, Reddy SV. Functional characterization of human osteoclast inhibitory peptide-1 (OIP-1/hSca) gene promoter. Gene. 2006;371:16–24. doi: 10.1016/j.gene.2005.11.001. [DOI] [PMC free article] [PubMed] [Google Scholar]
- Stark GR. How cells respond to interferons revisited: from early history to current complexity. Cytokine Growth Factor Rev. 2007;18:419–423. doi: 10.1016/j.cytogfr.2007.06.013. [DOI] [PMC free article] [PubMed] [Google Scholar]
- Tudhope SJ, Catley MC, Fenwick PS, Russell RE, Rumsey WL, Newton R, et al. The role of IkappaB kinase 2, but not activation of NF-kappaB, in the release of CXCR3 ligands from IFN-gamma-stimulated human bronchial epithelial cells. J Immunol. 2007;179:6237–6245. doi: 10.4049/jimmunol.179.9.6237. [DOI] [PubMed] [Google Scholar]
- Vanden Berghe W, Vermeulen L, De Wilde G, De Bosscher K, Boone E, Haegeman G. Signal transduction by tumor necrosis factor and gene regulation of the inflammatory cytokine interleukin-6. Biochem Pharmacol. 2000;60:1185–1195. doi: 10.1016/s0006-2952(00)00412-3. [DOI] [PubMed] [Google Scholar]
- Wilkinson TM, Hurst JR, Perera WR, Wilks M, Donaldson GC, Wedzicha JA. Effect of interactions between lower airway bacterial and rhinoviral infection in exacerbations of COPD. Chest. 2006;129:317–324. doi: 10.1378/chest.129.2.317. [DOI] [PMC free article] [PubMed] [Google Scholar]
- William AD, Lee AC, Blanchard S, Poulsen A, Teo E, Nagaraj H, et al. Discovery of the macrocycle 11-(2-pyrrolidin-1-yl-ethoxy)-14,19-dioxa-5,7,26-triaza-tetracyclo[19.3.1. 1(2,6).1(8,12)]heptacosa-1(25),2(26),3,5,8,10,12(27),16,21,23-decaene (SB1518), a potent Janus kinase 2/Fms-like tyrosine kinase-3 (JAK2/FLT3) inhibitor for the treatment of myelofibrosis and lymphoma. J Med Chem. 2011;54:4368–4658. doi: 10.1021/jm200326p. [DOI] [PubMed] [Google Scholar]
- Yamaguchi E, Okazaki N, Itoh A, Abe S, Kawakami Y, Okuyama H. Interleukin 1 production by alveolar macrophages is decreased in smokers. Am Rev Respir Dis. 1989;140:397–402. doi: 10.1164/ajrccm/140.2.397. [DOI] [PubMed] [Google Scholar]
- Yamaguchi E, Itoh A, Furuya K, Miyamoto H, Abe S, Kawakami Y. Release of tumor necrosis factor-alpha from human alveolar macrophages is decreased in smokers. Chest. 1993;103:479–483. doi: 10.1378/chest.103.2.479. [DOI] [PubMed] [Google Scholar]
- Zhu X, Gadgil AS, Givelber R, George MP, Stoner MW, Sciurba FC, et al. Peripheral T cell functions correlate with the severity of chronic obstructive pulmonary disease. J Immunol. 2009;182:3270–3277. doi: 10.4049/jimmunol.0802622. [DOI] [PubMed] [Google Scholar]
Associated Data
This section collects any data citations, data availability statements, or supplementary materials included in this article.