

Abstract
Episodic ataxia type 1 (EA1) is an autosomal dominant neurological disorder characterized by myokymia and attacks of ataxic gait often precipitated by stress. Several genetic mutations have been identified in the Shaker-like K+ channel Kv1.1 (KCNA1) of EA1 individuals, including V408A, which result in remarkable channel dysfunction. By inserting the heterozygous V408A, mutation in one Kv1.1 allele, a mouse model of EA1 has been generated (Kv1.1V408A/+). Here, we investigated the neuromuscular transmission of Kv1.1V408A/+ ataxic mice and their susceptibility to physiologically relevant stressors. By using in vivo preparations of lateral gastrocnemius (LG) nerve–muscle from Kv1.1+/+ and Kv1.1V408A/+ mice, we show that the mutant animals exhibit spontaneous myokymic discharges consisting of repeated singlets, duplets or multiplets, despite motor nerve axotomy. Two-photon laser scanning microscopy from the motor nerve, ex vivo, revealed spontaneous Ca2 + signals that occurred abnormally only in preparations dissected from Kv1.1V408A/+ mice. Spontaneous bursting activity, as well as that evoked by sciatic nerve stimulation, was exacerbated by muscle fatigue, ischemia and low temperatures. These stressors also increased the amplitude of compound muscle action potential. Such abnormal neuromuscular transmission did not alter fiber type composition, neuromuscular junction and vascularization of LG muscle, analyzed by light and electron microscopy. Taken together these findings provide direct evidence that identifies the motor nerve as an important generator of myokymic activity, that dysfunction of Kv1.1 channels alters Ca2 + homeostasis in motor axons, and also strongly suggest that muscle fatigue contributes more than PNS fatigue to exacerbate the myokymia/neuromyotonia phenotype. More broadly, this study points out that juxtaparanodal K+ channels composed of Kv1.1 subunits exert an important role in dampening the excitability of motor nerve axons during fatigue or ischemic insult.
Abbreviations: EA1, episodic ataxia type 1; Kv, voltage-gated potassium channel; LG, lateral gastrocnemius; EMG, electromyography; HFS, high frequency stimulation; CMAP, compound muscle action potential; GSL I, griffonia simplicifolia lectin I; 2P-LSM, two-photon laser scanning microscopy
Keywords: Ataxia, Voltage-gated potassium channel, Kv1.1, KCNA1, Myokymia, Sciatic nerve, Stress, Fatigue, Ischemia, Ca2 + signals
Highlights
► Kv1.1V408A/+ mice recapitulate the spontaneous and stress-induced neuromuscular hyper-excitability of EA1. ► The motor nerve is an important generator of myokymic activity. ► Dysfunction of Kv1.1 channels alters Ca2+ homeostasis in motor axons that likely contributes to myokymic activity ► Muscle fatigue contributes more than PNS fatigue to exacerbate myokymia/neuromyotonia. ► Juxtaparanodal K+ channels composed of Kv1.1 subunits tone down nerve excitability during fatigue or ischemic insult.
Introduction
Episodic ataxia type 1 (EA1) is an autosomal dominant neurological disorder affecting both the central nervous system (CNS) and peripheral nervous system (PNS) that results from heterozygous mutations in the Shaker-like K+ channel Kv1.1 (KCNA1; reviewed in Pessia and Hanna, 2010; Kullmann, 2010; Rajakulendran et al., 2007). The hallmark of EA1 is continuous myokymia (muscle twitching with a rippling appearance, intermittent cramps and stiffness) and episodic attacks of generalized ataxia with jerking movements of the head, arms, legs and loss of balance. Other neuromuscular findings include unusual hypercontracted posture, abdominal wall muscle contraction, elbow, hip, and knee contractions and shortened Achilles tendons that may result in tiptoe walking. Myokymia is commonly detected in individuals with EA1 during and between attacks and is usually evident as a fine rippling in perioral or periorbital muscles and by lateral finger movements when the hands are held in a relaxed, prone position. Electromyographic (EMG) recordings show that spontaneous myokymia is distinguished by a pattern of either rhythmically or arrhythmically occurring singlets, duplets, or multiplets. Attacks of ataxia and periods of more intense myokymic activity are both precipitated by stress including exercise or fatigue. In some individuals, myokymic discharges may become apparent or gradually rise in frequency and intensity after the application of regional ischemia. Also temperature changes may affect myokymia and trigger attacks of ataxia (Eunson et al., 2000).
Clinical studies suggested that the motor unit of EA1 individuals is hyperexcitable (Brunt and Van Weerden, 1990; Tomlinson et al., 2010), although, the distinct contributions of the CNS, motor neuron cell body, axon or muscle fiber to myokymia/neuromyotonia are not completely understood. Action potentials (AP) propagate rapidly in myelinated axons by saltatory conduction. The juxtaparanodal regions of myelinated axons express a macromolecular membrane complex composed of Kv1.1, Kv1.2, the accessory subunit Kvβ1.2 and the contactin-associated protein Caspr2 (Poliak et al., 1999; Vacher et al., 2008; Wang et al., 1993). This macromolecular complex has also been found at the level of axons branching in both the CNS and PNS (Tsaur et al., 1992; Wang et al., 1994). The role of myelin-covered K+ channels Kv1.1 in neuromuscular transmission has been investigated by using Kv1.1-null mice which did not display spontaneous discharges from phrenic nerve–diaphragm muscle preparations, ex vivo (Zhou et al., 1998, 1999). Nevertheless, the phenotype could be unmasked by non-physiological low temperatures (~ 20 °C) which resulted in stimulus-induced repetitive discharges (Zhou et al., 1998, 1999). The effects of additional stressors such as fatigue and ischemia were not investigated. Zhou et al. (1999) concluded that the temperature-induced neuromuscular hyper-excitability in the mutant occurs solely as a result of losing K+ channels normally concealed in the segment just preceding the terminal and not elsewhere in the myelinated fiber. However, this conclusion is somehow inconsistent with the slower repolarization phases of the compound action potentials measured from sciatic nerves of Kv1.1-null mice (Smart et al., 1998) and with EA1 clinical findings (Brunt and Van Weerden, 1990; Tomlinson et al., 2010), which suggest that the nodes along the fiber are also affected by loss of Kv1.1 channels. Overall, the Kv1.1-null mouse does not faithfully recapitulate the EA1 phenotype possibly due to the unpredictable compensatory effects resulting from genetic inactivation of Kv1.1 channels.
A knock-in animal model of EA1 has been generated by inserting the heterozygous EA1 mutation V408A in one Kv1.1 allele: Kv1.1V408A/+. These animals displayed abnormal cerebellar basket cell–Purkinje cell synaptic transmission. Furthermore, isoproterenol administration to Kv1.1V408A/+ animals, a procedure that produces stress-fear responses, induced motor dysfunction in Kv1.1V408A/+ animals similar to EA1 (Herson et al., 2003). This evidence clearly demonstrated that dysfunction of Kv1.1 channels, caused by a very subtle heterozygous mutation in Kcna1 (valine to alanine substitution), alters the transmission of signals within a distinct cerebellar circuitry. To date, the effects of this mutation on the neuromuscular transmission of Kv1.1V408A/+ animals have not been investigated. Therefore, to gain insights about the fundamental neuromuscular defects underlying EA1 in an exquisitely physiological and pathological setting, both in vivo and ex vivo LG muscle–nerve preparations from Kv1.1+/+ and Kv1.1V408A/+ mice were investigated electromyographically and by means of two-photon laser scanning microscopy (2P-LSM). Here we show that the insertion of V408A mutation in mice results in spontaneous muscle discharges, abnormal Ca2 + signaling in motor axons and fatigue-, ischemia- and temperature-enhanced myokymic activity. These findings highlight the distinct role played by the motor nerve and muscle in spontaneous and stress-enhanced myokymic activity and shed new light on the functional role played by K+ channels segregated under the myelin sheath, which becomes crucial in certain situations of physiological stress.
Methods
Surgical procedures
This study was carried out on laboratory bred adult (P90 ± 10 days) Kcna1+/+ and Kcna1V408A/+ male mice. The procedures that involve the use of animals are in accordance with the regulations of the Italian Animal Welfare Act and approved by the local Authority Veterinary Service and in accordance with the NIH Guide for the Care and Use of Laboratory Animals. Sodium pentothal at the indicated dosage (50 mg kg− 1 i.p.) was used to induce and maintain anesthesia. The level of anesthesia was verified by a stable heart rate and pupillary diameter throughout the experiment. The trachea was cannulated and end-tidal CO2 concentration was monitored throughout all experiments. When necessary, the animals were artificially ventilated. The femoral blood pressure was measured and maintained at a constant level within the physiological range. The body temperature was controlled by maintaining the rectal temperature close to 37.5 °C using a feedback-regulated heating blanket. Under a dissecting microscope, the nerve and the LG muscle were isolated in the popliteal fossa and all other hindlimb muscles were denervated. The central stump of the sciatic nerve was sectioned at its entry into the posterior leg fossa. The legs were fixed by clamping the hip, knee and ankle. The Achilles' tendon was detached from its distal insertion and connected to a strain gauge. A recording chamber bordering the surgery site was applied in order to submerge the LG muscle and its nerve in mineral oil that was maintained at 37 °C by using a servo controlled thermoresistance. A pair of platinum stimulating wires was placed on the sciatic nerve, with the cathode towards the muscle. To activate motor fibers, single pulses of 0.1 ms duration and with 0.18–0.22 μA intensity were delivered. The intensity of the stimulus was adjusted in order to evoke half-maximal compound muscle action potential (CMAP).
EMG recording
For bipolar recordings of spontaneous or evoked EMG activity, paired hook wires (0.1 mm diameter, copper) were inserted by hollow needles into the medial portion of the LG muscle, approximately 1 mm above nerve entry. The electric signal was amplified by using a Grass P511 amplifier (Quincy, MA, USA) with the filters set at 10–500 Hz and stored using an ATMIO 16E10 acquisition and analysis system (National Instrument, Austin, TX, USA). The EMG activity was rectified and integrated. To exclude the noise from the signal, any electrical activity of amplitude lower than any recognizable motor unit EMG activity was eliminated.
Muscular tension
LG muscle tension was measured by using a force transducer (F03 Grass, Quincy, MA, USA). The optimal muscle length (L0) for the maximal twitch force was determined and all force recordings were then performed at this optimal length. Most of the muscle mechanical recordings were performed in isometric condition with the external load exceeding the maximal force production (4 g load). Some experiments were performed in quasi-isotonic condition with a minimal load (10 mg load). Contractions were elicited by electrical stimulation delivered by bipolar platinum electrodes placed on the isolated nerve of the LG muscle.
Muscle fatigue
LG muscle fatigue was induced by high frequency stimulation (HFS) trains delivered to the LG motor nerve (a train lasted 600 ms at a fusion frequency of 85 Hz, with a 1 s interval between each train). To induce different degrees of fatigue, HFS trains lasting 30, 60, 180 s were applied. The effect of fatigue on the muscle force was evaluated by measuring both the force decay during HFS trains and the twitch peak tension elicited 10 s before and after stimulation. Fatigue index was calculated as the area on the envelope around the force curve for the second minute divided by that for the first minute of the test.
Muscular ischemia and temperature
To provoke muscle ischemia, the artery and venous vessels supplying the LG muscle were temporarily occluded for 3 min at their entry into the muscle using a micro-bulldog clip. The effect of ischemia on twitch force was recorded in combination with the EMG activity. The recording temperature was lowered in two degree steps from 36 °C to 22 °C and raised again to 36 °C by changing the setting point of the thermoresistance.
Analysis of EMG recordings
The EMG activity was integrated in 1 s epoch. The values were normalized with respect to the integrated value of the CMAP evoked at the beginning of each experiment (EMG integration/CMAP integration) to compare the responses obtained from different experiments. This procedure is based on the assumption that the CMAP are not different between Kcna1+/+ and Kcna1V408A/+ mice. To examine the time course of the responses elicited by the electrical stimulation during the early periods, EMG integration was performed in 100 ms epoch. These values were multiplied by a factor of 100 in order to obtain data comparable with those calculated in 1 s epoch. The statistical analysis was performed by using Student's paired t-test and ANOVA. A difference of p < 0.05 was considered to be statistically significant.
LG nerve–muscle dissection and dye loading
Mice from both groups were anesthetized with an intraperitoneal injection of chloral hydrate (4% in saline solution) and an incision was made under a surgical microscope on the left side at mid thigh level to expose the sciatic nerve via blunt dissection. The sciatic nerve in the thigh was removed along with the underlying part of the caudofemoralis muscle (still attached to the nerve by the posterior mesoneurium) and immediately transferred in a holding chamber containing aCSF gassed with 95% O2 and 5% CO2 at room temperature. The aCSF was composed of (mM) 126 NaCl, 3.5 KCl, 1.3 MgCl2, 2 CaCl2, 1.2 NaH2PO4, 25 NaHCO3, and 10 glucose, pH 7.4.
To image Ca2 + signals in the sciatic nerve the whole preparation was incubated for 2 h in Fluo3-AM (Invitrogen) in accordance with a previously published procedure (MacLean and Yuste, 2005). Briefly, Fluo-3AM (50 μg) was dissolved in 48 μl of DMSO and 2 μl of 20% pluronic acid to make a 1 mM solution. This stock solution was then added to 5 ml of oxygenated aCSF to give a final concentration in the bath of 10 μM fluo-3AM. To the same mixture, the red emitting Ca2 + insensitive reference indicator sulforhodamine 101 (SR-101) was added to a final concentration of 100 μM (Ren et al., 2000). The Ca2 + indicator was chosen for several reasons. Most importantly, the quantum efficiency of fluo-3AM is relatively high and the signal-noise ratio can be greater than many of the other commercially available dyes. The SR-101 was used to image axon profiles in the nerve and to confirm through a series of image pairs collected simultaneously from both detector channels (red and green) that the regions of interest (defined by the appearance of Ca2 + signals) were localized within the axonal profiles.
Two-photon laser scanning microscopy
The whole LG nerve–muscle preparation was then transferred to a mini submerged chamber (0.5 ml) with a coverglass bottom (Warner Instrument Corporation, Hamden, CT) mounted on the stage of an upright multiphoton microscope. To prevent movement during image acquisition, the preparation was secured by means of a nylon mesh glued to a U shaped platinum wire that totally submerged the tissue in a continuously flowing aCSF at a rate of 3 ml/min (oxygenated with 95% O2/5% CO2; warmed to 33 ± 1 °C) and washed for 1 h before recording. High-resolution ex vivo two-photon imaging was performed with a custom-modified Olympus BX50W1 upright microscope (Olympus, Tokyo, Japan) designed for low dispersion. The system includes Keplerian beam expanders with IR introduction light paths to achieve perfect excitation efficiency and highly resolved multiphoton images. A mode-locked MaiTai HP DeepSee laser system (Spectra-Physics) with a tunable Ti:sapphire oscillator (690–1040 nm) was used as the excitation light source (pulse width < 100 fs; pulse repetition rate 80 Mhz) and controlled through an acousto-optical-modulator to allow for precise changes in laser intensity. The Group Velocity Dispersion was electronically compensated by a prism-coupled pre-chirper and the beam diameter was adjusted by a Keplar telescope. Images were acquired with a water-based 25 × Olympus XLPLN25xWMP multiphoton objective (NA 1.05, WD 2.0) and FluoView imaging software using time-series. Excitation wavelength was 810 nm. Two-channel detection of emission wavelength was achieved by using a 565-nm dichroic (Chroma) and two external photomultiplier tubes. A 515/560 bandpass filter (Chroma) was used to detect fluo-3AM emission wavelength, and a 590/650 bandpass filter (Chroma) was used to detect SR-101 signals. Time series of fluorescent images were collected with the following parameters: 128 × 128 pixel images, optical zoom 4 × with × 25 objective (N.A. 1.05), 200 frames, 850 ms/frame, 3-μs pixel dwell time, laser power of about 50 mW at sample. Bidirectional scanning was used to increase scan speed and scanners were always calibrated for XY alignment before each acquisition. Ca2 + signals were recorded as changes in mean pixel intensity in defined regions of interest (axonal fibers) over time and expressed as the change in fluorescence divided by the baseline fluorescence (ΔF/F0) (MacLean and Yuste, 2005; Ren et al., 2000). To compare the changes in fluorescence intensity recorded from the sciatic nerve of both Kv1.1+/+ and Kv1.1V408A/+ mice, a moving average smoothing was performed, i.e. an average of every five consecutive data points was calculated and plotted on a graph. Three standard deviations were then added to the moving average. Any data points of ΔF that lay outside these three standard deviations were regarded as a significant change from the mean. χ2 analysis was then performed to assess any statistical significant difference between the number of data points outside three standard deviations for both groups of animals.
Optical and electron microscopy
LG muscles were snap-frozen in isopentane/liquid nitrogen, and maintained in liquid nitrogen until use. Routine hematoxylin and eosin, Gomori-modified Trichrome and NADH staining were performed by using 8 μm-thick cryosections. A small fragment of muscle tissue from contralateral LG was fixed in 4% glutaraldehyde in phosphate buffer, post-fixed in 2% osmium tetroxide, dehydrated and embedded in Spurr resin. Ultrathin sections were stained with uranyl acetate and lead citrate and examined with a Philips 410 electron microscope.
Capillary density and diameters were measured on griffonia simplicifolia lectin I (GSL I)-stained sections at 40 × magnification using the NIH Image software version 1.62 (http://rsb.info.nih.gov/nih-image) as previously described (Zanotti et al., 2005). Twenty fields from each animal were analyzed. Briefly, fields of equal size were photographed and digitalized. By using a software, a threshold was applied to the micrographs to obtain black and white images with areas positive for lectin I in black and negative areas in white. The number of capillaries was counted and the diameters were measured in each field. The mean ± SD was then obtained for each group from the total of all analyzed fields. Cryosections were incubated for 120 min at room temperature in biotinylated GSL I diluted 1:200 (Vector Laboratories, Burlingame, CA, USA) and followed by a 60 min incubation in Rhodamine Red™-X-conjugated avidin diluted 1:250 (Molecular Probes, Eugene, OR, USA). Sections were examined under a Zeiss Axioplan fluorescence microscope.
Results
Spontaneous neuromuscular activity in Kv1.1V408A/+ ataxia mice
EMG recordings were carried out, in vivo, from LG muscle of Kv1.1+/+ (n = 10) or Kv1.1V408A/+ (n = 10) mice in isometric condition at L0. The motor nerve supplying LG muscle was severed centrally to eliminate the influence of the CNS on EMG activity. Spontaneous EMG activity was observed in 6 out of 15 Kv1.1V408A/+ mice, but was never observed in Kv1.1+/+ mice (Fig. 1A). The bursting activity observed in the Kv1.1V408A/+ mice consisted of patterns of singlets, duplets or multiplets of variable amplitudes (50–500 μV). The burst frequency varied among Kv1.1V408A/+ animals and ranged from 1 to 5 bursts/s. In Kv1.1V408A/+ mice, displaying spontaneous EMG activity, the integrated EMG value was evaluated in 1-s long epoch and normalized to CMAP. This normalized value was ~ 1 for Kv1.1V408A/+ mice and it was significantly different from that calculated for Kv1.1+/+ mice (Fig. 1C; p < 0.001). In the same group of mice, single electric pulses were delivered every 1 s to the peripheral stump of the LG motor nerve. Electric shocks evoked direct EMG responses in both groups of mice mostly characterized by typical triphasic CMAPs occurring with a distinct delay (Fig. 1B). The electric shock also elicited early and delayed bursting activity in all Kv1.1V408A/+ mice but not in Kv1.1+/+ (Fig. 1B). By normalizing the integrated area of the delayed evoked activity for Kv1.1V408A/+ (EMG/CMAP) we observed a significant increase of this value compared to either that evoked in Kv1.1+/+ or spontaneously occurring in Kv1.1V408A/+ mice (Fig. 1C). The delayed discharges reached a maximal intensity within 300–600 ms after the electric shock and declined thereafter (Fig. 1D). Thus, the EMG response elicited by axon stimulation displayed a biphasic shape, denoting a sequence of events that leads to early and rebound abnormal activity.
Fig. 1.

Kv1.1V408A/+ ataxia mice display spontaneous muscle discharges. EMG recordings from LG muscles of Kv1.1+/+ (top traces) and Kv1.1V408A/+ (bottom traces) showing spontaneous activity (A) and that following the nerve-evoked CMAP (B). Enlargements of the traces are reported below to show the shape of the spontaneous and evoked repetitive muscle activity for Kv1.1V408A/+ that was absent in all Kv1.1+/+ mice tested. (C) Bar graphs showing the averaged values of the integrated bursting activity normalized to the integrated CMAP (EMG/CMAP) either in resting conditions (spontaneous) or during the post-stimulus periods (evoked) for both Kv1.1+/+ (open bars, n = 10) and Kv1.1V408A/+ mice (dashed bars, n = 10). Note that for Kv1.1V408A/+ mice the evoked EMG activity is remarkably higher also to its own spontaneous level of activity (**p < 0.01, ***p < 0.001). (D) Plot of the EMG activity evoked in Kv1.1V408A/+ mice as a function of time. The integrated values were calculated just after the CMAP and multiplied by 10. Note that the single shock stimulation of the motor nerve elicited an immediate induction of EMG activity, followed by a second peak 400–600 ms later that gradually decayed. Data are means ± SEM of 10 animals.
The sciatic nerve of Kv1.1V408A/+ mice displays spontaneous Ca2 + signals
To investigate the role played by the sciatic nerve in the myokymic activity observed from Kv1.1V408A/+ ataxia mice, Ca2 + signals were recorded by fluorescent imaging of the sciatic nerve, ex vivo, previously loaded with the calcium sensitive dye fluo-3AM (Lev-Ram and Ellisman, 1995). In one set of experiments, the sciatic nerve branching over the LG muscle was visually localized. Afterward, 2P-LSM imaging of this structure from Kv1.1V408A/+ mice revealed intense Ca2 + signals occurring spontaneously (Figs. 2B,E). In another set of experiments, the localization of Ca2 + signals within sciatic nerve branches, dissected from Kv1.1V408A/+ mice, was confirmed by using the Ca2 + insensitive reference indicator sulforhodamine 101 (SR-101) that allowed the direct visualization of the axon profiles in the nerve. Therefore, the fluorescence values (∆F/F0) determined in both experimental conditions were combined. In nerves from Kv1.1V408A/+ mice, Ca2 + signals occurred in bursts characterized by singlets, duplets or multiplets of variable amplitude and frequency that ranged from 0.8 to 4.5 bursts/s (Fig. 2B). To estimate the overall intensity of these signals the fluorescence values (∆F/F0) were integrated and averaged. The values for Kv1.1V408A/+ nerves (n = 5) were remarkably higher than the Kv1.1+/+ (n = 5; Fig. 2C; ANOVA; p < 0.001). Although such dramatic Ca2 + transients were never observed from preparations dissected from Kv1.1+/+ mice and imaged as described above, some recordings displayed oscillations in fluorescence intensity (Fig. 2A). To provide for these changes, a moving average smoothing was calculated for each set of data of every experiment and any data points of ΔF that lay outside three standard deviations were regarded as a significant change in fluorescence from the mean (see Methods). The χ2 analysis revealed a remarkable statistical difference between the Kv1.1+/+ and Kv1.1V408A/+ data sets (Fig. 2D; p < 0.001). These results strongly suggest that the abnormal Ca2 + signals in sciatic nerve of Kv1.1V408A/+ mice are due to the insertion of a heterozygous V408A mutation in their Kcna1 gene.
Fig. 2.

Ca2 + signals occur spontaneously within the sciatic nerve of Kv1.1V408A/+ ataxia mice. Representative traces showing changes in Ca2 + signals over time recorded from the sciatic nerve of Kv1.1+/+ (A) and Kv1.1V408A/+ (B) mice. (C) Bar graph showing the averaged values of the integrated fluorescence signals (∆F/Fo) for both Kv1.1+/+ (open bars, n = 5) and Kv1.1V408A/+ mice (dashed bars, n = 5). Note that the integrated Ca2 + fluorescence recorded in resting conditions from the sciatic nerves of Kv1.1V408A/+ mice is remarkably higher than in normal animals (ANOVA;***p < 0.001). (D) Bar graph showing the number of ΔF data points that lay outside three standard deviations from the mean fluorescence recorded from the sciatic nerves of both Kv1.1+/+ (open bars) and Kv1.1V408A/+ (dashed bars; χ2 analysis: ***p < 0.001). (E) Representative series of two-photon imaging acquired before (top panel) and during the occurrence of abnormal Ca2 + signals (bottom panel, boxed area) in a small branch of the sciatic nerve visualized within a LG muscle dissected from a Kv1.1V408A/+ mouse.
Influence of muscle fatigue on LG muscle force and EMG activity
To study the responses of LG muscle to stress which typically mimic muscle fatigue, trains of high frequency stimulations (HFS) were applied to the LG motor nerve. In isometric condition at L0, HFS trains induced similar muscle fatigue in both Kv1.1+/+ (n = 15) and Kv1.1V408A/+ (n = 15) mouse types. This is shown by the similar reductions of tetanic and twitch peak tension in both groups of animals (Figs. 3A,C). The tension decreases were 62 ± 1.5% and 63 ± 2%, respectively (p > 0.05; Fig. 3C). The time constants (τ) of the tetanic tension decay and the fatigue index (FI) were also similar (Kv1.1+/+: τ = 21 ± 1 s and FI = 0.53; Kv1.1V408A/+: τ = 25 ± 3 s and FI = 0.52; p > 0.05; Figs. 3D,E). Complete twitch tension recovery occurred within 25–30 min. This and its progression over time occurred similarly in both groups of mice (p > 0.05; Fig. 3F). HFS trains were also delivered while keeping the Kv1.1V408A/+ muscle in “quasi-isotonic” condition. In this condition there was a twitch tension decrease of less than 5%, indicating that muscle fatigue was minimal (Fig. 3B).
Fig. 3.

Fatigue of LG muscle induced by high frequency motor nerve stimulation. Sample traces showing muscle fatigue induced from Kv1.1V408A/+ mice by HFS trains in isometric condition (A) and “quasi-isotonic condition” (B). Twitch (arrow) and tetanic (filled circle) muscle contractions were elicited before and after fatiguing stimulation. Note the remarkable tension decrease that occurred only in isometric condition. (C–E) Bar graphs showing the effect of fatigue, induced in isometric condition, on muscle tension decrease (C; the values were calculated at the end of HFS trains), time constants of tetanic tension decay (D; peak tension values were fitted with a single exponential function) and fatigue index (E; tension (2′ min) / tension (1′ min)) for Kv1.1+/+ (open bars) and Kv1.1V408A/+ (dashed bars) mice. (F) Time course of the recovery from muscle fatigue for Kv1.1+/+ (open square) and Kv1.1V408A/+ (filled square). Concerning the overall effects of fatigue, note that there is no significant difference between the two groups of animals (p > 0.05). Data are means ± SEM of 15 animals.
LG muscle tension measurements were performed concomitantly with EMG recordings (Fig. 4 inset). The EMG activity in Kv1.1+/+ mice remained silent before and after the tetanic stimulation throughout the entire recovery period from fatigue (Fig. 4A). Conversely, fatigue stimulation increased spontaneous EMG bursting activity by eliciting singlets, duplets and multiplets from Kv1.1V408A/+ mice (Fig. 4B). EMG bursting was enhanced when the resting activity was present (4 out of 10 animals), while it become apparent and more intense when the spontaneous activity was absent (6 out of 10 animals). The value of the integrated spontaneous EMG activity for Kv1.1V408A/+ mice became maximal ~ 10–15 min after the end of HFS trains, reaching ~ 2.5-fold increase compared to pre-fatigue values. Thereafter, it reduced and approached the pre-fatigue value (Figs. 4B,C). Statistical comparison of the EMG integrated values calculated after the end of fatigue stimulation for Kv1.1+/+ and Kv1.1V408A/+ mice was significantly different (p < 0.001). In another group of mice the activity evoked in response to electric pulses delivered to the motor nerve was examined. The EMG activity following electric shocks remained silent in all Kv1.1+/+ animals (n = 15) before and after muscle fatigue induction (Fig. 4A). By contrast, a delayed bursting activity was recorded from Kv1.1V408A/+ mice (n = 15) both in silent pre-fatigue muscles (9 out of 15) and in bursting muscles (6 out of 15). The post-stimulus activity was maximal ~ 10 min after HFS, when it reached ~ 12-fold increase compared to pre-fatigue level and, then, declined to approach the control value 25–30 min later (Figs. 4B,D). The after-discharges increased immediately after the electric shock, presented a second peak at ~ 300–400 ms post-stimulus and declined thereafter (Fig. 4E). The analysis of CMAP was also performed by integrating the evoked three-phasic waves before and after HSF trains. In Kv1.1+/+ mice, the evoked responses showed ~ 15% reduction immediately after the fatiguing stimulation and returned to control level (Figs. 5A,C). Conversely, CMAPs increased remarkably in Kv1.1V408A/+ muscles, reaching a maximal amplitude (~ 5-fold increase) ~ 15 min after HSF trains (Figs. 5B,C).
Fig. 4.

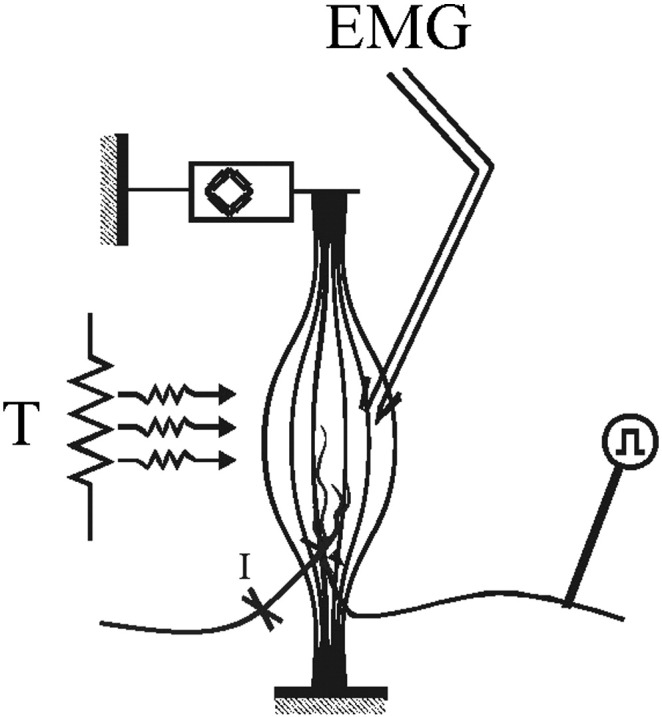
Fatiguing HFS trains enhance spontaneous and evoked bursting activity in Kv1.1V408A/+ mice. Cartoon showing the experimental configuration for EMG recording and muscle fatigue induction (inset on the left hand side up). (A,B) Sample traces of EMG recorded from LG muscles of Kv1.1+/+ (A) and Kv1.1V408A/+ (B) mice showing the spontaneous activity and that evoked by motor nerve stimulation. Recordings were performed before (pre) and at different periods elapsing from the delivery of HFS trains (time reported on the left side). (C,D) Plots showing the spontaneous (C; n = 10) and evoked (D; n = 15) integrated EMG activity determined before and after fatiguing stimulation (indicated by a horizontal bar: HFS) for both Kv1.1+/+ (open square) and Kv1.1V408A/+ (filled square) mice. The time course of the recovery of twitch tension from fatigue (dotted line) is reported above each plot for direct comparison. Note that only in Kv1.1V408A/+ mice fatiguing stimulations increase remarkably both the spontaneous and evoked EMG activity. Respectively, these bursting activities reached a peak ~ 15 and ~ 10 min after HFS trains. (E) Plot of the integrated EMG activity for Kv1.1V408A/+ mice determined during 1 s epoch elapsing from the sciatic nerve stimulation. Note that the electric shock induces an immediate increase of the EMG activity, followed by a second peak 300–400 ms later.
Fig. 5.

Fatiguing HFS trains increase the CMAP of Kv1.1V408A/+ mice. CMAP evoked from LG muscles of Kv1.1+/+ (A) and Kv1.1V408A/+ (B) mice and recorded before (pre) and after the delivery of HFS trains (the time at which the evoked potentials are recorded and analyzed is reported on the left hand side). (C) Plot of the integrated CMAP as a function of time elapsing from HFS train delivery and normalized to pre-fatigue value for Kv1.1V408A/+ (filled square; n = 15) and Kv1.1+/+ (open square; n = 15) mice. The time course of the recovery of twitch tension from fatigue is reported above the plot for direct comparison. Note that fatiguing stimulations increase remarkably the CMAP of Kv1.1V408A/+ mice, which reached a peak 15 min after the delivery of HFS trains. Conversely, the same procedure reduced slightly the CMAP of Kv1.1+/+ muscles. (D) Bar graph of the evoked EMG bursting activity elicited by HFS trains and integrated in either isometric or “quasi-isotonic” condition (n = 5). Note that the bursting activity in isometric condition was significantly higher than quasi-isotonic condition (***p < 0.001). (E) Integrated CMAP values were determined in either “quasi isotonic” condition, upon the delivery of HFS trains lasting 180 s (indicated as isotonic), or in isometric condition by varying the duration of HFS trains from 30 to 180 s. This procedure was used to induce different degrees of fatigue. The circles include the responses of four Kv1.1V408A/+ mice under the conditions indicated on the right hand side. Linear regression was used to fit the data points (dashed line). Note that the integrated CMAP values increase linearly with the intensity of the stimulations.
To assess the role of the degree of muscle fatigue on the induction of bursting, HFS trains were delivered while keeping the Kv1.1V408A/+ muscle in “quasi-isotonic” condition. Under this condition muscle fatigue was minimal (see Fig. 3B) and EMG bursting activity was neither significantly increased when spontaneously present nor elicited in silent Kv1.1V408A/+ muscles (Fig. 5D; p > 0.05). Also the duration of HFS trains were changed in isometric conditions to induce different degrees of muscle fatigue in Kv1.1V408A/+ mice. HFS trains lasting 30, 60 and 180 s induced muscle tension decrease of ~ 35%, ~ 55% and ~ 62%, respectively. In all these different fatigue conditions the bursting activity, as well as the CMAP were enhanced (Figs. 5D,E). In particular, CMAP amplitude (measured just after HFS delivery) increased linearly with tension decrease while it did not change in “quasi-isotonic” condition (R = 0.98, p < 0.001; Fig. 5E).
Optical and electron microscopy analysis of LG muscle and nerve preparations
The repetitive firing of the Kv1.1V408A/+ muscle fibers combined with clinical findings reporting enlargement of gastrocnemius fiber type I and II diameters in some EA1 individuals (Van Dyke et al., 1975) prompted us to perform morphological studies on LG muscle sections and nerves derived from Kv1.1+/+ and Kv1.1V408A/+ adult mice (Supplemental Fig. 1A). LG muscles dissected from these animals had similar muscle mass. This is demonstrated by the insignificant statistical difference between the ratios of the muscle-to-body weight, which were 5.4 ± 0.03 mg/g and 5.3 ± 0.04 mg/g, respectively (n = 30; p > 0.05). Histograms of the frequency distribution for fiber type I and type II diameters were constructed for both Kv1.1+/+ and Kv1.1V408A/+ LG muscles and the average diameters for both fiber types were similar (Supplemental Figs. 1B–G). Finally, the electron microcopy analysis of the neuromuscular junction also revealed no obvious differences (Supplemental Fig. 1A). We also investigated the possible effects of repetitive firing on muscle vascularization. However, neither the capillary density nor the capillary diameter of LG muscles for both Kv1.1+/+ and Kv1.1V408A/+ mice was significantly different (Supplemental Figs. 2A–C). Taken together these findings imply that the spontaneous and fatigue-induced LG neuromuscular hyper-excitability do not result in major morphological changes in LG muscles from Kv1.1V408A/+ mice.
Supplemental Fig. 1.

Normal morphology of LG nerve–muscle of Kv1.1V408A/+ mice. (A) Representative photomicrographs of LG muscles and of neuromuscular junctions from Kv1.1V408A/+ (top panels) and Kv1.1+/+ (bottom panels) mice. The morphology of the muscle was analyzed by Gomori Trichrome (GTR) and hematoxylin–eosin (H&E) and the fiber type composition by NADH (× 200). (ElM) Electron microscopy photomicrographs of the neuromuscular junctions (× 4400). Frequency distribution for type I (B, C) and type II (E, F) muscle fibers calculated for the mouse strains indicated on top. Bar graphs showing the average diameter of fiber type I (D) and type II (G) for Kv1.1+/+ and Kv1.1V408A/+ muscles. Note that muscle morphology and fiber type composition were normal for both Kv1.1+/+ and Kv1.1V408A/+ mouse strains.
Supplemental Fig. 2.

The distribution and dimension of capillaries in LG muscle are similar between Kv1.1+/+ and Kv1.1V408A/+ mice. (A) Immunostaining of capillaries with GSL I for the indicated mouse strains (× 400). Bar graphs showing the mean diameter of capillaries (B) and the number of capillaries per mm2 (C) in the LG muscle dissected from the two indicated groups of animals.
Ischemia exacerbates LG nerve–muscle excitability in Kv1.1V408A/+ mice
To induce ischemia, the artery and venous vessels supplying the LG nerve and muscle of Kv1.1+/+ (n = 5) and Kv1.1V408A/+ (n = 5) mice were temporarily occluded (3 min; Supplemental Fig. 3). The effectiveness of ischemia was evaluated indirectly by measuring muscle twitch tension in isometric conditions (Supplemental Fig. 4). Twitch tension decreased ~ 60% at the end of the ischemic period, without significant differences between Kv1.1+/+ and Kv1.1V408A/+ muscles (p > 0.05; Supplemental Fig. 4). After vessel re-opening, twitch tension gradually recovered within ~ 30 min in both groups of animals. EMG activity was recorded before, during ischemia and reperfusion while delivering single electric shock to sciatic nerve. In none of these conditions were after-discharges ever detected in Kv1.1+/+ mice (Fig. 6A). Whereas, in 4 out of 5 Kv1.1V408A/+ animals, ischemia elicited delayed activity consisting of singlets, duplets and multiplets (Fig. 6B). In the remaining mouse, the spontaneous activity was present in resting conditions and was increased by ischemia. The dynamics of the EMG activity enhancement and of the twitch tension decrease differed. Indeed, the former continued to increase during the early period of reperfusion reaching a peak of activity ~ 5 min after vessel re-opening (Fig. 6C). Thereafter, EMG activity decreased over a period of 20–30 min (Fig. 6C). The electric shock induced a biphasic increase of the after-discharges which reached an early peak soon after the stimulus and a second peak at 400 ms. This activity declined within 1 s (Fig. 6E). Moreover, the CMAP elicited in Kv1.1V408A/+ mice increased progressively, starting 2 min after ischemia induction, reached ~ 6-fold increase ~ 5 min after vessel reopening and declined thereafter (Fig. 6D). Conversely, ischemia reduced the CMAP in Kv1.1+/+ mice (Fig. 6D). Interestingly, both the bursting activity (Fig. 6C) and the CMAP enhancement induced by ischemia (Fig. 6D) displayed a similar time course. The overall statistical evaluation of the effects of ischemia on the integrated values of bursting activity and CMAP calculated for Kv1.1+/+ and Kv1.1V408A/+ mice resulted in significant differences (p < 0.01).
Supplemental Fig. 3.
Cartoon showing the experimental configuration.
Supplemental Fig. 4.
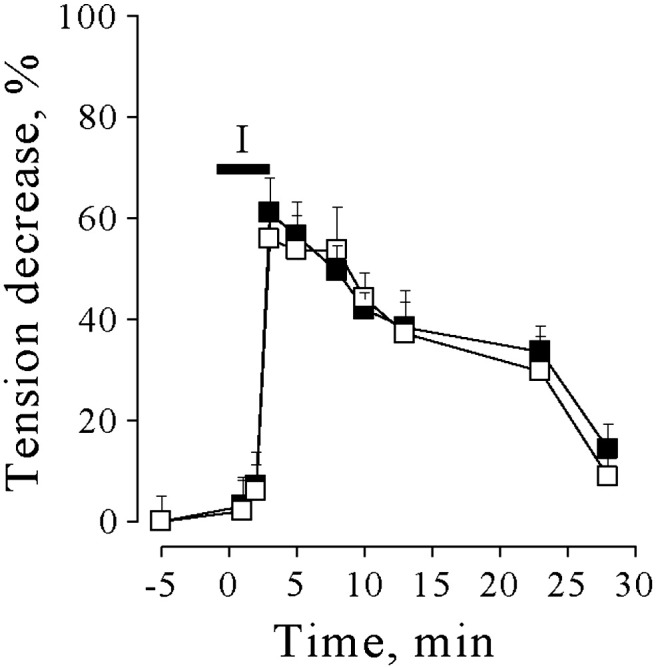
Effects of ischemia on the mechanical responses of LG muscle. Muscle twitch tension decrease during and after 3 min of occlusion of artery and venous blood vessels supplying the LG muscle of Kv1.1+/+ (open squares) and Kv1.1V408A/+ (filled squares) mice. The horizontal bar marked I (ischemia) indicates the period during which ischemia was induced.
Fig. 6.

Effects of ischemia and temperature on EMG activity of LG muscle. (A,B) Effects of ischemia on EMG activity recorded from LG muscles of Kv1.1+/+ (A) and Kv1.1V408A/+ mice (B) after sciatic nerve stimulation by single electric shock. The representative traces were recorded before (pre), during ischemia (I) and at different periods following reperfusion of LG nerve and muscle (indicated on the left hand side of traces). Note that while this procedure does not affect EMG responses from Kv1.1+/+, it exacerbates delayed bursting activity in Kv1.1V408A/+ animals. (C) Time course of integrated and normalized EMG bursting activity for Kv1.1+/+ (open squares; n = 5) and Kv1.1V408A/+ (filled squares; n = 5) before, during and after ischemia. (D) Plot of the integrated CMAP before, during and after ischemia for both Kv1.1+/+ (open squares) and Kv1.1V408A/+ (filled squares) mice. The twitch tension decrease (see Supplemental Fig. 4) is timely matched above plots C and D for direct comparison (insets). The horizontal bars marked I (ischemia) in panels C, D indicate the period during which ischemia was induced. Note that both bursting activity and the CMAP were increased remarkably by ischemia in Kv1.1V408A/+ mice. These effects were maximal just after blood re-perfusion, while the twitch tension reduction was maximal at the third minute of ischemia (inset). Conversely, ischemia reduced slightly and temporarily the CMAP in Kv1.1+/+ mice (n = 5). (E) Plot of the integrated EMG activity for Kv1.1V408A/+ mice determined during 1 s epoch elapsing from sciatic nerve stimulation. Note that the electric shock induces an immediate increase of the EMG activity followed by a second peak ~ 400 ms later and a gradual decay to pre-stimulus values. (F, G) Effects of temperature on EMG activity recorded from LG muscles of Kv1.1+/+ (F) and Kv1.1V408A/+ (G) upon sciatic nerve stimulation. The representative traces were recorded while varying the temperature of the LG muscle–nerve preparation gradually from 36 °C to 22 °C and back to 36 °C (reported on the left hand side of sample traces). Note that cooling exacerbates delayed bursting activity in Kv1.1V408A/+ while it does not affect the responses of Kv1.1+/+ animals. (H) Averaged EMG activity estimated as integral of the entire post-stimulus periods and every two degrees of cooling for Kv1.1+/+ (open squares; n = 7) and Kv1.1V408A/+ (filled squares; n = 7). Note that bursting activity was exacerbated by cooling below ~ 28 °C and reached maximal intensity at 22 °C. (I) Averaged EMG activity recorded at 22 °C, expressed as integrated values and plotted as a function of the post-stimulus duration for both Kv1.1+/+ (open square) and Kv1.1V408A/+ (filled square) mice. Note that bursting activity reached the maximal intensity ~ 100 ms after the electric shock and declined thereafter. (J) Bar graph of the integrated CMAP recorded at 22° from Kv1.1+/+ (open bar) and Kv1.1V408A/+ (dashed bar) mice normalized to the CMAP recorded at 36 °C (n = 7; *p < 0.05).
Effects of ischemia and temperature on EMG activity of LG muscle. (A,B) Effects of ischemia on EMG activity recorded from LG muscles of Kv1.1+/+ (A) and Kv1.1V408A/+ mice (B) after sciatic nerve stimulation by single electric shock. The representative traces were recorded before (pre), during ischemia (I) and at different periods following reperfusion of LG nerve and muscle (indicated on the left hand side of traces). Note that while this procedure does not affect EMG responses from Kv1.1+/+, it exacerbates delayed bursting activity in Kv1.1V408A/+ animals. (C) Time course of integrated and normalized EMG bursting activity for Kv1.1+/+ (open squares; n = 5) and Kv1.1V408A/+ (filled squares; n = 5) before, during and after ischemia. (D) Plot of the integrated CMAP before, during and after ischemia for both Kv1.1+/+ (open squares) and Kv1.1V408A/+ (filled squares) mice. The twitch tension decrease (see Supplemental Fig. 4) is timely matched above plots C and D for direct comparison (insets). The horizontal bars marked I (ischemia) in panels C, D indicate the period during which ischemia was induced. Note that both bursting activity and the CMAP were increased remarkably by ischemia in Kv1.1V408A/+ mice. These effects were maximal just after blood re-perfusion, while the twitch tension reduction was maximal at the third minute of ischemia (inset). Conversely, ischemia reduced slightly and temporarily the CMAP in Kv1.1+/+ mice (n = 5). (E) Plot of the integrated EMG activity for Kv1.1V408A/+ mice determined during 1 s epoch elapsing from sciatic nerve stimulation. Note that the electric shock induces an immediate increase of the EMG activity followed by a second peak ~ 400 ms later and a gradual decay to pre-stimulus values. (F, G) Effects of temperature on EMG activity recorded from LG muscles of Kv1.1+/+ (F) and Kv1.1V408A/+ (G) upon sciatic nerve stimulation. The representative traces were recorded while varying the temperature of the LG muscle–nerve preparation gradually from 36 °C to 22 °C and back to 36 °C (reported on the left hand side of sample traces). Note that cooling exacerbates delayed bursting activity in Kv1.1V408A/+ while it does not affect the responses of Kv1.1+/+ animals. (H) Averaged EMG activity estimated as integral of the entire post-stimulus periods and every two degrees of cooling for Kv1.1+/+ (open squares; n = 7) and Kv1.1V408A/+ (filled squares; n = 7). Note that bursting activity was exacerbated by cooling below ~ 28 °C and reached maximal intensity at 22 °C. (I) Averaged EMG activity recorded at 22 °C, expressed as integrated values and plotted as a function of the post-stimulus duration for both Kv1.1+/+ (open square) and Kv1.1V408A/+ (filled square) mice. Note that bursting activity reached the maximal intensity ~ 100 ms after the electric shock and declined thereafter. (J) Bar graph of the integrated CMAP recorded at 22° from Kv1.1+/+ (open bar) and Kv1.1V408A/+ (dashed bar) mice normalized to the CMAP recorded at 36 °C (n = 7; *p < 0.05).
V408A mutation in Kv1.1 channels confers marked temperature-sensitivity to neuromuscular transmission in adult mice
EMG recordings were performed from Kv1.1+/+ (n = 7) and Kv1.1V408A/+ (n = 7) mice while the temperature was lowered in two degree steps from 36 °C to 22 °C and raised again to 36 °C by changing the setting point of the thermoresistance (Supplemental Fig. 3). Single electrical motor nerve stimulation never elicited abnormal delayed discharges from Kv1.1+/+ mice when the recording temperature was lowered (Fig. 6F). By contrast, cooling induced post-stimulus discharges were either brought about in 5 out of 7 Kv1.1V408A/+ mice or increased in the remaining 2 animals, in which discharges were present, spontaneously (Fig. 6G). The EMG recordings were characterized by the presence of randomly distributed singlets, duplets and multiplets that resembled those observed under fatigue and ischemia. The analysis of the integrated EMG activity (calculated during the post-stimulus periods and every two degrees of cooling) showed that bursting was either evoked or enhanced when temperature was lowered below 28–26 °C (Fig. 6H). It reached a maximal intensity at 22 °C, whereby ~ 12-fold increase compared to the control value was calculated. Bursting was more intense immediately after the electric shock and declined thereafter (Fig. 6I). The analysis of CMAP at 22 °C yielded a slight decrease for Kv1.1+/+ and a slight increase for Kv1.1V408A/+ muscles, which resulted in a significant difference between the two groups of animals (Fig. 6J).
Discussion
Here we provide direct evidence indicating that the intrinsic hyper-excitability of the motor axon in Kv1.1V408A/+ ataxic mice contributes to myokymia/neuromyotonia phenotype which is exacerbated by stressful events such as fatigue, ischemia and lower temperature. The key findings of the present study point out that: i) Kv1.1V408A/+ mice recapitulate the spontaneous and the stress-induced neuromuscular hyper-excitability observed in EA1 individuals; ii) dysfunction of Kv1.1 channels alters Ca2 + homeostasis in motor axons that is likely to contribute spontaneous myokymic activity; iii) muscle fatigue contributes relatively more than PNS fatigue to exacerbate myokymia/neuromyotonia; and iv) juxtaparanodal K+ channels composed of Kv1.1 subunits tone down nerve excitability during both fatigue and ischemic insult. These findings are pertinent to the understanding of the mechanisms underlying EA1 symptoms caused by the altered transmission of impulses in myelinated PNS nerves such as neuromyotonia/myokymia and their abnormal susceptibility to stressors.
Hyper-excitability of the sciatic nerve
The neuromuscular hyper-excitability is demonstrated by the abnormal presence of EMG bursting activity and Ca2 + signals in resting conditions and by the stress-induced enhancement of both bursting and CMAP. This bursting and such large Ca2 + signals have never been observed in Kv1.1+/+ mice. The peripheral source of spontaneous and evoked bursts from Kv1.1V408A/+ mice is confirmed in our in vivo experimental setting since they are observed in the presence of centrally severed sciatic nerve. The intrinsic hyper-excitability of the axons of Kv1.1V408A/+ mice is also demonstrated by the presence of abnormal Ca2 + signals in branches of the LG motor nerve, ex vivo. It is noteworthy that the pattern of both EMG activity and of the Ca2 + signals recorded from Kv1.1V408A/+ preparations is remarkably similar, denoting close correlation between these events. It has been shown that the source of the Ca2 + signals associated with sciatic nerve activity includes Ca2 + entry through plasma membrane channels as well as the release of Ca2 + from intracellular stores in both axons and Schwann cells (Chiu, 2011; Chiu et al., 1999; Lev-Ram and Ellisman, 1995; Zhang et al., 2006, 2010). Based on this and our evidence, we suspect that the spontaneous electrical discharges, occurring in the motor axons from Kv1.1V408A/+ animals, activate Ca2 + influx and Na+ dependent release of Ca2 + from mitochondria at nodes of Ranvier. Furthermore, such discharges are expected to depolarize the nearby Schwann cells, inducing Ca2 + entry through plasma membrane channels as well as Ca2 + activated Ca2 + release from ryanodine-dependent stores. Regardless of the precise mechanism underlying the abnormal Ca2 + signals, resulting from V408A mutation, our findings demonstrate that the well documented Kv1.1 and Kv1.1/Kv1.2 channel dysfunction (Adelman et al., 1995; D'Adamo et al., 1998, 1999; Zerr et al., 1998) alters the Ca2 + homeostasis in LG motor nerve. The presence of Kv1.1 channels at both juxtaparanodal regions and branch points of sciatic nerves and their absence at both the end-plate and muscle fibers (Arroyo et al., 1999; Vacher et al., 2008; Zhou et al., 1998) suggest that the place of induction of hyper-excitability is the axon and its terminals. Experiments performed by using Kv1.1 knock-out mice indicate that the sources of abnormal activity are the terminals of the motor nerve. It has been proposed that the progressive reduction of inter-nodal length and the lack of juxtaparanodal Kv1.1 channels lead to re-entrant excitation of nodes solely at the segment just preceding the terminal (Zhou et al., 1998, 1999). Our direct evidence obtained by using Kv1.1V408A/+ animals and Ca2 + imaging experiments indicates that the spontaneous discharges occur also in branches of the nerve running over the muscle. It has been shown that both homomeric Kv1.1 and heteromeric channels, comprised of Kv1.1 and Kv1.2 subunits, contribute significantly to setting the resting potential of transfected cells and that EA1 mutations impair this function (D'Adamo et al., 1999). Moreover, the mutation V408A reduces markedly both the mean-open duration and the deactivation rates of both homomeric and heteromeric channels and slightly lowers surface expression (D'Adamo et al., 1999; Imbrici et al., 2011). These effects may increase the excitability of axons and branch points, where Kv1.1/Kv1.2 channels are highly clustered, by shifting their resting potentials to more depolarized values. As a consequence, discharges may occur spontaneously in axons and action potential propagation failures at branch points may be reduced. Moreover, V408A channels enter the C-type inactivated state with a faster rate than WT (D'Adamo et al., 1999). This inactivation process may further reduce the availability of Kv channels, increasing the juxtaparanodal membrane resistance. As a result, the length constant of the axon would increase, the current is able to spread further along the inner conducting core, causing repetitive discharges. Thus, in physiological conditions the internodal resting conductance provided by the normally functioning Kv1.1 channels may enable motor nerves to dampen the node-inter-node electrotonic coupling and prevent re-entrant excitation. This scenario is consistent with the suggested role of internodal K+ channels to locally generate a stable resting potential and dampen re-entrant excitation at the node–paranode junction to maintain dynamic stability (Chiu and Ritchie, 1981, 1984). In particular, Baker et al. (1987) showed that inhibition of “fast” K+ channels caused a small depolarization of the resting potential of motor fibers and increased the early electrotonic response to depolarizing currents. A recent clinical study in patients harboring EA1 mutations other than the V408A suggested that the reduction of the contribution of Kv1.1 channels to the resting conductance of the internodal axolemma may account for the alteration of the current–threshold relationship of the nerve (Tomlinson et al., 2010). It should also be mentioned that K+ ions accumulate in the tiny peri-internodal space during nerve stimulation, reaching concentrations ranging between 20 and 100 mM. These high [K+]o concentrations may further depolarize the resting membrane potential, render the nerve re-excitable and lead to after-depolarizations. Thus, action potential dependent K+ accumulation in peri-internodal space may account for the stimulus enhanced repetitive discharges elicited in Kv1.1V408A/+ mice (Fig. 1). The abnormal Ca2 + signals elicited by Kv1.1 channel dysfunction pose the question as to whether [Ca2 +]i elevations in motor nerve also contribute to trigger spontaneous electrical discharges in peripheral motor units. Nodes of Ranvier express both KCNQ2 and KCNQ3 subunits (Devaux et al., 2004; Pan et al., 2006) that form the slow-gating K+ channels, known as “M” channels. Functionally, they contribute to the resting membrane potential and prevent repetitive firing. Indeed, blockade of M-currents is associated with depolarization of the resting membrane potential and with the generation of trains of action potentials (Brown and Adams, 1980; Delmas and Brown, 2005). M-channels are also highly sensitive to intracellular Ca2 + variations, being inhibited by Ca2 + with an IC50 of ~ 100 nM in sympathetic neurons (Gamper and Shapiro, 2003; Selyanko and Brown, 1996). It is therefore possible that the abnormal [Ca2 +]i transients, which we observed from Kv1.1V408A nerves by 2P-LSM imaging, inhibit nodal M-channel activity. As a consequence, they are no longer able to prevent membrane potential fluctuations (Brown and Adams, 1980) that, combined with Kv1.1 channel dysfunction exerted by the V408A mutation, will result in repetitive discharges. This is consistent with the fact that TEA, an M-channel blocking agent, exacerbates the temperature-sensitive hyperexcitability in Kv1.1-null mice that exhibited a long lasting phase of repetitive discharges triggered by a single stimulation (Zhou et al., 1999). Furthermore, mutations of the KCNQ2 gene in humans are responsible for benign neonatal convulsions and myokymia (Dedek et al., 2001; Wuttke et al., 2007) and altered distribution of KCNQ2 subunits at sciatic nodes may initiate neuromyotonic/myokymic discharges in quivering-3J mice (Devaux, 2010).
In contrast to Kv1.1V408A/+ knock-in mice, Kcna1 ablation might lead to a number of unpredictable compensatory effects, including the formation of Kv1.2 homomultimers or the up-regulation of other K+ channels along the fiber (Wang et al., 1993). This might explain why remarkable cooling is always required to unmask the phenotype in Kv1.1-null mice (Zhou and Chiu, 2001; Zhou et al., 1998, 1999), while Kv1.1V408A/+ mice display myokymia also at 37 °C. Assuming that the formation of Kv1.2 homomultimers is the only effect caused by Kcna1 ablation, it should be recalled that Kv1.2 channels have a slightly more depolarized half-maximal activation voltage (V1/2) and reduced open probability at most potentials compared to Kv1.1/Kv1.2 heteromultimers (D'Adamo et al., 1999). As a consequence, internodal Kv1.2 homomultimers could be slightly less efficient than Kv1.1/Kv1.2 heteromultimers in setting the resting membrane potential and may determine a subtle steady-state instability of juxtaparanodal regions. By itself this subtle hyper-excitability could be unable to produce spontaneous myokymia, but, a remarkable temperature drop to ~ 20 °C would be required to trigger the after-discharges. Whereas, in Kv1.1V408A/+ mice, myokymic activity is present spontaneously and the temperature threshold that enhances myokymia is ~ 28 °C. That the Kcna1V408A/+ mutation results in a more severe phenotype than Kcna1 ablation can also be evinced by the fact that homozygous Kcna1V408A/V408A mutations are embryonically lethal (Herson et al., 2003), while Kv1.1-null are viable at birth, although 50% of them die suddenly 3–5 weeks later (Smart et al., 1998). The dysfunction of the macromolecular membrane complex composed of Kv1.1 and Kv1.2 caused by the assembling of Kv1.1V408A subunits and the lack of compensatory effects may account at least in part for the differences in phenotype severity between Kcna1V408A/+ and Kv1.1-null mice.
Super-excitability induced by muscle fatigue, ischemia and low temperature
The neurobiology of fatigue is complex, involving processes that operate from the forebrain to the contractile proteins. It is known that fatigue intensifies myokymia and body stiffness, and can also precipitate attacks of generalized ataxia in individuals affected by EA1. However, the distinct role played by CNS, PNS or muscle to fatigue-triggered EA1 symptoms is unknown. Here we found that fatiguing stimulations of LG nerve–muscle of Kv1.1V408A/+ mice, in isometric conditions, enhance both spontaneous and evoked EMG activity. Also an enhancement of the CMAP was observed from Kv1.1V408A/+ mice that is consistent with increased nerve excitability in response to electrical stimuli. In fact, the electrical stimulation (which was set at 50% of the intensity required to evoke the maximal CMAP amplitude) may be able to recruit other motor units, normally under-threshold, or vary their conduction to increase synchrony. Spontaneous and evoked activities increased a few minutes after fatigue and then decreased in parallel with fatigue recovery. The causative role of nerve hyper-activation and muscle movement in the excitability enhancement seems to be of secondary importance, since it was barely detectable after the delivery of HFS trains in “quasi isotonic” condition, whereby the nerve was hyper-activated, as in isometric condition, but, the muscle presented large displacements in response to each stimulation train and did not exhibit fatigue. Moreover, there was a direct relationship between the CMAP amplitude increase and the degree of fatigue. Therefore, muscle fatigue is crucial for triggering bursting activity and may depend on a “muscular factor” which modulates pathways also interfering with nerve excitability. The activity-induced K+ efflux, lactic acid production, pH changes, CO2 and inorganic phosphate (Pi) accumulation are some of the events mediating muscle fatigue (Fitts, 1994). The concentration of these factors changes remarkably in the interstitium during fatigue and by diffusing to nerve structures, may contribute to the phenomena observed from Kv1.1V408A/+ mice. In particular, acidifications within physiological pH ranges inhibit M-channel activity (Prole et al., 2003) and activate acid-sensitive ion channels (ASIC), which are proton gated cation channels (Waldmann et al., 1997). Furthermore, acidification-induced Na+ currents through ASIC channels are potentiated by lactate through chelation of extracellular Ca2 + ions (Immke and McCleskey, 2001). ASIC channels have been localized in the axonal plasma membrane of sciatic nerves (Alvarez de la Rosa et al., 2002). Thus, it is possible that fatigue-induced acidification, combined with lactic acid production, elicits a significant Na+ influx in sciatic nerve through ASIC channels and a simultaneous decrease of M currents both resulting in axonal depolarization. When such fatigue-dependent depolarization occurs in combination with constitutively decreased internodal K+ conductance (caused by the V408A mutation) abnormal discharges then result. By contrast, normally functioning Kv1.1 channels present at the level of the motor axon of Kv1.1+/+ animals appear to counterbalance this effect maintaining the excitability of these structures within a physiological range also during fatigue. The node of Ranvier expresses a high density of voltage-gated Na+ channels (Nav1.6) (Caldwell et al., 2000) and single Na+ channel conductance increases when the external [Ca2 +]o is reduced from 9.0 to 0.18 mM (Yamamoto et al., 1984). Indeed, the higher the [Ca2 +]o the greater is the depolarization needed to elicit a given increase of nodal Na+ conductance and vice versa (reviewed in Hille, 2001). Therefore, the lactate released during fatigue may also increase the Na+ currents through Nav1.6 channels by chelating extracellular Ca2 + ions. These events may contribute to cause more pronounced depolarizations of nodal membrane and trigger abnormal discharges in Kv1.1V408A/+ mice. Interestingly, this mechanism accounts for the motor unit hyperexcitability underlying the hypocalcemic tetany, which is also observed in humans when blood Ca2 + concentrations decrease from 9.4 mg/dl to 6 mg/dl.
As regards the super-excitability induced by ischemia, it is known that in some EA1 individuals myokymic activity becomes apparent from the EMG recording only after the application of regional ischemia (reviewed in Pessia and Hanna, 2010). We observed, from mutated animals only, that ischemia induced abnormal bursting activity characterized by random singlets, duplets and multiplets and CMAP enhancement. However, there was no difference in the effect of ischemia on muscle tension in either mutated or wild-type animals, as shown indirectly by the twitch amplitude decay, during the ischemic period and its recovery. It is noteworthy that Brunt and Van Weerden (1990) reported a recruitment of new and large multiplets, enlargement of pre-existing complexes with extra spikes following ischemia in EA1 individuals. This excess activity began 0.5–1 min after reversal of ischemia, reached a maximum at 2–5 min and gradually declined over 10–15 min. Strikingly, both the time course and the overall appearance of burst activity in Kv1.1V408A/+ mice, during ischemia and reperfusion, match that reported for affected individuals, suggesting that similar mechanisms underlie these responses in rodents and humans. During the initial ischemic insult there is a conversion of muscle metabolism from aerobic to anaerobic that provokes increased concentrations of H+, lactic acid, CO2, ATP depletion, release of K+ and of Pi. Noticeably, some of these factors are produced also during muscle fatigue. In particular, extracellular pH falls to below pH 6.5 during ischemia (von Hanwehr et al., 1986) and causes extracellular lactate to rise to about 15 mM from resting levels below 1 mM (Cohen and Woods, 1983). It is then possible that the ischemia-induced acidification and lactic acid production may exacerbate the excitability of myelinated nerves and trigger bursting activity in Kv1.1V408A/+ mice by decreasing M channel activity and increasing ASIC and Nav1.6 currents similarly to fatigue.
The action of temperature is less straightforward in EA1 patients. The exposure of the forearm to warm or cold temperatures may increase or decrease myokymic activity recorded from a hand muscle. We consistently observed that temperatures lower than 28 °C induce bursting activity in response to nerve stimulation of adult Kv1.1V408A/+ mice only. In addition, it is likely that the effect of cooling is always to enhance the evoked response, since a low temperature slightly reduced the amplitude of CMAP in Kv1.1+/+ mice, whereas it slightly enhanced the CMAP in Kv1.1V408A/+ mice. These findings demonstrate that the V408A mutation in Kv1.1 channels confers marked temperature-sensitivity to neuromuscular transmission in adult Kv1.1V408A/+ ataxia mice, similar to Kv1.1 knock-out mice (Zhou et al., 1998). A number of cellular mechanisms may explain the cold induced hyper-excitability, including the temperature-dependence of ion channel kinetics and of the AP shape. Computer simulations showed that cooling slows down K+ clearing from peri-internodal space and causes more pronounced after-depolarizations (Zhou and Chiu, 2001). These mechanisms may also contribute to temperature-enhancements of the myokymic activity from Kv1.1V408A/+ knock-in mice. Zhou et al. (1998) proposed the mechano-induced and cholinergic autoreceptor-induced activity as the two likely mechanisms involved in the temperature-sensitivity of Kv1.1 knock-out mice. Whether or not these apply to Kv1.1V408A/+ ataxia mice still remains to be investigated, although, these mechanisms appear less relevant to bring about the fatigue-induced phenotype.
Abnormal bursting activity does not alter the morphology of LG muscle of Kv1.1V408A/+ mice
Bilateral calf hypertrophy, enlargement of type I and type II gastrocnemius muscle fibers and variable glycogen depletion have been observed in some EA1 individuals (Demos et al., 2009; Kinali et al., 2004; Van Dyke et al., 1975). Since these changes have not been consistently reported among patients, a noticeable interfamilial and intrafamilial phenotypic variability can be invoked to account for these observations. The optical and electron microcopy analysis of LG muscles from Kv1.1V408A/+ mice did not reveal obvious changes in fibers types, neuromuscular junction and vascularization. This evidence suggests that anomalous bursting activity may not be sufficiently intense so as to induce muscle transformation and mechanical changes in Kv1.1V408A/+ mice, during their development through adulthood. Whether the variability in repetitive muscle activation and excitability increment observed in EA1 individuals underlies the inconsistent effect on muscle morphology remains to be explored.
Overall, this study points out that Kv1.1V408A/+ ataxia mice recapitulate some neuromuscular defects reported for EA1 individuals and represent an excellent animal model for the study of mechanisms which precipitate disabling attacks. In addition, the insertion of V408A mutation in mammals provides a unique tool for the manipulation of neuromuscular transmission, which cannot be achieved by pharmacological modulation of juxtaparanodal Kv1.1 channels and helps in the identification of the physiological workings of the PNS regulated by Shaker-like K+ channels.
Conclusion
We show that Kv1.1 channels with altered function result in hyper-excitability of the motor nerve that generates spontaneous discharges and abnormal Ca2 + signals without the influence of the CNS. Furthermore, stress events such as fatigue, ischemia and lower temperatures exacerbate this motor unit excitability. Importantly, our study sheds new light on the functional role played by axonal Kv1.1 channels that regulate motor unit excitability during muscle fatigue, or during ischemic insult, when the motor nerve could be exposed to physiological factor(s) that interfere with nerve excitability and impulse conduction.
The following are the supplementary data related to this article.
Acknowledgments
We thank Dr. James Maylie and Dr. John P. Adelman for generously sharing their Kv1.V408A/+ ataxia mice. We thank Mauro Roscini, Massimo Pierucci, Samantha Austen and Maria Teresa Laveglia for their contributions to this study. This work was supported by COMPAGNIA di San Paolo (Turin) “Programma Neuroscienze”, Telethon (GGP11188), Ministero della Salute (GR-2009-1580433) and Fondazione Cassa di Risparmio di Perugia.
References
- Adelman J.P., Bond C.T., Pessia M., Maylie J. Episodic ataxia results from voltage-dependent potassium channels with altered functions. Neuron. 1995;15:1449–1454. doi: 10.1016/0896-6273(95)90022-5. [DOI] [PubMed] [Google Scholar]
- Alvarez de la Rosa D., Zhang P., Shao D., White F., Canessa C.M. Functional implications of the localization and activity of acid-sensitive channels in rat peripheral nervous system. Proc. Natl. Acad. Sci. U.S.A. 2002;99(4):2326–2331. doi: 10.1073/pnas.042688199. [DOI] [PMC free article] [PubMed] [Google Scholar]
- Arroyo E.J., Xu Y.T., Zhou L., Messing A., Peles E., Chiu S.Y., Scherer S.S. Myelinating Schwann cells determine the internodal localization of Kv1.1, Kv1.2, Kvbeta2, and Caspr. J. Neurocytol. 1999;28:333–347. doi: 10.1023/a:1007009613484. [DOI] [PubMed] [Google Scholar]
- Baker M., Bostock H., Grafe P., Martius P. Function and distribution of three types of rectifying channel in rat spinal root myelinated axons. J. Physiol. 1987;383:45–67. doi: 10.1113/jphysiol.1987.sp016395. [DOI] [PMC free article] [PubMed] [Google Scholar]
- Brown D.A., Adams P.R. Muscarinic suppression of a novel voltage-sensitive K+ current in a vertebrate neurone. Nature. 1980;283(5748):673–676. doi: 10.1038/283673a0. [DOI] [PubMed] [Google Scholar]
- Brunt E.R.P., van Weerden T.W. Familial paroxysmal kinesigenic ataxia and continuous myokymia. Brain. 1990;113:1361–1382. doi: 10.1093/brain/113.5.1361. [DOI] [PubMed] [Google Scholar]
- Caldwell J.H., Schaller K.L., Lasher R.S., Peles E., Levinson S.R. Sodium channel Nav1.6 is localized at nodes of Ranvier, dendrites, and synapses. Proc. Natl. Acad. Sci. U.S.A. 2000;97(10):5616–5620. doi: 10.1073/pnas.090034797. [DOI] [PMC free article] [PubMed] [Google Scholar]
- Chiu S.Y. Matching mitochondria to metabolic needs at nodes of Ranvier. Neuroscientist. 2011;17:343–350. doi: 10.1177/1073858410393740. [DOI] [PubMed] [Google Scholar]
- Chiu S.Y., Ritchie J.M. Evidence for the presence of potassium channels in the paranodal region of acutely demyelinated mammalian single nerve fibres. J. Physiol. 1981;313:415–437. doi: 10.1113/jphysiol.1981.sp013674. [DOI] [PMC free article] [PubMed] [Google Scholar]
- Chiu S.Y., Ritchie J.M. On the physiological role of internodal potassium channels and the security of conduction in myelinated nerve fibres. Proc. R. Soc. Lond. B Biol. Sci. 1984;220(1221):415–422. doi: 10.1098/rspb.1984.0010. [DOI] [PubMed] [Google Scholar]
- Chiu S.Y., Zhou L., Zhang C.L., Messing A. Analysis of potassium channel functions in mammalian axons by gene knockouts. J. Neurocytol. 1999;28:349–364. doi: 10.1023/a:1007013731231. [DOI] [PubMed] [Google Scholar]
- Cohen R.D., Woods H.F. Lactic acidosis revisited. Diabetes. 1983;32(2):181–191. doi: 10.2337/diab.32.2.181. [DOI] [PubMed] [Google Scholar]
- D'Adamo M.C., Liu Z., Adelman J.P., Maylie J., Pessia M. Episodic ataxia type-1 mutations in the hKv1.1 cytoplasmic pore region alter the gating properties of the channel. EMBO J. 1998;17:1200–1207. doi: 10.1093/emboj/17.5.1200. [DOI] [PMC free article] [PubMed] [Google Scholar]
- D'Adamo M.C., Imbrici P., Sponcichetti F., Pessia M. Mutations in the KCNA1 gene associated with episodic ataxia type-1 syndrome impair heteromeric voltage-gated K+ channel function. FASEB J. 1999;13:1335–1345. doi: 10.1096/fasebj.13.11.1335. [DOI] [PubMed] [Google Scholar]
- Dedek K., Kunath B., Kananura C., Reuner U., Jentsch T.J., Steinlein O.K. Myokymia and neonatal epilepsy caused by a mutation in the voltage sensor of the KCNQ2 K+ channel. Proc. Natl. Acad. Sci. U.S.A. 2001;98(21):12272–12277. doi: 10.1073/pnas.211431298. [DOI] [PMC free article] [PubMed] [Google Scholar]
- Delmas P., Brown D.A. Pathways modulating neural KCNQ/M (Kv7) potassium channels. Nat. Rev. Neurosci. 2005;6(11):850–862. doi: 10.1038/nrn1785. [DOI] [PubMed] [Google Scholar]
- Demos M.K., Macri V., Farrell K., Nelson T.N., Chapman K., Accili E., Armstrong L. A novel KCNA1 mutation associated with global delay and persistent cerebellar dysfunction. Mov. Disord. 2009;24:778–782. doi: 10.1002/mds.22467. [DOI] [PubMed] [Google Scholar]
- Devaux J.J. The C-terminal domain of ßIV-spectrin is crucial for KCNQ2 aggregation and excitability at nodes of Ranvier. J. Physiol. 2010;588(Pt 23):4719–4730. doi: 10.1113/jphysiol.2010.196022. [DOI] [PMC free article] [PubMed] [Google Scholar]
- Devaux J.J., Kleopa K.A., Cooper E.C., Scherer S.S. KCNQ2 is a nodal K+ channel. J. Neurosci. 2004;24(5):1236–1244. doi: 10.1523/JNEUROSCI.4512-03.2004. [DOI] [PMC free article] [PubMed] [Google Scholar]
- Eunson L.H., Rea R., Zuberi S.M., Youroukos S., Panayiotopoulos C.P., Liguori R., Avoni P., McWilliam R.C., Stephenson J.B., Hanna M.G., Kullmann D.M., Spauschus A. Clinical, genetic, and expression studies of mutations in the potassium channel gene KCNA1 reveal new phenotypic variability. Ann. Neurol. 2000;48:647–656. [PubMed] [Google Scholar]
- Fitts R.H. Cellular mechanisms of muscle fatigue. Physiol. Rev. 1994;74(1):49–94. doi: 10.1152/physrev.1994.74.1.49. [DOI] [PubMed] [Google Scholar]
- Gamper N., Shapiro M.S. Calmodulin mediates Ca2 +-dependent modulation of M-type K+ channels. J. Gen. Physiol. 2003;122(1):17–31. doi: 10.1085/jgp.200208783. [DOI] [PMC free article] [PubMed] [Google Scholar]
- Herson P.S., Virk M., Rustay N.R., Bond C.T., Crabbe J.C., Adelman J.P., Maylie J. A mouse model of episodic ataxia type-1. Nat. Neurosci. 2003;6:378–383. doi: 10.1038/nn1025. [DOI] [PubMed] [Google Scholar]
- Hille B. 3rd edition. Sinauer Associates Inc.; 2001. Ion Channels of Excitable Membranes. [Google Scholar]
- Imbrici P., D'Adamo M.C., Grottesi A., Biscarini A., Pessia M. Episodic ataxia type 1 mutations affect fast inactivation of K+ channels by a reduction in either subunit surface expression or affinity for inactivation domain. Am. J. Physiol. Cell Physiol. 2011;300(6):C1314–C1322. doi: 10.1152/ajpcell.00456.2010. [DOI] [PubMed] [Google Scholar]
- Immke D.C., McCleskey E.W. Lactate enhances the acid-sensing Na+ channel on ischemia-sensing neurons. Nat. Neurosci. 2001;4(9):869–870. doi: 10.1038/nn0901-869. [DOI] [PubMed] [Google Scholar]
- Kinali M., Jungbluth H., Eunson L.H., Sewry C.A., Manzur A.Y., Mercuri E., Hanna M.G., Muntoni F. Expanding the phenotype of potassium channelopathy: severe neuromyotonia and skeletal deformities without prominent episodic ataxia. Neuromuscul. Disord. 2004;14:689–693. doi: 10.1016/j.nmd.2004.06.007. [DOI] [PubMed] [Google Scholar]
- Kullmann D.M. Neurological channelopathies. Annu. Rev. Neurosci. 2010;33:151–172. doi: 10.1146/annurev-neuro-060909-153122. [DOI] [PubMed] [Google Scholar]
- Lev-Ram V., Ellisman M.H. Axonal activation-induced calcium transients in myelinating Schwann cells, sources, and mechanisms. J. Neurosci. 1995;4:2628–2637. doi: 10.1523/JNEUROSCI.15-04-02628.1995. [DOI] [PMC free article] [PubMed] [Google Scholar]
- MacLean J.N., Yuste R. A practical guide: imaging action potentials with calcium indicators. In: Yuste R., Konnerth A., editors. Imaging in Neuroscience and Development. Cold Spring Harbor Laboratory Press; New York: 2005. pp. 351–355. [Google Scholar]
- Pan Z., Kao T., Horvath Z., Lemos J., Sul J.Y., Cranstoun S.D., Bennett V., Scherer S.S., Cooper E.C. A common ankyrin-G-based mechanism retains KCNQ and Nav channels at electrically active domains of the axon. J. Neurosci. 2006;26(10):2599–2613. doi: 10.1523/JNEUROSCI.4314-05.2006. [DOI] [PMC free article] [PubMed] [Google Scholar]
- Pessia M., Hanna M. Episodic Ataxia Type 1. In: Pagon R.A., Bird T.C., Dolan C.R., Stephens K., editors. Gene Reviews University of Washington; Seattle: 2010. [Google Scholar]
- Poliak S., Gollan L., Martinez R., Custer A., Einheber S., Salzer J.L., Trimmer J.S., Shrager P., Peles E. Caspr2, a new member of the neurexin superfamily, is localized at the juxtaparanodes of myelinated axons and associates with K+ channels. Neuron. 1999;24:1037–1047. doi: 10.1016/s0896-6273(00)81049-1. [DOI] [PubMed] [Google Scholar]
- Prole D.L., Lima P.A., Marrion N.V. Mechanisms underlying modulation of neuronal KCNQ2/KCNQ3 potassium channels by extracellular protons. J. Gen. Physiol. 2003;122(6):775–793. doi: 10.1085/jgp.200308897. [DOI] [PMC free article] [PubMed] [Google Scholar]
- Rajakulendran S., Schorge S., Kullmann D.M., Hanna M.G. Episodic ataxia type 1: a neuronal potassium channelopathy. Neurotherapeutics. 2007;2:258–266. doi: 10.1016/j.nurt.2007.01.010. [DOI] [PubMed] [Google Scholar]
- Ren Y., Ridsdale A., Coderre E., Stys P.K. Calcium imaging in live rat optic nerve myelinated axons in vitro using confocal laser microscopy. J. Neurosci. Methods. 2000;102:165–176. doi: 10.1016/s0165-0270(00)00304-6. [DOI] [PubMed] [Google Scholar]
- Selyanko A.A., Brown D.A. Intracellular calcium directly inhibits potassium M channels in excised membrane patches from rat sympathetic neurons. Neuron. 1996;16(1):151–162. doi: 10.1016/s0896-6273(00)80032-x. [DOI] [PubMed] [Google Scholar]
- Smart S.L., Lopantsev V., Zhang C.L., Robbins C.A., Wang H., Chiu S.Y., Schwartzkroin P.A., Messing A., Tempel B.L. Deletion of the Kv1.1 potassium channel causes epilepsy in mice. Neuron. 1998;20(4):809–819. doi: 10.1016/s0896-6273(00)81018-1. [DOI] [PubMed] [Google Scholar]
- Tomlinson S.E., Tan S.V., Kullmann D.M., Griggs R.C., Burke D., Hanna M.G., Bostock H. Nerve excitability studies characterize Kv1.1 fast potassium channel dysfunction in patients with episodic ataxia type 1. Brain. 2010;133(Pt 12):3530–3540. doi: 10.1093/brain/awq318. [DOI] [PMC free article] [PubMed] [Google Scholar]
- Tsaur M.L., Sheng M., Lowenstein D.H., Jan Y.N., Jan L.Y. Differential expression of K+ channel mRNAs in the rat brain and down-regulation in the hippocampus following seizures. Neuron. 1992;8:1055–1067. doi: 10.1016/0896-6273(92)90127-y. [DOI] [PubMed] [Google Scholar]
- Vacher H., Mohapatra D.P., Trimmer J.S. Localization and targeting of voltage-dependent ion channels in mammalian central neurons. Physiol. Rev. 2008;88:1407–1447. doi: 10.1152/physrev.00002.2008. [DOI] [PMC free article] [PubMed] [Google Scholar]
- Van Dyke D.H., Griggs R.C., Murphy M.J., Goldstein M.N. Hereditary myokymia and periodic ataxia. J. Neurol. Sci. 1975;25:109–118. doi: 10.1016/0022-510x(75)90191-4. [DOI] [PubMed] [Google Scholar]
- von Hanwehr R., Smith M.L., Siesjö B.K. Extra- and intracellular pH during near complete forebrain ischemia in the rat. J. Neurochem. 1986;46(2):331–339. doi: 10.1111/j.1471-4159.1986.tb12973.x. [DOI] [PubMed] [Google Scholar]
- Waldmann R., Champigny G., Bassilana F., Heurteaux C., Lazdunski M. A proton-gated cation channel involved in acid-sensing. Nature. 1997;386(6621):173–177. doi: 10.1038/386173a0. [DOI] [PubMed] [Google Scholar]
- Wang H., Kunkel D.D., Martin T.M., Schwartzkroin P.A., Tempel B.L. Heteromultimeric K+ channels in terminal and juxtaparanodal regions of neurons. Nature. 1993;365:75–79. doi: 10.1038/365075a0. [DOI] [PubMed] [Google Scholar]
- Wang H., Kunkel D.D., Schwartzkroin P.A., Tempel B.L. Localization of Kv1.1 and Kv1.2, two K+ channel proteins, to synaptic terminals, somata, and dendrites in the mouse brain. J. Neurosci. 1994;14:4588–4599. doi: 10.1523/JNEUROSCI.14-08-04588.1994. [DOI] [PMC free article] [PubMed] [Google Scholar]
- Wuttke T.V., Jurkat-Rott K., Paulus W., Garncarek M., Lehmann-Horn F., Lerche H. Peripheral nerve hyperexcitability due to dominant-negative KCNQ2 mutations. Neurology. 2007;69(22):2045–2053. doi: 10.1212/01.wnl.0000275523.95103.36. [DOI] [PubMed] [Google Scholar]
- Yamamoto D., Yeh J.Z., Narahashi T. Voltage-dependent calcium block of normal and tetramethrin-modified single sodium channels. Biophys. J. 1984;45(1):337–344. doi: 10.1016/S0006-3495(84)84159-4. [DOI] [PMC free article] [PubMed] [Google Scholar]
- Zanotti S., Negri T., Cappelletti C., Bernasconi P., Canioni E., Di Blasi C., Pegoraro E., Angelini C., Ciscato P., Prelle A., Mantegazza R., Morandi L., Mora M. Decorin and biglycan expression is differentially altered in several muscular dystrophies. Brain. 2005;128:2546–2555. doi: 10.1093/brain/awh635. [DOI] [PubMed] [Google Scholar]
- Zerr P., Adelman J.P., Maylie J. Episodic ataxia mutations in Kv1.1 alter potassium channel function by dominant negative effects or haploinsufficiency. J. Neurosci. 1998;18:2842–2848. doi: 10.1523/JNEUROSCI.18-08-02842.1998. [DOI] [PMC free article] [PubMed] [Google Scholar]
- Zhang C.L., Wilson J.A., Williams J., Chiu S.Y. Action potentials induce uniform calcium influx in mammalian myelinated optic nerves. J. Neurophysiol. 2006;6:695–709. doi: 10.1152/jn.00083.2006. [DOI] [PubMed] [Google Scholar]
- Zhang C.L., Ho P.L., Kintner D.B., Sun D., Chiu S.Y. Activity-dependent regulation of mitochondrial motility by calcium and Na/K-ATPase at nodes of ranvier of myelinated nerves J. Neurosci. 2010;30(10):3555–3566. doi: 10.1523/JNEUROSCI.4551-09.2010. [DOI] [PMC free article] [PubMed] [Google Scholar]
- Zhou L., Chiu S.Y. Computer model for action potential propagation through branch point in myelinated nerves. J. Neurophysiol. 2001;85:197–210. doi: 10.1152/jn.2001.85.1.197. [DOI] [PubMed] [Google Scholar]
- Zhou L., Zhang C.L., Messing A., Chiu S.Y. Temperature-sensitive neuromuscular transmission in Kv1.1 null mice: role of potassium channels under the myelin sheath in young nerves. J. Neurosci. 1998;18:7200–7215. doi: 10.1523/JNEUROSCI.18-18-07200.1998. [DOI] [PMC free article] [PubMed] [Google Scholar]
- Zhou L., Messing A., Chiu S.Y. Determinants of excitability at transition zones in Kv1.1-deficient myelinated nerves. J. Neurosci. 1999;19:5768–5781. doi: 10.1523/JNEUROSCI.19-14-05768.1999. [DOI] [PMC free article] [PubMed] [Google Scholar]