

Abstract
Dendritic cells (DC) play a pivotal role in tolerance. Adrenomedullin (AM), a neuropeptide with anti-apoptotic and anti-inflammatory effects, may decrease T helper type 1 effector cells and induce regulatory T (Treg) cells. The aim of this study was to evaluate AM effects on murine dendritic cell (DC) maturation and functions. Bone marrow-derived DC were produced and stimulated with CpG motifs, lipopolysaccharide or AM for 24 hr. Then, DC maturation and expression of AM and AM receptors were evaluated. Compared with lipopolysaccharide-stimulated or CpG-stimulated DC, AM-stimulated DC had lower levels of co-stimulatory molecule expression and pro-inflammatory cytokine release. The AM induced high levels of interferon-γ but not of interleukin-10. Importantly, AM inhibited lipopolysaccharide-induced maturation of DC. However, allogeneic T-cell stimulation and endocytic capacity of AM-stimulated DC were comparable to those of semi-mature and mature DC. Moreover, DC expressed AM and its receptors at a basal level, and AM receptor expression increased with DC maturation. The AM stimulation induced indoleamine 2,3-dioxygenase (IDO) expression, promoting Treg cell expansion. For the first time, we describe the DC maturation phenotype by a neuropeptide (AM). We have demonstrated that AM and its receptors are expressed in DC and that exogenous AM can modify the DC phenotype and functions and can induce a semi-mature DC phenotype with IDO expression. These results indicate close interactions among immune system regulation mechanisms and calcitonin-like peptides.
Keywords: dendritic cells, adrenomedullin, regulatory T cells
Introduction
Dendritic cells (DC) are professional antigen-presenting cells that prime naive T cells though peptide–MHC heterodimers and represent a critical link in both the initiation and the regulation of innate and adaptive immune responses.1 Although immature DC are efficient at antigen capture and processing, mature DC lose antigen-processing capabilities and become potent stimulators of T-cell responses.2 Published data on tolerogenic and immunogenic DC phenotypes are conflicting. Immature DC were long believed to exert regulatory effects, because their low level of co-stimulatory molecule expression was thought to generate an anergic T-cell profile after cell–cell contact.3 Furthermore, semi-mature tumour necrosis factor-α (TNF-α) -stimulated DC4 and mature lipopolysaccharide (LPS) -stimulated DC5,6 have been reported to induce tolerance. These phenotypes play a role in tolerance and regulation mechanisms. Improved knowledge of the ligands capable of affecting those mechanisms is critical to the understanding of host–environment interactions in autoimmune diseases. For example, pathogens are known to promote DC maturation; we previously demonstrated that this effect can promote the expansion of natural regulatory T (nTreg) cells.6 Multiple DC phenotypes may be involved in tolerance.
Pathogen-associated molecular patterns modulate DC and their involvement in alloreactivity or tolerance. But recent data indicate that DC can be modulated by other sorts of molecules such as binding immunoglobulin protein (a member of the heat-shock protein superfamily) and vasointestinal peptide (a neuropeptide involved in inflammatory responses)7 or vitamin D.8
Adrenomedullin (AM) is a protein ubiquitously distributed in all biological fluid (blood, urine, plasma, cerebrospinal liquid) and in many tissues (brain, cardiovascular system, heart, lung, kidney, intestine and vessels).9 Like indoleamine 2,3 dioxygenase (IDO), AM expression is up-regulated during infection and inflammation and can be induced by various stimuli, such as cytokines [TNF-α, interleukin-1a (IL-1a)] and physical factors (stress, hypoxia). The AM binds to the calcitonin receptor-like receptor (CLR), a seven transmembrane domain associated with receptor activity-modifying protein 2 (RAMP-2) or RAMP-3.10,11 Adrenomedullin was originally described as a potent vasodilator12 then shown to exert numerous regulatory functions involving the apoptosis,13,14 migration,15 proliferation15 and differentiation9 of various cell types. Moreover, in vitro and in vivo studies have established that AM exerts anti-inflammatory effects. It down-regulates TNF-α expression in macrophages16 and exerts a protective effect in experimental colitis.17 It also exerts beneficial effects in rheumatoid arthritis models.18,19 Gonzalez-Rey et al.20 demonstrated that intraperitoneal AM administration correlated with a reduction in disease severity, together with a T helper type 1 (Th1) to Th2 switch and Treg cell induction. The truncated peptide (22-52)AM, which is derived from AM, has also proved its efficacy as a potent anti-inflammatory and bone-protective agent in an arthritis model.
Dendritic cells play a critical role in immune homeostasis, and cross-talk between DC and T cells is crucial to polarize the T-cell response toward the pro-inflammatory Th1, Th17 or anti-inflammatory Th2 profile. The molecules that drive DC to promote a pro-inflammatory or anti-inflammatory profile are not yet fully defined. Adrenomedullin has immunomodulatory properties and is expressed by immune cells such as macrophages21 and T cells,22 but no data are available about whether myeloid cells express AM and its receptor CLR/ RAMP or whether exogenous AM can influence DC functions and phenotype.
Therefore, we designed this study to evaluate the effect of AM on murine DC maturation and functions in vitro using bone-marrow-derived DC (BMDC), which is the widely used model to obtain large numbers of DC in vitro.23 For the first time, we demonstrated that AM was expressed and secreted by DC and that LPS-induced DC maturation enhanced AM expression. The AM-stimulated DC were characterized by weak surface expression of DC co-stimulatory molecules, reduced capture abilities, and potent stimulation of allogeneic T cells, compared with control DC. This stimulatory effect seemed specific to the AM receptors CLR and RAMP. Moreover, (22-52)AM, a derived peptide missing the intramolecular loop and devoid of vasodilator and angiogenic properties, had an agonist effect on AM receptors.
In summary, this study reports previously undescribed effects of AM on DC functions and suggests that AM may contribute to generate tolerogenic DC.
Material and methods
Mice
All experiments were performed on male DBA/1 (H-2q) mice obtained from Janvier Breeding Laboratories (Le Genest St Isle, France). All mice were bred and maintained in a dedicated pathogen-free animal facility. The mice were used at 5–7 weeks of age after acclimation according to National Animal Care guidelines (Agreement A-93-008-01). All experiments were approved by the local Animal Care and Use Committee.
BMDC generation and culture
The BMDC were generated from DBA/1 bone marrow precursors using an established procedure.24 This procedure allows the production of a homogeneous myeloid DC population with > 95% CD11b+ CD11c+ DC after 6 days of culture.
Briefly, mouse femurs were dissected out, sterilized with 70% ethanol, and washed in sterile PBS and PBS/4% fetal calf serum (FCS; PAN, Dutcher, Illkirch, France) successively, to remove soft tissues; both ends of the femurs were cut off and the bone marrow cells were flushed out with PBS/4% FCS then cultured at 2 × 10⁶/ml in 100-mm Petri dishes for 6 days in RPMI-1640 (Invitrogen, Carlsbad, CA) supplemented with 10% heat-inactivated FCS, penicillin/streptomycin (100 μg/ml), 5% sodium pyruvate and β-mercaptoethanol (50 μm, Prolabo, Fontenay-sous-bois, France) and enriched with 20 ng/ml recombinant mouse granulocyte–macrophage colony-stimulating factor (GM-CSF, R&D Systems, Minneapolis, MN). After 3 days of culture, cells were added with 10 ml complete RPMI-1640 and 20 ng/ml recombinant GM-CSF.
For maturation, 6-day-old cultures were stimulated for 24 hr with 10 μg/ml LPS-free DNA plasmid (pcDNA3.1neo plasmid; Invitrogen), 1 μg/ml LPS (Sigma Ref Escherichia coli O26:86 L-2654 Sio; Saint-Quentin Fallavier, France), 10−7 m AM (Biochem, Puteaux, France) or 10−6 m (22-52)AM (Biochem), alone or in combination, and incubated at 37°. In some experiments, DC were pre-treated several hours before treatment with LPS.
Phenotype analysis
The DC phenotype after maturation was determined using flow cytometry. Cells (1 × 10⁵) were incubated in the dark for 30 min on ice with specific antibodies for MHC class II molecules (2G9), CD11c (HL3), CD11b (M1/70), CD80 (1G10/B7), CD86 (GL1), or CD40 (3/23) or with isotype control antibodies coupled with fluorochromes (allophycocyanin, phycoerythrin, peridinin chlorophyll protein-Cy5.5). All antibodies were purchased from BD Pharmingen (San Jose, CA).
RNA extraction and real-time quantitative PCR
Total RNA was extracted from non-stimulated or stimulated (as indicated above) BMDC, using the guanidium thiocyanate–phenol–chloroform method TriReagent (Nalgene MRC, Molecular Research Center, Inc, Cincinnati, OH).
Total RNAs were primed with oligo-dT for first-strand cDNA synthesis (SuperScript TM III Reverse Transcriptase Kit, Invitrogen).
A real-time quantitative PCR (qPCR) was used to quantify cDNA for IDO, interferon-γ (IFN-γ), IL-10, TNF-α and actin. Real-time qPCR was performed using Light Cycler FastStart DNA Master SYBR Green I (Roche Diagnostics, Basel, Switzerland). All reactions were performed using a SYBR green PCR mix (Light Cycler FastStart DNA Master Plus SYBER Green I kit; Roche Diagnostics) with denaturation at 95° for 15 seconds, annealing at 60° for 15 seconds, and extension at 72° for 15 seconds. The following primer sequences were used: IDO forward, 5′- GTCGGAAGAGCCCTCAAAT-3′ and IDO reverse, 5′- GGTGTTTTCTGTGCCCTGAT-3′; actin forward, 5′-AGAGGGAAATCGTGCGTGAC-3′ and actin reverse 5′- CAATAGTGATGACCTGGCCGT-3′; TNF-α forward, 5′-CATCTTCTCAAAATTCGAGTG ACAA-3′ and TNF-α reverse, 5′-TGGGAGTAGACAAGGTACAACCC-3′; IFN-γ forward, 5′-TCAAGTGGCATAGATGTGGAAGAA-3′ and IFN-γ reverse, 5′-TGGCTCTGCAGGATTTTCATG-3′; IL-10 forward, 5′-GGTTGCCAAGCCTTATCGGA-3′ and IL-10 reverse 5′- ACCTGCTCCACTGCCTTGCT-3′; 18S RNA forward, 5′-CGGCTACCACATCCAAGGAA-3′ and 18S RNA reverse 5′-GCTGGAATTACCGCGGCT-3′; CLR forward, 5′- GCCAATAACCAGGCCTTAGTG-3′ and CLR reverse 5′-GCCCATCAGGTAGAGATGGA-3′; AM forward, 5′-TTCGCAGTTCCGAAAGAAGT-3′ and AM reverse 5′- GGTAGCTGCTGGATGCTTGT-3′; RAMP-3 forward, 5′-CCGGATGAAGTACTCATCCCA-3′ and RAMP-3reverse 5′- CCACCAGGCCAGCCATAG-3′; and RAMP-1 forward, 5′- TTTCATTGCGCTCCCCATT-3′ and RAMP-1reverse 5′- CCAGACCACCAGTGCAGTCAT-3′.
Standards were obtained by amplification of a control sample by PCR using the same primers, reagents and conditions as were optimized for real-time analysis.
Results are reported as ratios of target gene mRNA over β-actin mRNA or 18S mRNA. The PCR cycles were as follows.
PCR actin: 95° (10 seconds), 63° (5 seconds), 72° (8 seconds), 40 cycles.
PCR IDO: 95° (10 seconds), 64° (10 seconds), 72° (10 seconds), 40 cycles.
PCR TNF-α: 95° (10 seconds), 62° (12 seconds), 72° (8 seconds), 45 cycles.
PCR IFN-γ: 95° (10 seconds), 62° (5 seconds), 72° (8 seconds), 45 cycles.
PCR IL-10: 95° (10 seconds), 62° (5 seconds), 72° (8 seconds), 40 cycles.
Adrenomedullin and its receptors were assayed using real-time qPCR with 200 ng of cDNA on a lightcycler 480 apparatus with System 1.5 software (Roche, Basel, Switzerland) using Absolute Blue QPCR SYBR Green (2×; Abgene Thermoelectron, Illkirch, France) according to the manufacturer’s instructions. Primers were obtained from Eurogentec (Angers, France). Contamination controls contained water instead of DNA. After enzyme activation (15 min, 95°), thermocycling consisted of 45 cycles of 15 seconds at 95°, 30 seconds at 58°, and 30 seconds at 72°.
Cytokine detection by ELISA
The TNF-α, IFN-γ and IL-10 were measured by ELISA according to the manufacturer’s instructions (R&D Systems) after screening with Luminex (Millipore, Billerica, MA). Briefly, 96-well microplates were coated with capture antibodies diluted in PBS and incubated overnight at room temperature. After a blocking step and washing, 50 μl of sample or standard was added to each well and incubated for 2 hr at room temperature. Then, 50 μl of biotinylated antibodies were added and incubated for 2 hr at room temperature; the plates were washed, incubated for 20 min with streptavidin–horseradish peroxidase, and revealed by 3,3′,5,5′-tetramethylbenzidine. The reaction was stopped by adding 2NH2SO4 and optical density was read at 450 nm.
l-Kynurenine assay
l-Kynurenine was measured in BMDC culture supernatants using the modified spectrophotometric assay described by Takikawa et al.25 Samples (100 μl) were mixed with 30% trichloroacetic acid (50 μl), vortexed and centrifuged at 2500 g for 10 min to precipitate the proteins. Then, 75 μl supernatant was transferred into the same volume of Ehrlich’s reagent (obtained by dissolving 100 mg 5-[dimethylamino]benzaldehyde (Sigma, St Louis, MO) in 5 ml glacial acetic acid (Sigma) in a 96-well microtitre plate. Samples were then analysed at an absorbance reading of 490 nm using a model-680 microplate reader to quantify l-kynurenine levels. The unknown concentrations were determined using a standard l-kynurenine curve (range, 0 to 100 μm).
Endocytosis assay
Cells from BMDC cultures were incubated with 50 μg/ml BSA-FITC (66 000 molecular weight; Sigma) at 37°. The percentage of positive cells was determined using flow cytometry. The background fluorescence obtained after cell labelling at 4° was subtracted from the fluorescence signal obtained at 37°. To indicate the relative differences in fluorescence intensity, we reported the data as either the fluorescence percentage or the geometric mean fluorescence intensity (MFI).
Allogeneic and syngeneic T-cell stimulation by DC
For co-culture experiments, total CD4+ or CD4+ CD25− T cells were isolated from naive DBA or BALB/c mice using a T-cell isolation kit (MACS™, Millipore) from a single spleen-cell suspension according to the manufacturer’s instructions. Red blood cells were lysed before leucocyte isolation.
The BMDC collected after 24 hr of culturing under different conditions were washed to remove cytokines then co-cultured with 10 × 104 freshly purified allogeneic effector CD4+ CD25− for proliferation assays, or with syngeneic total CD4+ T cells (CD25-positive or CD25-negative) with 5 μg/ml anti-CD3 (clone 2C11) in round-bottomed 96-well culture plates for 72 hr. Cultures were performed in triplicate at three DC : T-cell ratios (1 : 5, 1 : 10 and 1 : 20). After 72 hr, the triplicate cultures were analysed using flow cytometry. For positive proliferation control, anti-CD28 antibody (2 μg/ml) was added to the cultures without BMDC.
In syngeneic cultures, to evaluate the percentage of CD4+ CD25+ Foxp3+ cells before and after co-culturing, we used flow cytometry to count CD4+, CD25+ or Foxp3+ cells in each culture. The following antibodies were used: anti-CD4-Peridinin chlorophyll protein-Cy5.5 (Becton Dickinson, Franklin Lakes, NJ), Foxp3-allophycocyanin (eBiosciences, San Diego, CA), CD25-FITC (Becton Dickinson.
CFSE-labelling
CD4+ CD25− cells were labelled with the fluorescent cell staining dye carboxyfluorescein succinimidyl ester (CFSE), 5 μm, before co-culturing with BMDC. T-cell proliferation was evaluated by measuring the CFSE dilution using flow cytometry (Cell Trace® CFSE Cell Proliferation Kit; Molecular Probes, Invitrogen).
Determination of intracellular expression of IDO
The DC were first stained with allophycocyanin-coupled CD11c monoclonal antibody and then permeabilized and fixed by Cytofix/cytoperm (Pharmingen, BD) as recommended by the manufacturer. Cells were further stained with phycoerythrin-conjugated rat anti-IDO monoclonal antibody (clone mIDO-48; Biolegend, San Diego, CA). Analysis of IDO expression by cells was performed with a FACS Canto cytometer (Becton-Dickinson). Rat IgG2b was used as isotype antibody control.
Statistical analysis
Results represent at least three independent experiments unless otherwise stated. Differences between means were compared using the unpaired t-test for small groups. Differences were considered significant for P < 0·05. Specificity for each experiment is mentioned when appropriate.
Results
Adrenomedullin-treated DC semi-mature phenotype
Non-stimulated DC were characterized by weak surface expression of MHC II, CD80, CD86 and CD40 (Fig. 1a,b) consistent with an immature phenotype. We compared the effects of DNA plasmid, LPS, AM and (22-52)AM on murine DC activation. Both plasmid DNA and LPS up-regulated the co-stimulatory molecules on the DC surface compared with medium alone. Importantly, plasmid DNA-stimulated DC had a lower level of co-stimulatory molecule expression than LPS-stimulated DC, indicating a semi-mature state, as previously described.6 Adrenomedullin-stimulated DC (AM-DC) showed a significant increase in CD86 expression and a small decrease in CD40 expression, with no changes in MHC II or CD80 expression (Fig. 1a,b percentage and MFI, respectively). Interestingly, when DC were treated with AM before LPS stimulation, AM suppressed LPS-induced maturation with a significant decrease in the expression of DC maturation markers, especially when AM was applied 6 or 12 hr before LPS treatment (Fig. 2). However, AM had no effect on Toll-like receptor (TLR) action when it was applied with bacterial ligands, because combined LPS/AM stimulation induced similar levels of marker expression to those induced by plasmid DNA or LPS alone (Fig. 1a). The truncated peptide derived from AM, (22-52)AM, known to exert agonist or antagonist actions depending on the cell type, had no effect on DC surface phenotype.
Figure 1.
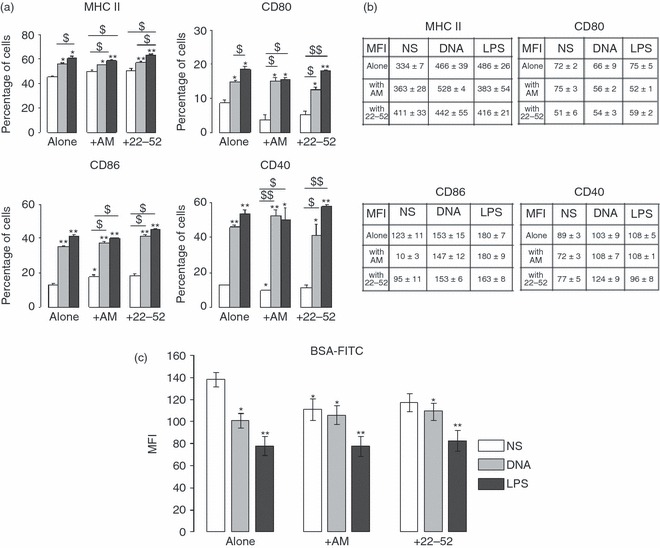
Surface phenotype and endocytosis assay of adrenomedullin-stimulated dendritic cells (AM-DC). Bone marrow-derived DC (BMDC) were stimulated for 24 hr with bacterial agents [DNA or lipopolysaccharide (LPS)] or peptides [AM or (22-52)AM]. CD11b+ CD11c+ BMDC were collected and analysed by FACS for expression of MHC II and co-stimulatory molecules (CD40, CD80, CD86). Immature (non-stimulated, NS), DNA-stimulated, or LPS-stimulated DC were used as controls. Data are representative of three experiments, each performed in triplicate. The percentage of positive cells (a) for each marker and mean fluorescence intensity (MFI) values (b) are presented. Significant differences were identical between percentage and MFI for all markers except for CD80; in this case, MFI values display no significant differences. (c) MFI values for endocytically active DC. The DC (6 × 10⁵), differentially treated as mentioned, were incubated with 50 μg/ml FITC-conjugated BSA (64 000 molecular weight) at 30° or 4° (control) for 30 min. The data are the means (± SEM) of two experiments, each performed in triplicate. Unpaired t-test. *P<0·05, **P < 0·005 compared with non-stimulated cells; $P < 0·05, $$P < 0·0005 when indicated.
Figure 2.
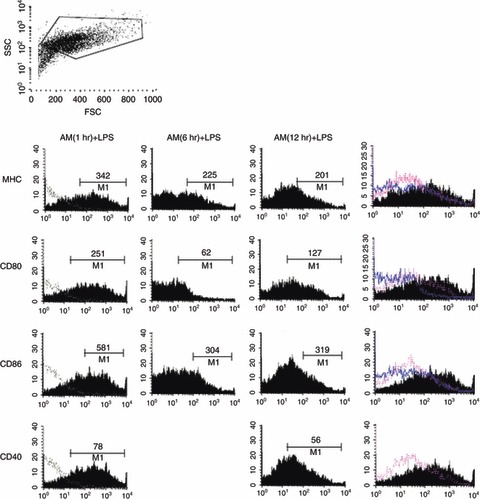
Surface phenotype of dendritic cells (DC) pre-treated with adrenomedullin (AM). Bone-marrow-derived DC (BMDC) were pre-incubated with AM (10−7 m) during 1, 6 or 12 hr before treatment with lipopolysaccharide (LPS; 1 μg/ml) for 24 hr and analysed by FACS for expression of maturation marker in CD11c+ CD11b+ cells as previously described in Fig. 1. Mean fluorescence intensity (MFI) values for each marker were presented. A representative experiment among three independent experiments.
To investigate potential effects of AM on DC endocytic capacity, we used flow cytometry to measure albumin uptake by DC. Non-stimulated DC had significantly the highest uptakes, reflecting their immature state (Fig. 1c). The DC exposed to plasmid DNA or LPS had lower uptakes, indicating a process of maturation, as published previously.6 Albumin uptake by DC exposed to AM for 24 hr was diminished compared with that seen with non-stimulated control DC and similar to that seen with plasmid DNA-exposed semi-mature DC (plasmid DNA, 101 ± 6 versus AM 111 ± 9, in arbitrary units).
However, combining AM stimulation with TLR agonists did not further decrease the albumin uptake. Adrenomedullin alone modified the endocytic capacity of DC, but the combination of AM and TLR ligands did not (Fig. 1c). When AM was applied at the same time as the microbial agent, no synergistic effect occurred between TLR ligands and AM. Taken together, these data suggest that exogenous AM may confer a semi-mature DC phenotype with weak expression of co-stimulatory surface molecules but a decrease in endocytic capacity.
Cytokine production by AM-DC
We next compared the cytokine secretion profile of AM-DC with that induced by other molecules [TLR ligands and (22-52)AM]. The levels of 15 cytokines and chemokines implicated in inflammation and autoimmunity were measured in DC culture supernatants using multiplex ELISA (data not shown). The LPS stimulation induced high levels of pro-inflammatory cytokines such as p40IL-12, IL-6 and TNF-α, as well as IL-10. These results prompted us to further investigate the elevated cytokines TNF-α, IL-10 and IFN-γ using ELISA and PCR (Fig. 3a,b). Surprisingly, AM-DC released very low levels of TNF-α (178 ± 68 pg/ml with AM versus 784 ± 149 pg/ml and 990 ± 162 pg/ml with plasmid DNA and LPS, respectively) but high levels of IFN-γ (148 ± 139 pg/ml), the most potent IDO inducer among cytokines (Fig. 3b). Indeed, compared with non-stimulated DC, AM-DC showed a nearly nine-fold increase in IFN-γ transcription (Fig. 3a).
Figure 3.
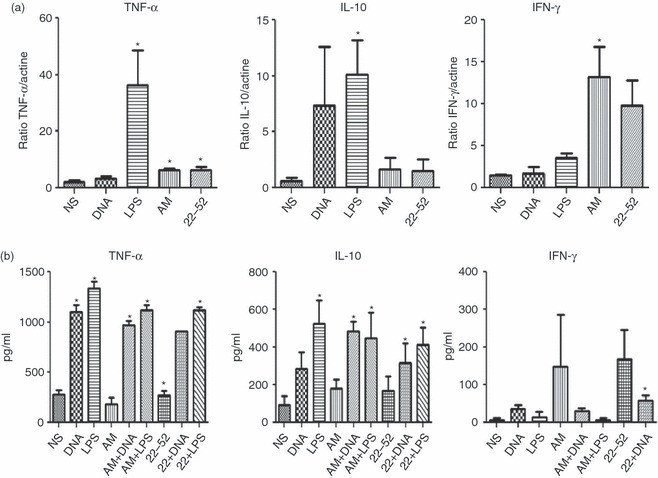
Expression of cytokines by adrenomedullin (AM) -stimulated dendritic cells (DC). Cytokines [tumour necrosis factor-α (TNF-α), interleukin-10 (IL-10), interferon-γ (IFN-γ)] were detected using PCR (a) and ELISA in culture supernatants (b) of bone-marrow-derived BMDC differentiated for 6 days in the presence of murine recombinant granulocyte–macrophage colony-stimulating factor (GM-CSF; 20 ng/ml) and stimulated on day 7 as previously described. Graphs show the means ± SEM of three independent experiments. Unpaired t test. *P < 0·05 compared with non-stimulated cells (NS). LPS, lipopolysaccharide.
In contrast to the marked IL-10 release observed in response to LPS, IL-10 release remained at the basal level after stimulation with exogenous AM. Hence AM-DC secreted low levels of TNF-α and IL-10 but high levels of IFN-γ.
AM stimulation of DC is mediated by adrenomedullin receptors
We next evaluated whether the observed phenotype modifications were linked to AM and AM-receptor expression. AM expression was measured using qPCR and AM release was measured using an ELISA. Expression of mRNA for CLR, the main AM receptor, which is associated with the adaptive protein RAMPs, and RAMPs was assayed using qPCR. The LPS induced AM mRNA expression but not AM detection in DC (Fig. 4a,b). Both AM and (22-52)AM significantly increased AM release in DC supernatants (Fig. 4b). The DC produced CLR mRNA, as well as mRNA for RAMP, the adaptive protein required for CLR function. Importantly, LPS induced high levels of CLR and RAMP-2 mRNA expression (Fig. 4c). However, for 22-52(AM)-treated DC, RAMP-1 expression showed no differences across stimulation conditions, and RAMP-3 expression was not detected in non-stimulated or stimulated DC. The AM had no effect on AM receptor expression. In contrast, (22-52)AM enhanced CLR and RAMP-2 expression (Fig. 4c). These data show that DC maturation was associated with enhanced AM release and AM-receptor expression in DC. This supports the hypothesis of a paracrine loop.
Figure 4.
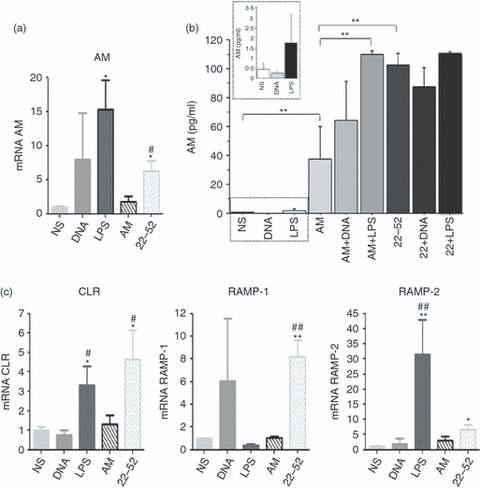
Expression of adrenomedullin (AM), calcitonin receptor-like receptor (CLR), receptor activity-modifying protein 1 (RAMP-1) and RAMP-2 by adrenomedullin-stimulated dendritic cells (DC). Bone-marrow-dericed DC were stimulated as previously described for 24 hr. AM expression was assayed using quantitative PCR (a) and ELISA (b). Quantitative real-time PCR for AM receptors CLR, RAMP-1, RAMP-2 and RAMP-3 were performed to quantify mRNA expression after DC stimulation (see Materials and methods section) (c). Data are the means ± SEM of three independent experiments. Unpaired t-test. *P < 0·05,**P < 0·01 lipopolysaccharide (LPS) versus non-stimulated cells (NS) and #P < 0·01, ##P < 0·01 LPS versus DNA-stimulated cells.
AM-DC remain capable of stimulating naive allogeneic T cells
To investigate DC functional capacities, stimulated DC were co-cultured with anti-CD3-activated CD4+ CD25− allogeneic T cells for 3 days. Then T-cell proliferation was analysed by flow cytometry (see Materials and methods section, CFSE dilution through CFSE-labelled effector T-cell division). Figure 5 shows that non-stimulated DC weakly induced T-cell division; in contrast, AM-DC or (22-52)AM-stimulated DC were able to favour T-cell proliferation as plasmid-treated or LPS-treated DC did. Overall, AM-stimulated DC were able to establish strong interaction with T lymphocytes, although they expressed a low level of co-stimulatory molecules.
Figure 5.
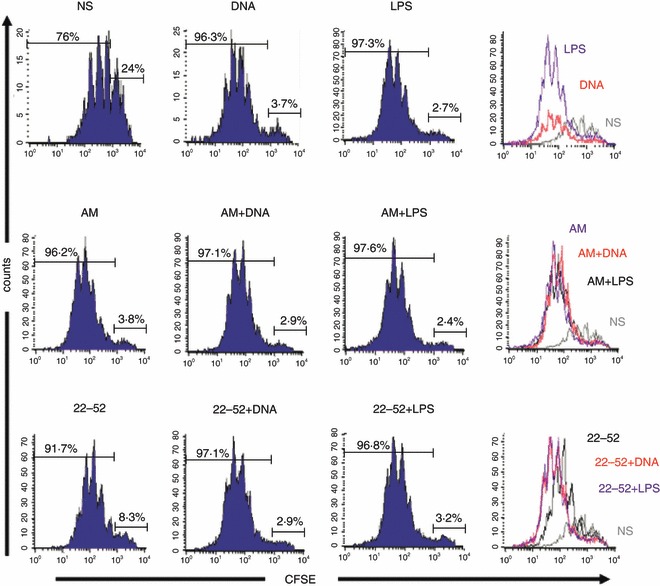
Allogeneic T-cell stimulation by adrenomedullin (AM) -stimulated dendritic cells (DC). Stimulated DC were mixed with carboxyfluorescein succinimidyl ester (CFSE) -labelled allogeneic naive CD4+ T cells for 72 hr with different ratios of DC (DC : T, 1 : 5, 1 : 10 and 1 : 20). Percentage of proliferating CD4+ T cells is represented for DC : T ratio 1 : 20 (similar profile and percentages for 1 : 5 and 1 : 10 ratios). Data are representative of three independent experiments, each realized in triplicate. LPS, lipopolysaccharide.
AM-treated DC express IDO
The IDO expression is strongly associated with the tolerogenic properties of DC. We therefore measured IDO expression by DC using real-time qPCR after 24 hr of stimulation (Fig. 6a). In keeping with previous data, IDO was expressed at the basal level by non-stimulated DC. Lipopolysaccharide induced marked IDO mRNA expression of up to five-fold the control level. Surprisingly, AM was an even more potent inducer of IDO expression by DC than LPS. In contrast, the derived peptide (22-52)AM did not induce significant IDO expression. Although LPS and AM increased IDO expression when used alone, their combination had no effect (data not shown). These expression profiles of IDO were confirmed by IDO intracellular expression staining analysis (Fig. 6b) in AM-DC and LPS-DC.
Figure 6.
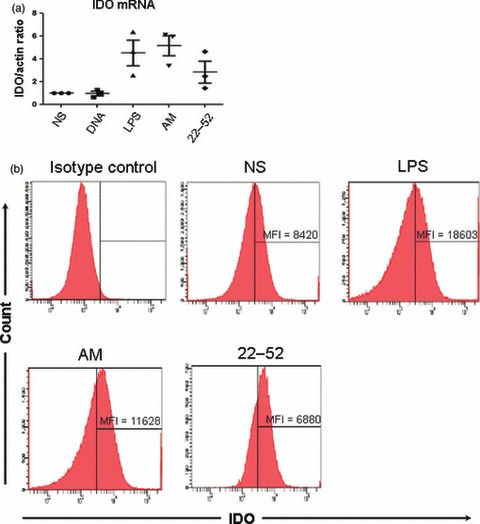
Expression of indoleamine 2,3-dioxygenase (IDO) by adrenomedullin (AM) -stimulated dendritic cells (DC). (a) Expression of IDO was quantified by real-time quantitative PCR. The results were normalized for actin expression (three independent experiments). (b) Intracellular staining of IDO was assayed by flux cytometry in stimulated CD11c+ bone-marrow-derived DC of a representative of four independent experiments. LPS, lipopolysaccharide; NS, non-stimulated.
Up-regulation of regulatory T-cell markers
In various experimental studies, the in vivo protective action of DC was correlated with an induction of Treg cells 4,6 and partially mediated through IDO expression.26,27
We then evaluated the proportion of CD25+ Foxp3+ Treg cells and CD25+ Foxp3− activated T cells among CD4+ T cells. Fully mature DC obtained using LPS stimulation were associated with a decreased of Treg cell/activated T-cell ratio (8 ± 0·4% for LPS versus 13 ± 0·1% for control, Fig. 7c). In contrast, AM-DC cultured with syngeneic purified CD4+ T cells were associated with an increased Treg cell/activated T-cell ratio (22 ± 0·01%, Fig. 7c). These data suggest either an increase in Treg cells or a decrease in activated CD25+ T cells. However, no difference was observed for the CD25+ Foxp3+ Treg : Foxp3– effector cell ratio.
Figure 7.
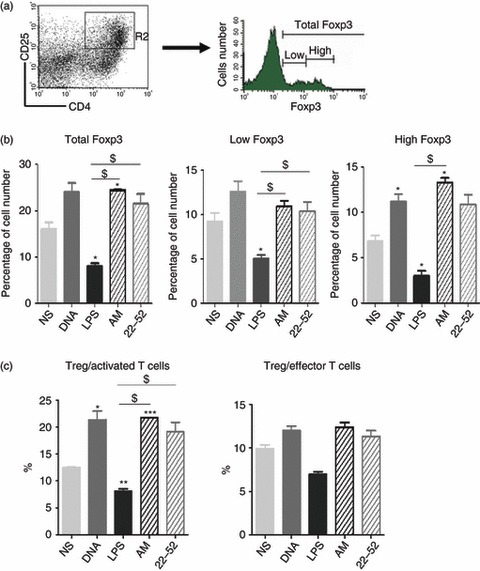
In vitro T regulatory cell induction by adrenomedullin (AM) -stimulated dendritic cells (DC). Total CD4+ T cells (CD25-positive and CD25-negative) were incubated with autologous stimulated DC for 72 hr at a DC : T-cell ratio of 1 : 20. After co-culturing, cells positive for CD4, CD25 or Foxp3 were counted in each co-culture, using flow cytometry. (a) Percentage of Foxp3+ cells among CD4+ CD25+ cells. Representative experiment showing the differential expression of Foxp3+ cells when gated for CD4+ CD25+ cells (R2 region). (b) Representation of the ratio of CD4+ CD25+ Foxp3+ T cells : CD25+ activated T cells. The data are representative of three independent experiments, each performed in triplicate. *P < 0·05, **P < 0·005, and ***P < 0·0005 compared with non-stimulated cells (NS). $P < 0·05 where indicated, unpaired t-test. LPS, lipopolysaccharide.
More importantly, the increase in the Treg cell : activated T-cell ratio was associated with a modification in Foxp3 expression, as observed in CD4+ CD25+ cells and measured after co-culturing. Following contact with AM-DC, the total Foxp3-positive cell count was increased compared with non-stimulated DC (25 ± 0·1% with AM-DC versus 16 ± 1·5% for control DC, Fig. 7b). Foxp3 is a transcription factor originally described as specifically expressed by naturally occurring CD4+ CD25+ Treg.28 However, it has recently been shown that some cells expressing Foxp3 are devoid of suppressive effects. Defining cells by high Foxp3 expression is a better guarantee to have cells with regulatory properties.29 We therefore looked for T cells expressing high levels of Foxp3. The percentage of Foxp3high cells was higher in CD4+ CD25+ T cells after co-culture with AM-DC than with other types of DC stimulation (Fig. 7b). Although AM treatment increased the ability of DC to activate T-cell proliferation, in a similar manner to plasmid DNA and LPS, the significant Foxp3 up-regulation suggested a role for AM in Treg cell development. Taken together, these data suggest that AM-DC may promote the conversion of CD4+ T cells to CD4+ CD25+ Foxp3high Treg cells and markedly decrease the number of activated T cells. When we used allogeneic T cells, we found no difference in Treg cell induction (data not shown).
Discussion
Using AM stimulation of DC, we show for the first time that a neuropeptide can induce a semi-mature phenotype of DC actually involved in Treg cell stimulation. We show here for the first time that DC stimulated in vitro with AM or its 22-52 fragment express a semi-mature phenotype with weak surface expression of co-stimulatory molecules and decreased endocytic capacities but a preserved ability to stimulate allogeneic T cells. Except if pre-incubated, exposure to AM or (22-52)AM did not strongly modify the maturation phenotype or cytokine expression induced by TLR ligands, and AM exposure did not potentiate the effect of LPS on DC maturation, indicating that no cooperation occurred between TLR ligands and AM or (22-52)AM. In the in vivo murine collagen-induced arthritis model, AM possesses immunoregulatory effects and induces Treg cell expansion in secondary lymphoid tissues.18 The link between these effects and the other properties of AM also involved in angiogenesis was unclear. Here, we demonstrated that DC modulation may mediate some of the regulatory effects of AM. Regarding the complexity of DC phenotypes present in vivo, the in vitro mouse model of GM-CSF BMDC is one of the most used to obtain large amounts of DC. This model represents an opportunity to overcome the complexity of DC and to streamline our understanding of immune responses in pathophysiological conditions independently of highly inflammatory DC conditioning with both GM-CSF and IL-4.23
The molecular basis underlying the effects of AM on DC remains unclear. Although CLR may serve as an AM receptor, its ligand specificity is determined by the type of co-expressed RAMP. Co-expression of RAMP-1 and CLR results in functional calcitonin gene-related peptide type 1 receptors, whereas CLR with RAMP-2 or RAMP-3 serves as a functional AM receptor. Here, we demonstrated that immature DC expressed basal levels of CLR and of the co-receptors RAMP-1 and RAMP-2. Although, we did not detect RAMP-3, these data suggest that DC may express AM-receptor mRNA. Interestingly, CLR/RAMP-1 has been shown to be the major RAMP molecule for AM binding in other cell types and was recently identified in rheumatoid arthritis synoviocytes.30 However, we have not yet evaluated cAMP production by DC as a marker for CLR activation.
Dendritic cells are also able to produce AM, and this production increases, at least in vitro, with DC maturation (LPS). These data suggest that AM may exhibit autocrine and paracrine activities. This feedback seems to be complex because AM itself induced its receptors, and then its activity, because AM stimulation of DC induced a semi-matured phenotype, and because pre-incubation of DC with AM seems to favour a less mature phenotype, even after LPS stimulation.
If AM can interact with its receptors, an alternative pathway to DC stimulation may involve passive internalization of AM followed by activation within intracytoplasmic vacuoles. This issue is of interest, because changes in endocytosis modifications markedly alter the results of tests used to characterize DC maturation.
This study highlights two complementary aspects of AM effects on DC. First, AM induces marked changes in cytokine production by DC: IL-10 and TNF-α release are decreased, whereas IFN-γ release is considerably increased. New data on the effect of IFN-γ on tolerance support a role for the marked IFN-γ production in DC regulatory properties. Interferon-γ has recently been implicated in inducing tolerogenic antigen-presenting cells, thereby promoting Treg cell development.31 In our study, IFN-γ production during DC differentiation promoted the generation of regulatory DC expressing lower levels of co-stimulatory molecules than in the absence of IFN-γ and exhibiting a reduced capacity to stimulate allogeneic T cells but remaining capable of inducing Foxp3 T cells with suppressive functions. Moreover, IFN type 2 is a strong inducer of IDO, a catabolic enzyme implicated in the conversion of tryptophan to N-formylkynurenine and subsequently to kynurenine. IDO has been implicated in the generation of tolerance during physiological and pathological processes including infection, allogeneic pregnancy, graft rejection prevention, tumour invasion and autoimmunity (encephalomyelitis, rheumatoid arthritis). In collagen-induced arthritis, IDO induction has been demonstrated to occur in lymph node DC. Activity of IDO conferred protection against the disease, whereas IDO blockade exacerbated the severity of the disease.32 Furthermore, IDO-expressing DC are involved in the generation of CD4+ CD25+ Foxp3+ Treg cells and prevent their conversion to Th17 cells.27 We also found high levels of IDO mRNA in AM-DC. However, using a colorimetric method, we were unable to detect kynurenine, a downstream tryptophan metabolite produced by active IDO forms (data not shown). This result is in keeping with a report by Hara et al.33 of markedly diminished kynurenine concentrations in the supernatants of DC cultured with IDO, as the result of a reaction of the acidic deproteinization treatment with kynurenine that generates a new compound not detected by the Ehrlich reagent. Furthermore, the nitric oxide pathway may be implicated in the anti-apoptotic effects of AM on endothelial cells.34 Therefore, we suspect that, as with CpG motifs, nitric oxide contained in AM-DC medium may interfere with tryptophan metabolites, leading to underestimation of IDO activity, although we found a high level of IDO transcription.
Previous studies demonstrated that IFN signalling and IDO played a pivotal role in Treg cell activation, so we compared the Treg percentage after co-culturing of total CD4+ T cells with DC. Flow cytometry of gated CD4+ CD25+ cells showed enrichment in total Foxp3+ cells after 72 hr of incubation with AM-DC. In contrast, LPS-matured DC strongly decreased the expression of Foxp3 by CD4+ CD25+ T cells. Foxp3, which is predominantly expressed by naturally occurring CD4+ CD25+ Treg cells, is a transcription factor that controls Treg cell development and function and may contribute to Treg cell survival.28 A recent study in humans demonstrated that some Foxp3-positive cells had no suppressive effects.29 We therefore separated the CD4+ T cells into populations characterized by low and high levels of Foxp3 expression, respectively. AM-DC, but not LPS-DC, induced the emergence of CD4+ CD25+ Foxp3high T cells. (22-52)AM did not replicate this effect of AM, suggesting involvement of the AM-specific intramolecular loop. Furthermore, in our experiments, AM seemed not to act directly on T cells, because DC stimulated for 24 hr were washed several times to ensure complete removal of the supernatant. Therefore, AM acts via DC and this study provides the first evidence that AM induces a Foxp3high Treg cell population. Importantly, AM enables DC to strongly stimulate allogeneic T cells. Because AM-DC expressed low levels of MHC II, CD80 and CD86, the Treg cell stimulation observed in our study may be ascribable to other molecules such as CD40/CD40 ligand (CD154) or CD27/CD70 or inducible co-stimulator (ICOS)/ICOS ligand.35
We suggest a model that summarizes the potential effects of AM on DC (Fig. 8) and the role for AM in Treg cell induction. Briefly, AM interacts with DC, probably via the AM receptor CLR/RAMP expressed by DC. The AM release by DC may also amplify AM receptor expression via an autocrine or paracrine loop, as observed with fully matured (LPS) DC. CLR signalling induces marked IFN production, which may in turn be involved in IDO up-regulation via autocrine effects. The IDO-positive DC can cross-talk with naive CD4+ T cells and promotes their conversion to Treg cells expressing high levels of Foxp3. This IFN-γ–IDO-dependent axis may explain the Treg induction by AM in experimental arthritis.18 Adrenomedullin or (22-52)AM may constitute a novel pathway for regulating DC and Treg cell expansion and activity.
Figure 8.
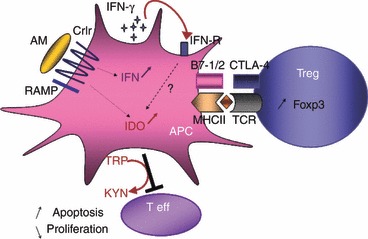
AM interacts with DC via CLR/RAMP expressed by DC. CLR signalling induces marked IFN production which may induced IDO upregulation via autocrine effects. IDO-positive DC promotes Foxp3 expression inducing Treg phenotype; IDO converts Trp in Kyn and blocks T effector cells. AM, adrenomedullin; APC, antigen presentating cell; CRLR, calcitonin receptor-like receptor; CTLA-4, Cytotoxic T-Lymphocyte Antigen 4; IDO, Indoleamine2-3 dioxygenase; IFN-γ, Interferon gamma; MHCII, Major Histocompatibility Class II molecules; RAMP, receptor activity-modifying protein receptor; TCR, T cell Receptor; Teff, Effector T cell; Treg, Tregulatory lymphocyte.
Acknowledgments
We are grateful to Stephane Chambris for providing excellent animal care. This work was financially supported by three non-profit organizations, Arthritis-Fondation Courtin (Neuilly, France), Association pour la Recherche en Pathologie Synoviale (ARPS, Paris) and Association Rhumatisme et Travail (Paris).
Glossary
- AM
adrenomedullin
- AM-DC
AM-stimulated dendritic cells
- CLR
calcitonin receptor-like receptor
- DC
dendritic cell
- GM-CSF
granulocyte-macrophage colony-stimulating factor
- IDO
indoleamine 2,3-dioxygenase
- LPS
lipopolysaccharide
- LPS-DC
lipopolysaccharide-stimulated dendritic cells
- MHC
major histocompatibility complex
- PBS
phosphate buffer saline
- RAMP
receptor activity-modifying protein
- qPCR
quantitative polymerase chain reaction
- TLR
toll-like receptor
- Treg
regulatory T cells
Disclosures
The authors declare no financial or commercial conflict of interest.
References
- 1.Liu K, Nussenzweig MC. Origin and development of dendritic cells. Immunol Rev. 2010;234:45–54. doi: 10.1111/j.0105-2896.2009.00879.x. [DOI] [PubMed] [Google Scholar]
- 2.Coquerelle C, Moser M. DC subsets in positive and negative regulation of immunity. Immunol Rev. 2010;234:317–34. doi: 10.1111/j.0105-2896.2009.00887.x. [DOI] [PubMed] [Google Scholar]
- 3.Charbonnier LM, van Duivenvoorde LM, Apparailly F, et al. Immature dendritic cells suppress collagen-induced arthritis by in vivo expansion of CD49b+ regulatory T cells. J Immunol. 2006;177:3806–13. doi: 10.4049/jimmunol.177.6.3806. [DOI] [PubMed] [Google Scholar]
- 4.van Duivenvoorde LM, Louis-Plence P, Apparailly F, van der Voort EI, Huizinga TW, Jorgensen C, Toes RE. Antigen-specific immunomodulation of collagen-induced arthritis with tumor necrosis factor-stimulated dendritic cells. Arthritis Rheum. 2004;50:3354–64. doi: 10.1002/art.20513. [DOI] [PubMed] [Google Scholar]
- 5.Hill M, Tanguy-Royer S, Royer P, et al. IDO expands human CD4+ CD25high regulatory T cells by promoting maturation of LPS-treated dendritic cells. Eur J Immunol. 2007;37:3054–62. doi: 10.1002/eji.200636704. [DOI] [PubMed] [Google Scholar]
- 6.Jaen O, Rulle S, Bessis N, Zago A, Boissier MC, Falgarone G. Dendritic cells modulated by innate immunity improve collagen-induced arthritis and induce regulatory T cells in vivo. Immunology. 2009;126:35–44. doi: 10.1111/j.1365-2567.2008.02875.x. [DOI] [PMC free article] [PubMed] [Google Scholar]
- 7.Lu J, Zheng MH, Yan J, Chen YP, Pan JP. Effects of vasoactive intestinal peptide on phenotypic and functional maturation of dendritic cells. Int Immunopharmacol. 2008;8:1449–54. doi: 10.1016/j.intimp.2008.06.002. [DOI] [PubMed] [Google Scholar]
- 8.Guillot X, Semerano L, Saidenberg-Kermanac’h N, Falgarone G, Boissier MC. Vitamin D and inflammation. Joint Bone Spine. 2011;77:552–7. doi: 10.1016/j.jbspin.2010.09.018. [DOI] [PubMed] [Google Scholar]
- 9.Hinson JP, Kapas S, Smith DM. Adrenomedullin, a multifunctional regulatory peptide. Endocr Rev. 2000;21:138–67. doi: 10.1210/edrv.21.2.0396. [DOI] [PubMed] [Google Scholar]
- 10.Muff R, Born W, Fischer JA. Adrenomedullin selectivity of calcitonin-like receptor/receptor activity modifying proteins. Hypertens Res. 2003;26(Suppl):S3–8. doi: 10.1291/hypres.26.s3. [DOI] [PubMed] [Google Scholar]
- 11.Chakravarty P, Suthar TP, Coppock HA, Nicholl CG, Bloom SR, Legon S, Smith DM. CGRP and adrenomedullin binding correlates with transcript levels for calcitonin receptor-like receptor (CRLR) and receptor activity modifying proteins (RAMPs) in rat tissues. Br J Pharmacol. 2000;130:189–95. doi: 10.1038/sj.bjp.0702975. [DOI] [PMC free article] [PubMed] [Google Scholar]
- 12.Ichikawa-Shindo Y, Sakurai T, Kamiyoshi A, et al. The GPCR modulator protein RAMP2 is essential for angiogenesis and vascular integrity. J Clin Invest. 2008;118:29–39. doi: 10.1172/JCI33022. [DOI] [PMC free article] [PubMed] [Google Scholar]
- 13.Uzan B, Ea HK, Launay JM, Garel JM, Champy R, Cressent M, Liote F. A critical role for adrenomedullin-calcitonin receptor-like receptor in regulating rheumatoid fibroblast-like synoviocyte apoptosis. J Immunol. 2006;176:5548–58. doi: 10.4049/jimmunol.176.9.5548. [DOI] [PubMed] [Google Scholar]
- 14.Uzan B, Villemin A, Garel JM, Cressent M. Adrenomedullin is anti-apoptotic in osteoblasts through CGRP1 receptors and MEK-ERK pathway. J Cell Physiol. 2008;215:122–8. doi: 10.1002/jcp.21294. [DOI] [PubMed] [Google Scholar]
- 15.Miyashita K, Itoh H, Sawada N, Fukunaga Y, Sone M, Yamahara K, Yurugi T, Nakao K. Adrenomedullin promotes proliferation and migration of cultured endothelial cells. Hypertens Res. 2003;26(Suppl):S93–8. doi: 10.1291/hypres.26.s93. [DOI] [PubMed] [Google Scholar]
- 16.Wu R, Zhou M, Wang P. Adrenomedullin and adrenomedullin binding protein-1 downregulate TNF-α in macrophage cell line and rat Kupffer cells. Regul Pept. 2003;3:19–26. doi: 10.1016/s0167-0115(03)00018-1. [DOI] [PubMed] [Google Scholar]
- 17.Ashizuka S, Ishikawa N, Kato J, Yamaga J, Inatsu H, Eto T, Kitamura K. Effect of adrenomedullin administration on acetic acid-induced colitis in rats. Peptides. 2005;26:2610–5. doi: 10.1016/j.peptides.2005.05.007. [DOI] [PubMed] [Google Scholar]
- 18.Gonzalez-Rey E, Chorny A, O’Valle F, Delgado M. Adrenomedullin protects from experimental arthritis by down-regulating inflammation and Th1 response and inducing regulatory T cells. Am J Pathol. 2007;170:263–71. doi: 10.2353/ajpath.2007.060596. [DOI] [PMC free article] [PubMed] [Google Scholar]
- 19.Okura T, Marutsuka K, Hamada H, Sekimoto T, Fukushima T, Asada Y, Kitamura K, Chosa E. Therapeutic efficacy of intra-articular adrenomedullin injection in antigen-induced arthritis in rabbits. Arthritis Res Ther. 2008;10:R133. doi: 10.1186/ar2550. [DOI] [PMC free article] [PubMed] [Google Scholar]
- 20.Ah Kioon MD, Asensio C, Ea HK, et al. (22-52) Adrenomedullin combats inflammation and prevents systemic bone loss in murine collagen-induced arthritis. Arthritis Rheum. 2011;25:25–25. doi: 10.1002/art.33426. [DOI] [PubMed] [Google Scholar]
- 21.Balasch J, Guimera M, Martinez-Pasarell O, Ros J, Vanrell JA, Jimenez W. Adrenomedullin and vascular endothelial growth factor production by follicular fluid macrophages and granulosa cells. Hum Reprod. 2004;19:808–14. doi: 10.1093/humrep/deh204. [DOI] [PubMed] [Google Scholar]
- 22.Makino Y, Nakamura H, Ikeda E, et al. Hypoxia-inducible factor regulates survival of antigen receptor-driven T cells. J Immunol. 2003;171:6534–40. doi: 10.4049/jimmunol.171.12.6534. [DOI] [PubMed] [Google Scholar]
- 23.Belz GT, Nutt SL. Transcriptional programming of the dendritic cell network. Nat Rev Immunol. 2012;12:101–13. doi: 10.1038/nri3149. [DOI] [PubMed] [Google Scholar]
- 24.Lutz MB, Kukutsch N, Ogilvie AL, Rossner S, Koch F, Romani N, Schuler G. An advanced culture method for generating large quantities of highly pure dendritic cells from mouse bone marrow. J Immunol Methods. 1999;223:77–92. doi: 10.1016/s0022-1759(98)00204-x. [DOI] [PubMed] [Google Scholar]
- 25.Takikawa O, Kuroiwa T, Yamazaki F, Kido R. Mechanism of interferon-γ action. Characterization of indoleamine 2,3-dioxygenase in cultured human cells induced by interferon-γ and evaluation of the enzyme-mediated tryptophan degradation in its anticellular activity. J Biol Chem. 1988;263:2041–8. [PubMed] [Google Scholar]
- 26.Fallarino F, Grohmann U, You S, et al. The combined effects of tryptophan starvation and tryptophan catabolites down-regulate T cell receptor zeta-chain and induce a regulatory phenotype in naive T cells. J Immunol. 2006;176:6752–61. doi: 10.4049/jimmunol.176.11.6752. [DOI] [PubMed] [Google Scholar]
- 27.Baban B, Chandler PR, Sharma MD, Pihkala J, Koni PA, Munn DH, Mellor AL. IDO activates regulatory T cells and blocks their conversion into Th17-like T cells. J Immunol. 2009;183:2475–83. doi: 10.4049/jimmunol.0900986. [DOI] [PMC free article] [PubMed] [Google Scholar]
- 28.Fontenot JD, Gavin MA, Rudensky AY. Foxp3 programs the development and function of CD4+ CD25+ regulatory T cells. Nat Immunol. 2003;4:330–6. doi: 10.1038/ni904. [DOI] [PubMed] [Google Scholar]
- 29.Miyara M, Yoshioka Y, Kitoh A, et al. Functional delineation and differentiation dynamics of human CD4+ T cells expressing the FoxP3 transcription factor. Immunity. 2009;30:899–911. doi: 10.1016/j.immuni.2009.03.019. [DOI] [PubMed] [Google Scholar]
- 30.Ah Kioon MD, Asensio C, Ea HK, Uzan B, Cohen-Solal M, Liote F. Adrenomedullin increases fibroblast-like synoviocyte adhesion to extracellular matrix proteins by upregulating integrin activation. Arthritis Res Ther. 2010;12:R190. doi: 10.1186/ar3160. [DOI] [PMC free article] [PubMed] [Google Scholar]
- 31.Eljaafari A, Li YP, Miossec P. IFN-γ, as secreted during an alloresponse, induces differentiation of monocytes into tolerogenic dendritic cells, resulting in FoxP3+ regulatory T cell promotion. J Immunol. 2009;183:2932–45. doi: 10.4049/jimmunol.0804352. [DOI] [PubMed] [Google Scholar]
- 32.Criado G, Simelyte E, Inglis JJ, Essex D, Williams RO. Indoleamine 2,3 dioxygenase-mediated tryptophan catabolism regulates accumulation of Th1/Th17 cells in the joint in collagen-induced arthritis. Arthritis Rheum. 2009;60:1342–51. doi: 10.1002/art.24446. [DOI] [PubMed] [Google Scholar]
- 33.Hara T, Yamakura F, Takikawa O, Hiramatsu R, Kawabe T, Isobe K, Nagase F. Diazotization of kynurenine by acidified nitrite secreted from indoleamine 2,3-dioxygenase-expressing myeloid dendritic cells. J Immunol Methods. 2008;2:162–9. doi: 10.1016/j.jim.2007.11.010. [DOI] [PubMed] [Google Scholar]
- 34.Sata M, Kakoki M, Nagata D, et al. Adrenomedullin and nitric oxide inhibit human endothelial cell apoptosis via a cyclic GMP-independent mechanism. Hypertension. 2000;36:83–8. doi: 10.1161/01.hyp.36.1.83. [DOI] [PubMed] [Google Scholar]
- 35.Goronzy JJ, Weyand CM. T-cell co-stimulatory pathways in autoimmunity. Arthritis Res Ther. 2008;10(Suppl 1):S3. doi: 10.1186/ar2414. [DOI] [PMC free article] [PubMed] [Google Scholar]