

Abstract
Phenotypic characterization of T and B lymphocytes allows the discrimination of functionally different subsets. Here, we questioned whether changes in peripheral lymphocyte subset distribution reflect specific clinical and histopathological entities after renal transplantation. Sixty-five renal transplant recipients with either histologically proven (sub)clinical acute rejection or chronic allograft dysfunction, or without abnormalities were studied for their peripheral lymphocyte subset composition and compared with 15 healthy control individuals. Naive, memory and effector CD8+ T-cell counts were measured by staining for CD27, CD28 and CD45RO/RA. In addition, we studied the CD25+ CD4+ T-cell population for its composition regarding regulatory Foxp3+ CD45RO+ CD127– cells and activated CD45RO+ CD127+ cells. Naive, non-switched and switched memory B cells were defined by staining for IgD and CD27. We found a severe decrease in circulating effector-type CD8+ T cells in recipients with chronic allograft dysfunction at 5 years after transplantation. Percentages of circulating CD25+ CD127low CD4+ regulatory T cells after transplantation were reduced, but we could not detect any change in the percentage of CD127+ CD45RO+ CD4+ activated T cells in patients at any time or condition after renal transplantation. Regardless of clinical events, all renal transplant recipients showed decreased total B-cell counts and a more differentiated circulating B-cell pool than healthy individuals. The changes in lymphocyte subset distribution probably reflect the chronic antigenic stimulation that occurs in these transplant recipients. To determine the usefulness of lymphocyte subset-typing in clinical practice, large cohort studies are necessary.
Keywords: acute rejection, chronic allograft dysfunction, kidney transplantation, lymphocytes, subclinical rejection, T-cell subsets
Introduction
Kidney transplantation improves the quality of life as well as the survival of patients with end-stage renal disease. Although advances in immunosuppressive therapy have markedly prolonged short-term graft survival, long-term graft survival has changed little.1,2 Apart from death with a functioning graft, most grafts are lost as the result of a degenerative process characterized by interstitial fibrosis, tubular atrophy and accelerated arteriosclerosis.3,4 Lymphocytes play a key role in the immune response against an allograft.5 In the past, many different T-lymphocyte characteristics, such as markers associated with T-cell activation, cell proliferation, cytokine production and cytotoxicity, have been studied for their suitability to monitor the development and progression of allograft rejection.6–8 A number of studies have reported sensitive and specific cellular markers that define allospecific T-cell populations in patients with chronic graft rejection. They showed that CD25+ CD4+ T cells expressing interleukin-17 receptor α (IL-7Rα; CD127) contain allospecific cells that expand in the peripheral blood compartment of stable transplant recipients and expand further in patients with chronic rejection.9,10
We here tested whether different clinical conditions after renal transplantation would be reflected by changes in the distribution of other circulating lymphocyte subsets We studied 65 patients who received transplants in our centre, and from whom cryopreserved peripheral blood lymphocytes were available. From 56 of these patients, a renal biopsy had been taken, either for clinical reasons or according to protocol. In these patients, and in 15 healthy control individuals, we studied lymphocyte subset composition in the peripheral blood compartment at several time-points after transplantation.
Materials and methods
Study subjects
The study was approved by the Medical Ethical Committee of the Academic Medical Centre, Amsterdam and all participants gave informed consent. Fifteen healthy individuals (median age 55 years, range 42–63; eight men/seven women) and 65 renal transplant recipients participated. All patients had received transplants between January 2002 and January 2009. During that time, biopsies according to protocol were taken at 6 and 24 months after transplantation. Moreover, peripheral blood mononuclear cells were frozen at regular time intervals and, in case of a biopsy, an additional blood sample was obtained. Only those patients from whom enough peripheral lymphocytes had been frozen could participate in the present study. To study different clinical situations after transplantation, we chose patients with histologically proven subclinical or acute cellular rejection. For comparison, other patients without any abnormalities in their protocol biopsy at 6 months after transplantation were examined. Ten patients were included who showed clinical signs of acute T-cell-mediated rejection, which was confirmed by histology showing acute cellular rejection according to the Banff classification criteria (type IA: n = 5; type IB: n = 5). In 10 patients without any clinical signs of rejection, abnormalities were present in their protocol biopsy at 6 months after transplantation that were classified according to the Banff classification as borderline changes (i2t1: n = 4; i3t1: n = 6). These patients were defined as having subclinical rejection. Ten other patients had no clinical sign of rejection and nor did their protocol biopsy at 6 months after transplantation show any abnormality. They were defined as stable at 6 months.
We also examined circulating lymphocyte subsets in patients at 2 and 5 years after transplantation. At both time-points we compared patients with stable graft function and patients with chronic allograft dysfunction. Ten patients from whom a protocol biopsy had been taken at 2 years after transplantation (2·1 ± 0·2 years), when they did not show any clinical sign of graft dysfunction, and from whom peripheral blood mononuclear cells were still present, were included. None of these biopsies showed abnormalities (2 years stable graft function group). Ten other patients who showed clinical deterioration of graft function at 2 years after transplantation (2·4 ± 1·1 years, chronic allograft dysfunction) were included. Their biopsies showed abnormalities consistent with chronic T-cell-mediated rejection. Regarding patient groups at 5 years after transplantation, nine patients were included who had stable graft function, defined as a creatinin clearance (MDRD, Modification of Diet in Renal Disease Study) above 30 ml/min/1·73 m2, no proteinuria, and no hypertension. From them, peripheral blood mononuclear cells were available, but no biopsy specimens had been taken (5·8 ± 0·9 years, 5-year stable graft function group). None of these patients had shown clinical signs of rejection or deteriorating graft function anytime during the post-transplant period. Finally, six patients were included who showed signs of graft deterioration late after transplantation (4·8 ± 0·5 years, chronic allograft dysfunction), with signs of chronic T-cell-mediated rejection in their biopsy and a negative peritubular C4d-staining. No signs of calcineurin toxicity were detectable in any of the patients with chronic allograft dysfunction. Donor-specific antibodies were measured yearly after transplantation and on clinical indication. Circulating donor-specific antibodies were never detectable at any time point after transplantation in the studied patients. These patient groups and their characteristics are summarized in Table 1.
Table 1.
Clinical characteristics of patient groups
| 6 months | 2 years | 5 years | |||||
|---|---|---|---|---|---|---|---|
| Stable | SCR | AR | Stable | CAD | Stable | CAD | |
| Time after transplantation | n = 10 | n = 10 | n = 10 | n = 10 | n = 10 | n = 9 | n = 6 |
| Age in years, mean (SD) | 54 (13) | 43 (18) | 47 (15) | 51 (17) | 46 (13) | 39 (14) | 37 (20) |
| Sex, male/female, n | 7/3 | 9/1 | 9/1 | 6/4 | 6/4 | 4/5 | 2/4 |
| Underlying disease, n | |||||||
| Vascular | 1 | 2 | 1 | 2 | 1 | 3 | 1 |
| Glomerular | 4 | 5 | 6 | 2 | 4 | 1 | 0 |
| Interstitial | 1 | 1 | 1 | 2 | 2 | 3 | 0 |
| Congenital/hereditary | 2 | 2 | 0 | 3 | 2 | 2 | 3 |
| Diabetic nephropathy | 0 | 0 | 1 | 0 | 0 | 0 | 0 |
| Unknown | 2 | 0 | 1 | 1 | 1 | 0 | 2 |
| No. transplant, 1/2 | 10/0 | 9/1 | 8/2 | 10/0 | 8/2 | 9/0 | 6/0 |
| Immunosuppression | |||||||
| Prednisolone (%) | 100 | 100 | 100 | 100 | 100 | 100 | 100 |
| Mycophenolate (%) | 100 | 100 | 100 | 100 | 100 | 89 | 100 |
| Cyclosporin (%) | 100 | 100 | 60 | 100 | 60 | 78 | 100 |
| CD25 mAb (%) | 90 | 100 | 80 | 90 | 90 | 33 | 17 |
| Tacrolimus (%) | 0 | 0 | 30 | 0 | 40 | 22 | 0 |
| No. HLA mismatches1 | |||||||
| HLA-A/B | 2 (0–4) | 2 (0–4) | 2 (0–3) | 2 (0–3) | 2 (0–3) | 2 (0–3) | 2 (2–2) |
| HLA-DR | 1 (0–2) | 1 (0–1) | 1 (0–2) | 1 (0–2) | 0 (0–1) | 1 (0–1) | 1 (0–1) |
| CMV seropositive before Tx | 8 | 6 | 7 | 8 | 7 | 4 | 1 |
| CMV seropositive after Tx | 8 | 7 | 8 | 8 | 8 | 5 | 2 |
| Type of donor, DD/LD | 4/6 | 6/4 | 7/3 | 5/5 | 9/1 | 5/4 | 4/2 |
SCR, subclinical rejection; AR, acute rejection; CAD, chronic allograft dysfunction; mAb, monoclonal antibody; CMV, cytomegalovirus; Tx, transplant; DD, deceased donor; LD, living donor.
Median (range).
Isolation of peripheral blood mononuclear cells and FACS analysis
Peripheral blood mononuclear cells were isolated using standard Ficoll–Hypaque gradient centrifugation and stored in liquid nitrogen until use. The antibodies used for flow cytometric analysis included mouse anti-human allophycocyanin-eFluor780-conjugated CD4 (CD4-APC-eFluor780) (eBioscience Inc., San Diego, CA), CD8-phycoerythrin (PE)-Alexa610 [Becton Dickinson Biosciences (BD), San Jose, CA], CD3-PE-Cy7 (BD), CD27-FITC (Sanquin, Amsterdam, the Netherlands), CD45RO-PE (R&D Systems, Minneapolis, MN), IL-7Ra (CD127)-PerCP (peridinin chlorophyll protein)-Cy5.5 (BD), IL-2Rα (CD25)-PE (BD), CD25-APC (BD), CD27-PE (BD), IgD-FITC (BD), CD19-PerCP-Cy5.5 (BD) or CD20-APC (BD). For intracellular Foxp3 analysis, cell preparations were fixed and permeabilized with fixation/permeabilization buffers (eBioscience) after staining of cell surface markers and stained with APC-conjugated rat anti-human Foxp3 (eBioscience). The FACS analysis was performed on FACS-Canto (BD) and analysis was carried out using Flowjo software (Treestar, Ashland, OR).
Statistical analysis
Statistical significance was calculated by two-tailed Student’s t-test when comparing two groups or one-way analysis of variance when comparing more than two groups. A P-value of < 0·05 was considered significant.
Results
Decreased absolute number of CD4+ and CD8+ T cells after transplantation in patients with stable graft function
Based on CD27 and CD45RO expression, CD4+ and CD8+ T cells can be divided into undifferentiated, naive cells and differentiated memory and effector cells (Fig. 1a).11–13 The percentage of CD4+ T cells after transplantation did not differ from that in healthy control individuals. However, their absolute number at 6 months after transplantation was lower than in healthy individuals, which persisted in recipients with a stable graft function at 2 and 5 years after transplantation (Fig. 1b). The changes in differentiation status over time were significant, showing a slightly lower percentage of naive cells and an even more subtle higher percentage of effector cells compared with healthy individuals (Fig. 1c). The percentages of total CD8+ T cells did not change after transplantation, but the absolute number decreased already 6 months after transplantation and remained lower compared with healthy individuals (Fig. 1d). The impact on the differentiation status in the CD8+ T-cell compartment was more pronounced than in CD4+ T cells, showing a lower percentage of naive cells and a higher percentage of effector cells compared with healthy individuals. Memory CD8+ T cells remained unchanged (data not shown).
Figure 1.
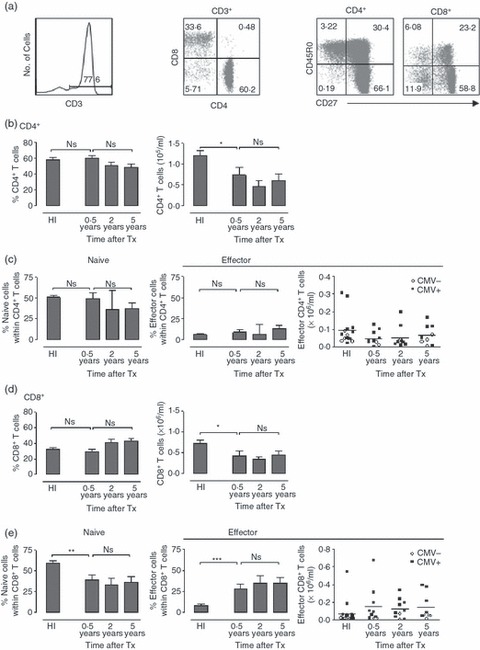
Decrease in absolute number of CD4+ and CD8+ T cells after transplantation in patients with stable graft function. (a) FACS plots show the lymphocyte gate with CD3+ T cells and subsequently CD4+ and CD8+ T cells gating. For subset analysis, CD3+ CD4+ and CD3+ CD8+ T cells were analysed. Naive CD4+ and CD8+ T cells are CD27+ CD45RO−. Effector CD4+ T cells are CD27− CD45RO+, effector CD8+ T cells are CD27− CD45RO−. (b) Bar diagrams show the percentage (left) and absolute number (right) of CD4+ T cells in healthy individuals, recipients with stable graft function at 0·5, 2 and 5 years after transplantation. (c) Bar diagrams show the percentage of naive (left) and effector (right) CD4+ T cells in healthy individuals and transplant recipients at different time-points after transplantation. The scatterplots show the absolute number of effector CD4+ T cells. Black squares depict cytomegalovirus (CMV) -seropositive recipients; white circles depict CMV-seronegative recipients. (d) Diagrams show the percentage (left) and absolute number (right) of CD8+ T cells of healthy individuals and transplant recipients at different time-points after transplantation. (e) Bar diagrams show the percentage of naive (left) and effector (right) CD8+ T cells of healthy individuals and transplant recipients at different time-points after transplantation. The scatterplots show the absolute number of effector CD8+ T cells. Black squares depict CMV-seropositive recipients; white circles depict CMV-seronegative recipients. Healthy individuals (HI) n = 15; 0·5-year stable graft recipients (stable) n = 10; 2-year stable graft recipients n = 10; 5-year stable graft recipients n = 9. Bars represent the mean; error bars the SEM. Comparison between healthy individuals and recipients with stable graft function at 0·5 year after transplantation was carried out using Student’s t-test, comparison between recipients with stable graft function at different time-points after transplantation was performed using one-way analysis of variance. *0·01 < P < 0·05; **0·001 < P < 0·01; ***P < 0·001.
It has been shown that highly differentiated T cells contribute to graft rejection.14 In healthy individuals, these cells are specifically observed in cytomegalovirus (CMV) -seropositive individuals and this pool is further increased after transplantation, probably as the result of immunosuppressive treatment.15,16Figure 1(e) shows that the increased number of effector cells was indeed specifically observed in CMV-seropositive recipients whereas the number of effector cells remained low in CMV-seronegative recipients (P < 0·05).
Both percentage and absolute number of effector CD8+ T cells in patients with chronic allograft dysfunction at 5 years after transplantation are lower than in recipients with stable graft function
We next studied the differentiation state of T cells in patients with different types of rejection. Comparison of CD4+ and CD8+ T-cell subsets of recipients with subclinical rejection, acute rejection or stable graft function neither revealed any difference in the percentage of either subset, nor in their differentiation state (Fig. 2a,b). Recipients with chronic allograft dysfunction and stable graft function had the same percentages of CD4+ and CD8+ T cells at 2 years after transplantation. However, at 5 years after transplantation, the percentage of CD4+ T cells was higher and that of CD8+ T cells was lower in the patients with chronic allograft dysfunction (Fig. 2c,d). Remarkably, the effector CD8+ T cells of patients with chronic allograft dysfunction at 5 years after transplantation showed a strong decrease both in percentage and absolute numbers compared with recipients with a stable graft (Fig. 2d).
Figure 2.
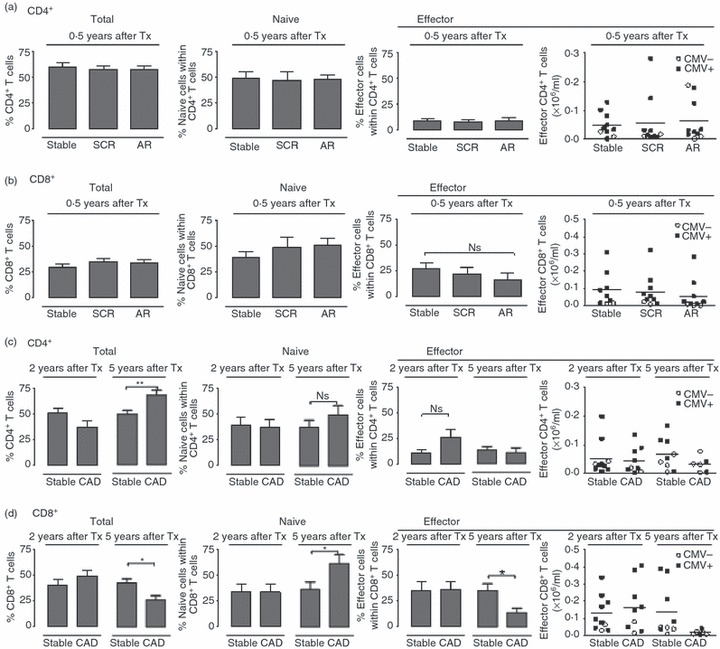
Percentage and absolute numbers of effector CD8+ T cells are decreased in recipients who show chronic allograft dysfunction at 5 years after transplantation. Analysis of CD4+ (a) and CD8+ (b) T-cell subsets of transplant recipients with stable graft function (stable, n = 10), subclinical rejection (SCR, n = 10) or acute rejection (AR, n = 10) at 0·5 years after transplantation. Analysis of CD4+ (c) and CD8+ (d) T-cell subsets of transplant recipients with stable graft function (stable) or chronic allograft dysfunction (CAD) at 2 years or 5 years after transplantation. (2 years after transplantation: stable, n = 10; CAD, n = 10; 5 years after transplantation: stable, n = 9; CAD, n = 6). Bar diagrams show the total percentage of CD4+ or CD8+ T cells within CD3+ T cells (left), the percentage of naive cells (middle) and effector cells (right). Scatterplots show the absolute number of effector cells, black squares represent cytomegalovirus (CMV) -seropositive recipients and white circles represent CMV-seronegative recipients. Comparison between healthy individuals and the group with stable graft function at 0·5 year after transplantation was carried out using Student’s t-test. Comparison between recipients with stable graft function at different time-points after transplantation used a one-way analysis of variance. *P < 0·05.
The percentage of regulatory CD4+ T cells in patients with stable graft function at 0·5 or 2 years after transplantation is lower than at 5 years after transplantation
It has been reported that the fraction of CD127+ CD45RO+ cells within the total CD25+ CD4+ T cells (T-act) is increased in patients with a stable graft function and is even further increased during chronic rejection.9 We adopted the same gating strategy and analysed time-dependent changes in the percentage of these cells in patients with a stable graft function. Within the CD25+ CD4+ T-cell population, subsets of regulatory T cells with a CD127− phenotype and activated T cells with a CD127+ phenotype were recognized (Fig. 3a). The majority of the CD25+ CD4+ T cells with a CD127+ phenotype were Foxp3−, the defining transcription factor of regulatory T cells (Fig. 3a). The percentage of total CD25+ CD4+ T cells at 6 months after transplantation was lower than in healthy individuals (not significant, Fig. 3b). At 2 years after transplantation, the percentage had increased, and at 5 years after transplantation the percentage was even the same as in healthy individuals. The percentage of regulatory, Foxp3+ CD45RO+ CD127– cells (regulatory T cells) within the CD25+ CD4+ T cells in recipients with stable graft function at 6 months and at 2 years after transplantation was clearly decreased. However, at 5 years after transplantation, the percentage had returned to values similar to those in healthy control individuals (Fig. 3c). In recipients with a stable graft function, the percentage of activated, CD45RO+ CD127+ cells within the CD25+ CD4+ T cells at 0·5, 2 and 5 years after transplantation was not significantly different compared with healthy individuals (Fig. 3d).
Figure 3.
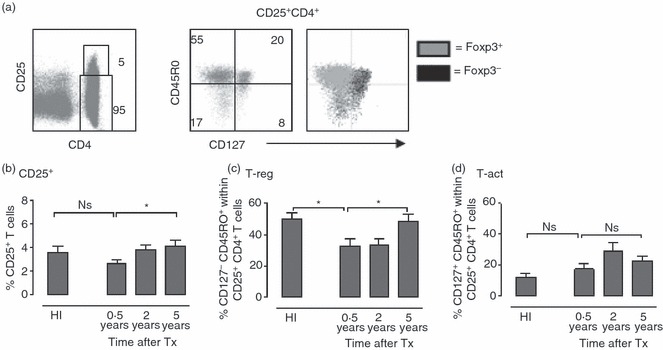
The percentage of regulatory T cells is increased in patients with long-term stable graft function. (a) FACS plots show the gating of CD25+ CD4+ T cells (left) of a representative healthy individual. Subsequent CD127− CD45RO+ (T-reg) and CD127+ CD45RO+ (T-act) gating of the same individual is shown (right). Overlay shows the CD127/CD45RO expression of Foxp3+ cells (grey dots) and Foxp3− cells (black dots). (b) Bar diagram shows the percentage of CD25+ cells within total CD4+ T cells in healthy individuals and in recipients with a stable graft function at 0·5, 2 and 5 years after transplantation. (c) Bar diagram shows the percentage of regulatory T cells within total CD25+ CD4+ T cells. (d) Bar diagram shows the percentage of T-act within total CD25+ CD4+ T cells. Healthy individuals (n = 15); recipients with a stable graft function at 0·5 year (n = 10), 2 years (n = 10), or 5 years (n = 9) after transplantation. Bars represent the mean; error bars represent the SEM. Comparison between healthy individuals and recipients with stable graft function at 0·5 year after transplantation was performed using Student’s t-test. Comparison between recipients with stable graft function at different post-transplantation time-points was carried out using one-way analysis of variance. *P < 0·05.
Patients with stable graft function at 5 years after transplantation have a higher percentage of circulating regulatory CD4+ T cells than patients with chronic allograft dysfunction
T cells with the activated phenotype may be specifically increased during chronic rejection.9 As subclinical rejection may contribute to the pathogenesis of chronic rejection, we studied whether cells with this activated phenotype were also increased during subclinical rejection. In patients with subclinical and acute rejection a non-significant increase in the percentage of CD25+ CD4+ T cells was observed compared with stable transplant recipients. However, we neither found a change in the percentage of regulatory T cells nor a change in percentage of CD127+ CD45RO+ activated T cells (Fig. 4a). We also studied peripheral blood from patients with chronic allograft dysfunction at 2 or 5 years after transplantation. When comparing these groups with stable transplant recipients with a similar follow-up time after transplantation, we did not find a difference in the percentage of total CD25+ CD4+ T cells or in the percentage of activated T cells (Fig. 4b). However, we did find that patients with chronic allograft dysfunction at 5 years after transplantation had a lower percentage of regulatory T cells relative to recipients with a stable graft function.
Figure 4.
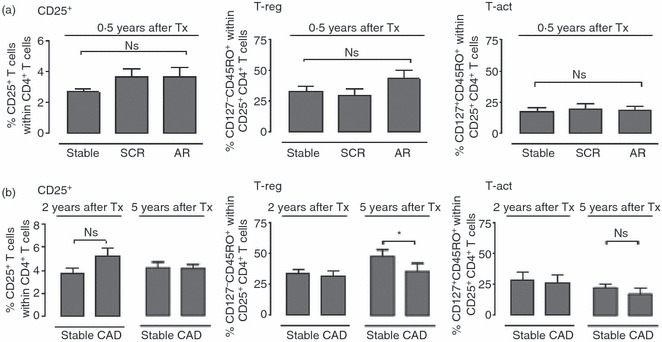
Patients with stable graft function at 5 years after transplantation have a higher percentage of regulatory CD4+ T cells than patients with chronic allograft dysfunction. (a) Bar diagrams show percentages of CD25+ within total CD4+ T cells (left), and CD127− CD45RO+ (T-reg; middle) and CD127+ CD45RO+ (T-act; right) cells within the CD25+ CD4+ T cells of transplant recipients with stable graft (n = 10), subclinical rejection (SCR, n = 10) or acute rejection (AR, n = 10) at 0·5 years after transplantation. (b) Bar diagrams show percentages of CD25+ within total CD4+ T cells (left), T-reg (middle) or T-act (right) of transplant recipients with stable graft function (stable) or chronic allograft dysfunction (CAD) at 2 years or 5 years after transplantation (2 years: stable, n = 10; CAD, n = 10; 5 years: stable, n = 9; CAD, n = 6). Comparison between healthy individuals and recipients with stable graft function at 0·5 year after transplantation was performed using Student’s t-test; comparison between recipients with stable graft function at different time-points after transplantation was carried out using one-way analysis of variance. *P < 0·05.
Changes in number and composition of circulating B cells in transplant recipients
To evaluate if there were measurable changes in the peripheral blood B-cell compartment, we evaluated the number of B cells and their differentiation state at different time-points after transplantation. Both percentage and absolute number of B cells were lower than in healthy individuals in stable graft recipients at 6 months after transplantation persisting at 2 and 5 years after transplantation (Fig. 5b). Compared with healthy individuals, stable graft recipients had a more differentiated B-cell pool, as shown by a lower percentage of naive CD27− IgD+ B cells at 2 and 5 years after transplantation, and a higher percentage of both non-switched CD27+ IgD+ and switched CD27+ IgD− memory B cells (Fig. 5a,c). No difference was found between the stable graft recipients and the patients with either subclinical or acute rejection at any time-point after transplantation (not shown).
Figure 5.
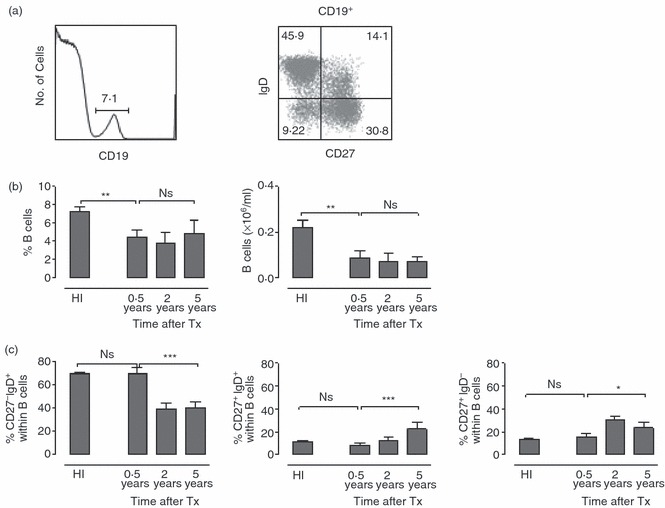
The absolute number of circulating B cells is decreased after transplantation and the B-cell pool becomes more differentiated. (a) FACS plots show B-cell gating based on CD19 expression (left) and subsequent differentiation analysis (right). Based on CD27 and IgD expression, subsets are defined as: naive cells (CD27− IgD+), non-switched memory B cells (CD27+ IgD+) and switched memory B cells (CD27+ IgD−). (b) Bar diagrams show the percentage (left) and absolute number (right) of CD19+ B cells in healthy individuals (HI), recipients with stable graft function (stable) at 0·5, 2 and 5 years after transplantation. (c) Bar diagrams show the percentage of naive B cells (left), non-switched memory B cells (middle) and switched memory B cells (right) in healthy individuals and in transplant recipients at different time-points after transplantation. Healthy individuals (n = 15); recipients with stable graft function 0·5 year (n = 10), 2 years (n = 10) and 5 years (n = 9) after transplantation. Bars represent the mean; error bars depict SEM. Comparison between healthy individuals and recipients with a stable graft function at 0·5 year after transplantation was performed using Student’s t-test; comparison between recipients with stable graft function at different post-transplant time-points was performed using one-way analysis of variance. *0·01 < P < 0·05; **0·001 < P < 0·01; ***P < 0·001.
Discussion
An important obstacle in the improvement of long-term graft survival after kidney transplantation is the development of chronic allograft dysfunction. Using serial protocol biopsies it has been shown that clinical and subclinical acute rejection can precede the progression to chronic rejection and deteriorating graft function.17 With the possibility of detecting functional different lymphocyte subsets by phenotypical characterization, we questioned whether different degrees of alloreactivity are reflected by changes in circulating lymphocyte subsets. The finding of sensitive and specific lymphocyte subset marker(s) detecting the degree of alloreactivity would provide us with a non-invasive tool to diagnose (sub)clinical rejection episodes.
We found that absolute numbers of circulating T and B cells after transplantation were lower than in healthy individuals. The higher percentage of effector CD8+ T cells after transplantation may be attributed to latent CMV infection and to immune suppression, as was reported previously.18 Remarkably, the percentage and absolute number of effector CD8+ T cells dropped dramatically in recipients with chronic allograft dysfunction at 5 years after transplantation. These effector cells are well equipped for migration toward inflammatory sites by expression of the chemokine-receptors CX3CR1 and CXCR3.19,20 The chemokines that bind to these receptors are expressed within the graft during rejection and may play a role in the attraction of T cells.21–23 The prolonged ongoing inflammation during chronic allograft dysfunction could promote the egress of effector cells to activated endothelium.
Low CD127 expression on CD25+ CD4+ T lymphocytes correlates with Foxp3 expression and suppressor function of regulatory CD4+ T cells.24 In contrast, high CD127 expression is found on activated CD25+ CD4+ T cells.25 Using combined staining of human CD4+ T cells for the expression of CD25 and CD127, we studied the percentages of regulatory CD4+ T cells and activated CD4+ T cells in different clinical situations after renal transplantation. The percentage of regulatory CD127low CD45RO+ Foxp3+ CD4+ T cells in patients with stable graft function was decreased at 0·5 and 2 years after renal transplantation in comparison to healthy individuals. However, despite continuation of immunosuppressive drug medication, they increased in time approaching similar values to those in healthy individuals at 5 years after transplantation. In contrast, in case of chronic allograft dysfunction, they dropped again. This is in agreement with data from Braudeau et al.,26,27 showing reduced numbers of circulating CD4+ CD25high Foxp3+ regulatory T cells in chronically rejecting patients compared with patients with stable graft function. Reduced percentages of circulating CD25+ CD127low CD4+ T cells were also found in stable heart transplant recipients at 2 years after transplantation.28 This might reflect a sequestration of these cells in the allograft. Indeed, in a murine kidney allograft model, a higher and sustained level of Foxp3+ regulatory T cells has been demonstrated in tolerated compared with rejecting allografts. However, the presence of Foxp3+ regulatory T cells in human renal allografts was less clearly associated with stable function.29,30 Hence, the clinical significance of changes in percentages of circulating CD4+ regulatory T cells after transplantation is not yet clear.
In contrast to data in the literature9,10,31 we did not find higher percentages of activated, CD127+ CD45RO+ cells in patients with stable graft function than in healthy individuals. Furthermore, the composition of the CD25+ CD4+ T-cell subset in patients with subclinical or acute rejection was similar to that in patients with stable graft function. We could also not confirm that patients with chronic allograft dysfunction would have a higher percentage of activated CD127+ CD45RO+ cells within their CD25+ CD4+ T-cell subset than either patients with stable graft function or healthy individuals. The discrepancy in these results might be explained by the fact that we excluded humoral rejection, whereas Codarri et al. found the most impressive increase in activated CD127+ CD45RO+ T cells in patients with chronic humoral rejection.9,10 Another explanation could be that the changes in these activated CD25+ CD4+ T-cell populations are caused by other factors. The composition of the CD25+ CD4+ T-cell pool appears to be influenced also by hepatitis C infection after liver transplantation.32 In our patients, we did not find a relationship between viral infections, caused by CMV or Epstein–Barr virus, and changes in the composition of the CD25+ CD4+ T-cell pool (data not shown). Finally, differences in (cumulative dosages of) immunosuppressive therapy may influence results from this type of studies.33 Mammalian target of rapamycin-inhibitors are shown to selectively spare CD4+ regulatory T cells both in vitro and in vivo.34–36 Also, the calcineurin-inhibitors cyclosporine and tacrolimus may exert different effects on regulatory T-cell numbers.37
Regardless of clinical events, all renal transplant recipients showed decreased total B-cell counts, which has also been found by others.38,39 The decrease appeared largely attributable to a decrease in naive B cells. In contrast, percentages of memory B cells showed a slight increase in time after transplantation. Hence, compared with healthy individuals, graft recipients irrespective of their clinical course, had a more differentiated circulating B-cell pool than healthy individuals. Whether this is a result of the maintenance immunosuppressive drug therapy or of the presence of the allograft, or of other factors, such as persistent viral infections, remains to be determined.
In conclusion, we have shown a severe drop of effector CD8+ T cells in recipients with chronic allograft dysfunction at 5 years after transplantation. In contrast to recent data in the literature,9,30 we could not detect any change in the percentage of activated CD127+ CD45RO+ cells in patients at any time or condition after renal transplantation, making analysis of these cells not suitable for the detection of any type of allograft rejection.
Acknowledgments
This study was financially supported by a Grant of the Dutch Kidney Foundation (grant C05.2141) and by a Grant from the RISET Consortium (Sixth Framework Programme of the European commission, http://www.risetfp6.org).
Disclosures
All authors declared no competing interests.
References
- 1.Lamb KE, Lodhi S, Meier-Kriesche HU. Long-term renal allograft survival in the United States: a critical reappraisal. Am J Transplant. 2011;11:450–62. doi: 10.1111/j.1600-6143.2010.03283.x. [DOI] [PubMed] [Google Scholar]
- 2.Segev DL. Renal allograft survival: getting better all the time. Am J Transplant. 2011;11:422–3. doi: 10.1111/j.1600-6143.2010.03409.x. [DOI] [PubMed] [Google Scholar]
- 3.Brouard S, Renaudin K, Soulillou JP. Revisiting the natural history of IF/TA in renal transplantation. Am J Transplant. 2011;11:647–9. doi: 10.1111/j.1600-6143.2011.03456.x. [DOI] [PubMed] [Google Scholar]
- 4.Shapiro R. End-stage renal disease in 2010: innovative approaches to improve outcomes in transplantation. Nat Rev Nephrol. 2011;7:68–70. doi: 10.1038/nrneph.2010.179. [DOI] [PubMed] [Google Scholar]
- 5.Bromberg JS, Heeger PS, Li XC. Evolving paradigms that determine the fate of an allograft. Am J Transplant. 2010;10:1143–8. doi: 10.1111/j.1600-6143.2010.03033.x. [DOI] [PMC free article] [PubMed] [Google Scholar]
- 6.Sawitzki B, Pascher A, Babel N, Reinke P, Volk HD. Can we use biomarkers and functional assays to implement personalized therapies in transplantation? Transplantation. 2009;87:1595–601. doi: 10.1097/TP.0b013e3181a6b2cf. [DOI] [PubMed] [Google Scholar]
- 7.Moreso F, Seron D, O’Valle F, et al. Immunephenotype of glomerular and interstitial infiltrating cells in protocol renal allograft biopsies and histological diagnosis. Am J Transplant. 2007;7:2739–47. doi: 10.1111/j.1600-6143.2007.02013.x. [DOI] [PubMed] [Google Scholar]
- 8.Scherer A, Gwinner W, Mengel M, et al. Transcriptome changes in renal allograft protocol biopsies at 3 months precede the onset of interstitial fibrosis/tubular atrophy (IF/TA) at 6 months. Nephrol Dial Transplant. 2009;24:2567–75. doi: 10.1093/ndt/gfp183. [DOI] [PubMed] [Google Scholar]
- 9.Codarri L, Vallotton L, Ciuffreda D, et al. Expansion and tissue infiltration of an allospecific CD4+ CD25+ CD45RO+ IL-7Rαhigh cell population in solid organ transplant recipients. J Exp Med. 2007;204:1533–41. doi: 10.1084/jem.20062120. [DOI] [PMC free article] [PubMed] [Google Scholar]
- 10.Vallotton L, Hadaya K, Venetz JP, et al. Monitoring of CD4+ CD25high IL-7Rαhigh activated T cells in kidney transplant recipients. Clin J Am Soc Nephrol. 2011;6:2025–33. doi: 10.2215/CJN.09611010. [DOI] [PMC free article] [PubMed] [Google Scholar]
- 11.van de Berg PJ, van Leeuwen EM, ten Berge IJ, van Lier RA. Cytotoxic human CD4+ T cells. Curr Opin Immunol. 2008;20:339–43. doi: 10.1016/j.coi.2008.03.007. [DOI] [PubMed] [Google Scholar]
- 12.Van de Berg PJ, van Stijn A, ten Berge IJ, van Lier RA. A fingerprint left by cytomegalovirus infection in the human T cell compartment. J Clin Virol. 2008;41:213–7. doi: 10.1016/j.jcv.2007.10.016. [DOI] [PubMed] [Google Scholar]
- 13.van Lier RA, ten Berge I, Gamadia LE. Human CD8+ T-cell differentiation in response to viruses. Nat Rev Immunol. 2003;3:931–9. doi: 10.1038/nri1254. [DOI] [PubMed] [Google Scholar]
- 14.Reinke P, Fietze E, Ode-Hakim S, Prösch S, Lippert J, Ewert R, Volk HD. Late-acute renal allograft rejection and symptomless cytomegalovirus infection. Lancet. 1994;344:1737–8. doi: 10.1016/s0140-6736(94)92887-8. [DOI] [PubMed] [Google Scholar]
- 15.van Leeuwen EM, Koning JJ, Remmerswaal EB, van BD, van Lier RA, ten Berge IJ. Differential usage of cellular niches by cytomegalovirus versus EBV- and influenza virus-specific CD8+ T cells. J Immunol. 2006;177:4998–5005. doi: 10.4049/jimmunol.177.8.4998. [DOI] [PubMed] [Google Scholar]
- 16.van Leeuwen EM, Remmerswaal EB, Vossen MT, Rowshani AT, Wertheim-van Dillen PM, van Lier RA, ten Berge IJ. Emergence of a CD4+ CD28– granzyme B+, cytomegalovirus-specific T cell subset after recovery of primary cytomegalovirus infection. J Immunol. 2004;173:134–41. doi: 10.4049/jimmunol.173.3.1834. [DOI] [PubMed] [Google Scholar]
- 17.Nankivell BJ, Borrows RJ, Fung CL, O’Connell PJ, Allen RD, Chapman JR. Natural history, risk factors, and impact of subclinical rejection in kidney transplantation. Transplantation. 2004;78:242–9. doi: 10.1097/01.tp.0000128167.60172.cc. [DOI] [PubMed] [Google Scholar]
- 18.Gamadia LE, Rentenaar RJ, Baars PA, et al. Differentiation of cytomegalovirus-specific CD8+ T cells in healthy and immunosuppressed virus carriers. Blood. 2001;98:754–61. doi: 10.1182/blood.v98.3.754. [DOI] [PubMed] [Google Scholar]
- 19.Sallusto F, Lenig D, Mackay CR, Lanzavecchia A. Flexible programs of chemokine receptor expression on human polarized T helper 1 and 2 lymphocytes. J Exp Med. 1998;187:875–83. doi: 10.1084/jem.187.6.875. [DOI] [PMC free article] [PubMed] [Google Scholar]
- 20.Hertoghs KM, Moerland PD, van Stijn A, et al. Molecular profiling of cytomegalovirus-induced human CD8+ T cell differentiation. J Clin Invest. 2010;120:4077–90. doi: 10.1172/JCI42758. [DOI] [PMC free article] [PubMed] [Google Scholar]
- 21.Durkan AM, Alexander RT, Liu GY, Rui M, Femia G, Robinson LA. Expression and targeting of CX3CL1 (fractalkine) in renal tubular epithelial cells. J Am Soc Nephrol. 2007;18:74–83. doi: 10.1681/ASN.2006080862. [DOI] [PubMed] [Google Scholar]
- 22.Matz M, Beyer J, Wunsch D, et al. Early post-transplant urinary IP-10 expression after kidney transplantation is predictive of short- and long-term graft function. Kidney Int. 2006;69:1683–90. doi: 10.1038/sj.ki.5000343. [DOI] [PubMed] [Google Scholar]
- 23.Peng W, Chen J, Jiang Y, et al. Urinary fractalkine is a marker of acute rejection. Kidney Int. 2008;74:1454–60. doi: 10.1038/ki.2008.459. [DOI] [PubMed] [Google Scholar]
- 24.Liu W, Putnam AL, Xu-Yu Z, et al. CD127 expression inversely correlates with FoxP3 and suppressive function of human CD4+ T reg cells. J Exp Med. 2006;203:1701–11. doi: 10.1084/jem.20060772. [DOI] [PMC free article] [PubMed] [Google Scholar]
- 25.Seddiki N, Santner-Nanan B, Martinson J, et al. Expression of interleukin (IL)-2 and IL-7 receptors discriminates between human regulatory and activated T cells. J Exp Med. 2006;203:1693–700. doi: 10.1084/jem.20060468. [DOI] [PMC free article] [PubMed] [Google Scholar]
- 26.Braudeau C, Racape M, Giral M, et al. Variation in numbers of CD4+ CD25high FOXP3+ T cells with normal immuno-regulatory properties in long-term graft outcome. Transpl Int. 2007;20:845–55. doi: 10.1111/j.1432-2277.2007.00537.x. [DOI] [PubMed] [Google Scholar]
- 27.Louis S, Braudeau C, Giral M, et al. Contrasting CD25hi CD4+ T cells/FOXP3 patterns in chronic rejection and operational drug-free tolerance. Transplantation. 2006;81:398–407. doi: 10.1097/01.tp.0000203166.44968.86. [DOI] [PubMed] [Google Scholar]
- 28.Chen M, Mohtize M, Matteï MF, Villemot JP, Kohler C, Faure GC, Béné MC, de Carvalho Bittencourt M. Reduced levels of both circulating CD4+ CD25+ CD127low/neg and CD4+ CD8neg invariant natural killer regulatory T cells in stable heart transplant recipients. Clin Exp Immunol. 2011;163:104–12. doi: 10.1111/j.1365-2249.2010.04281.x. [DOI] [PMC free article] [PubMed] [Google Scholar]
- 29.Veronese F, Rotman S, Smith RN, Pelle TD, Farrell ML, Kawai T, Benedict Cosimi A, Colvin RB. Pathological and clinical correlates of FOXP3+ cells in renal allografts during acute rejection. Am J Transplant. 2007;7:914–22. doi: 10.1111/j.1600-6143.2006.01704.x. [DOI] [PubMed] [Google Scholar]
- 30.Yapici U, Bemelman FJ, Scheepstra CG, et al. Intragraft FOXP3 protein or mRNA during acute renal allograft rejection correlates with inflammation, fibrosis, and poor renal outcome. Transplantation. 2009;87:1377–80. doi: 10.1097/TP.0b013e3181a24a4b. [DOI] [PubMed] [Google Scholar]
- 31.Alonso-Arias R, Suarez-Alvarez B, Lopez-Vazquez A, et al. CD127low expression in CD4+ CD25high T cells as immune biomarker of renal function in transplant patients. Transplantation. 2009;88(3 Suppl):S85–93. doi: 10.1097/TP.0b013e3181afebdb. [DOI] [PubMed] [Google Scholar]
- 32.Ciuffreda D, Codarri L, Buhler L, et al. Hepatitis C virus infection after liver transplantation is associated with lower levels of activated CD4+ CD25+ CD45RO+ IL-7rαhigh T cells. Liver Transpl. 2010;16:49–55. doi: 10.1002/lt.21959. [DOI] [PubMed] [Google Scholar]
- 33.Fourtounas C, Dousdampanis P, Sakellaraki P, Rodi M, Georgakopoulos T, Vlachojannis JG, Mouzaki A. Different immunosuppressive combinations on T-cell regulation in renal transplant recipients. Am J Nephrol. 2010;32:1–9. doi: 10.1159/000313940. [DOI] [PubMed] [Google Scholar]
- 34.Nikolaeva N, Bemelman FJ, Yong SL, van Lier RA, ten Berge IJ. Rapamycin does not induce anergy but inhibits expansion and differentiation of alloreactive human T cells. Transplantation. 2006;81:445–54. doi: 10.1097/01.tp.0000194860.21533.b9. [DOI] [PubMed] [Google Scholar]
- 35.Segundo DS, Ruiz JC, Izquierdo M, et al. Calcineurin inhibitors, but not rapamycin, reduce percentages of CD4+ CD25+ FOXP3+ regulatory T cells in renal transplant recipients. Transplantation. 2006;82:550–7. doi: 10.1097/01.tp.0000229473.95202.50. [DOI] [PubMed] [Google Scholar]
- 36.Hester J, Mills N, Shankar S, Carvalho-Gaspar M, Friend P, Wood KJ. Th17 cells in alemtuzumab-treated patients: the effect of long-term maintenance immunosuppressive therapy. Transplantation. 2011;91:744–50. doi: 10.1097/TP.0b013e31820c85dc. [DOI] [PMC free article] [PubMed] [Google Scholar]
- 37.Tsaur I, Gasser M, Aviles B, et al. Donor antigen-specific regulatory T-cell function affects outcome in kidney transplant recipients. Kidney Int. 2011;79:1005–12. doi: 10.1038/ki.2010.533. [DOI] [PubMed] [Google Scholar]
- 38.Daniel V, Naujokat C, Sadeghi M, Renner FC, Weimer R, Opelz G. Association of high IFN-γ plasma levels with low B-cell counts in renal transplant recipients with stable long-term graft function. Clin Transplant. 2010;24:281–9. doi: 10.1111/j.1399-0012.2009.01067.x. [DOI] [PubMed] [Google Scholar]
- 39.Struijk GH, Minnee RC, Koch SD, Zwinderman AH, van Donselaar-van der Pant KA, Idu MM, ten Berge IJ, Bemelman FJ. Maintenance immunosuppressive therapy with everolimus preserves humoral immune responses. Kidney Int. 2010;78:934–40. doi: 10.1038/ki.2010.269. [DOI] [PubMed] [Google Scholar]