Abstract
Enamel is the most highly mineralized and durable tissue of the mammalian body. As enamel does not undergo remodeling or repair, disturbances of enamel formation leave a permanent record in the tissue that can be used for life history reconstruction. This study reports light and scanning electron microscope findings on hypoplastic enamel defects, and on the chronology of crown growth in the molars of sheep and goats. A marked reduction of enamel extension rates in cervical compared with more cuspal crown portions of sheep and goat molars was recorded, with formation of the cervical 25% of the crown taking about the same time as that of the upper 75% of the crown. This explains the more frequent occurrence of enamel hypoplasia in cervical compared with upper and middle crown portions. Regarding the identification of hypoplastic enamel defects by external inspection, our results suggest a dependence on the type of defect and the associated presence of smaller or larger amounts of coronal cementum. Defects considered to reflect a slight to moderate impairment of secretory ameloblast function can normally be correctly diagnosed as they are not occluded by thick layers of cementum. In contrast, defects denoting a severe impairment of enamel matrix secretion can typically not be correctly identified because they are occluded by large amounts of cementum, so that neither depth nor extension of the defects can be assessed on external inspection. In these cases, microscopic analysis of tooth sections is required for a correct diagnosis of the hypoplastic enamel defects.
Keywords: coronal cementum, crown formation, dental enamel, enamel extension rate, hypoplastic defects
Introduction
Teeth are the most durable structures of the mammalian body, and therefore frequently found at archaeological and fossil sites. Because mature enamel is very highly mineralized, it is normally the best preserved of the dental hard tissues. Enamel does not undergo remodeling or repair, and therefore any major disturbance affecting its formation leaves a permanent record in the tissue (Hillson, 2005). Enamel hypoplasia is a developmental defect that is caused by a disturbance of enamel matrix formation and presents as a deficiency in the thickness of the enamel (Zsigmondy, 1893; Goodman & Rose, 1990; Moggi-Cecchi & Crovella, 1991; Hillson, 1996, 2005; Kierdorf & Kierdorf, 1997; Guatelli-Steinberg, 2000, 2003; Witzel et al. 2008). Enamel hypoplasia is widely considered a good indicator of systemic stress during the period of tooth crown formation, and has been used in numerous studies to retrospectively assess the occurrence of stress episodes during dental development in primates (Goodman & Rose, 1990; Moggi-Cecchi & Crovella, 1991; Hillson, 1996, 2005; Guatelli-Steinberg, 2000, 2003; Skinner & Hopwood, 2004; King et al. 2005; Schwartz et al. 2006; Witzel et al. 2008), as well as in other mammals possessing low-crowned cheek teeth, such as pigs (Dobney & Ervynck, 2000; Dobney et al. 2004; Witzel et al. 2006) and giraffes (Franz-Odendaal, 2004). More recently, the study of enamel hypoplasia as a stress marker has been extended to mammals with high-crowned cheek teeth, such as American bison (Niven et al. 2004) and domestic sheep and goats (Upex, 2010). Studying enamel hypoplasia in the cheek teeth of these species, however, poses problems not encountered in species with low-crowned cheek teeth (Kierdorf et al. 2006). A major difficulty is the presence of cementum that covers the enamel surface of the high-crowned bovid teeth. Formation of this coronal cementum occurs subsequent to a pre-eruptive disintegration of the reduced enamel epithelium, thereby enabling contact of dental follicle cells with the enamel surface (Mills & Irving, 1967; Ainamo, 1970). The main function of the coronal cementum is to provide the high-crowned teeth with a firm anchorage (in addition to that by the late developing, short root) through fibrous attachment of a substantial area of its anatomical crown to the alveolar bone and the gingiva (Weinreb & Sharav, 1964; Ainamo, 1970). As has been shown for cheek teeth of cattle, the presence of coronal cementum can hamper or even prevent the recording of hypoplastic defects in enamel by external inspection (Kierdorf et al. 2006).
In some studies, the location of hypoplastic enamel defects along the vertical axis of the tooth crown was used to reconstruct the timing of stress episodes in relation to dental development (Dobney & Ervynck, 2000; Dobney et al. 2004; Franz-Odendaal, 2004; Niven et al. 2004). These authors divided the tooth crown into vertical stretches of equal length, considered to reflect equal fractions of the crown formation period. This would, however, only be the case if enamel extension rate, that is, the rate at which newly differentiated ameloblasts at the cervical loop of the enamel organ enter into the secretory stage (Simmer et al. 2010), remained constant over the entire crown formation period. Contrary to this assumption, in many species a considerable reduction of enamel extension rate in the more cervical crown portions has been observed (Shellis, 1984, 1998; Reid & Ferrell, 2006; Smith, 2008; Birch & Dean, 2009; Dean, 2009). Enamel extension rates in high-crowned cheek teeth of bovid species have as yet not been established, except for a study by Jordana & Köhler (2011) that reported a reduction in enamel extension rate in the cervical crown portions of mandibular molars of domestic sheep and of the cave goat Myotragus balearicus, an extinct dwarf bovid from the Balearic islands (Spain). It seems highly likely that the same is also the case in cheek teeth of other bovid species.
Various studies have demonstrated that light microscopic and scanning electron microscopic inspection of tooth sections enables a detailed reconstruction of the pattern of crown formation (Shellis, 1984, 1998; Reid & Dean, 2006; Reid & Ferrell, 2006; Smith, 2006, 2008; Antoine et al. 2009; Birch & Dean, 2009; Simmer et al. 2010) and a precise analysis of the timing and intensity of stress episodes causing enamel hypoplasia (Schwartz et al. 2002, 2006; Witzel et al. 2006, 2008). In the present study we applied this approach to the analysis of enamel hypoplasia in sheep and goat molars. The aims of the study were: first, to analyze abnormalities in enamel structure associated with the occurrence of enamel hypoplasia; second, to check if a reliable recording of hypoplastic enamel defects is possible in sheep and goat teeth based on external inspection of the teeth; and third, to provide preliminary data on the chronology of crown formation for these teeth by recording incremental markings in their enamel.
Materials and methods
Specimens
The study was conducted on 11 mandibular molars (six M1s, four M2s and one M3) exhibiting enamel hypoplasia that originated from eight animals. Three of the individuals were sheep of the North Ronaldsay (Orkney islands) breed, one was a Soay sheep. The other teeth, which had been collected during a field study in Kenya, belonged to a sheep of unknown breed, two goats and one individual whose species assignment (either sheep or goat) was questionable. All teeth exhibited wear and, in consequence, the cuspal enamel, which is limited to the very tips of the tooth crown in sheep and goat molars, and a varying portion of the lateral enamel were missing. The age of the individuals was assessed using the age categories of Payne (1973), and ranged from category C (6–12 months) to category F (3–4 years).
Macroscopic recording of enamel hypoplasia
Teeth were inspected macroscopically by one of the authors (BU) under a strong oblique light that allows enamel hypoplasia to be seen more clearly than with standard illumination (Fig. 1). On external inspection, hypoplastic defects were classified based on the descriptions given by Dobney & Ervynck (1998). Photographs of the teeth were taken with a Canon EOS 300 D camera.
Fig. 1.
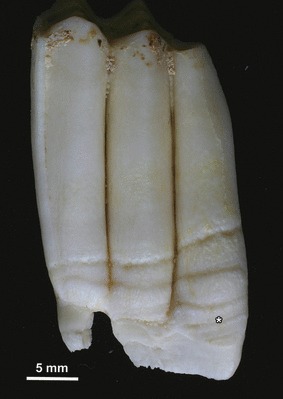
Left M3 of a sheep of the North Ronaldsay breed. Several hypoplastic defects are located in the cervical enamel. Asterisk marks the defect area shown in Fig. 5. Buccal view.
Microscopic examination of sectioned teeth
For preparation of sections, teeth were embedded in epoxy resin (Biodur E12/E1; Biodur Products, Heidelberg, Germany). After hardening of the resin the embedded teeth were sectioned axiobuccolingually. In the case of first and second molars, two sections per specimen, one running through the highest point of the anterior (mesial) lobe and the other through the highest point of the posterior (distal) lobe, were produced using a rotary saw with a water-cooled diamond-coated blade (Woco 50; Conrad Apparatebau, Clausthal Zellerfeld, Germany). In the case of the third molar, three sections running through, respectively, the highest points of the anterior, middle and posterior lobes were produced.
For backscattered electron (BSE) imaging in the scanning electron microscope, the cut surfaces of the blocks were polished on a motorized rotor polisher (Labopol-5; Struers, Copenhagen, Denmark) using diamond suspensions (Diapro; Struers) with 9 and 3 μm particle diameters, respectively, and a final polishing step with a colloidal silica suspension (OP-S; Struers). BSE imaging of the (uncoated) sections was performed with an FEI Quanta 600 FEG ESEM that uses high-resolution Schottky field emission and was operated in a low-vacuum mode at an accelerating voltage of 20 kV. Beam stability was high with a fluctuation of ≤ 1% per day. As we did not use standards for calibration, gray-level differences in the images must be considered a qualitative measure of variation in mineral content of the analyzed dental hard tissues.
For light microscopy, tooth blocks were mounted with their polished sides down on glass slides using Biodur epoxy resin as glue. The mounted blocks were then sectioned to a thickness of about 300 μm, ground and polished to a final thickness of about 50 μm, and coverslipped. The sections were viewed and photographed in transmitted light using either an Axioskop 2 Plus microscope (Zeiss, Jena, Germany) equipped with a digital camera or a Biozero 8000 digital microscope (Keyence, Osaka, Japan).
On the basis of the microscopic examination it was possible to distinguish between four types of hypoplastic enamel defects, namely, furrow-type, pit-type, depression-type and plane-type defects. The characteristics of the four different defect types as well as their relationship to the duration and intensity of stress episodes have been discussed by Hillson & Bond (1997) and Witzel et al. (2006, 2008) for human and pig teeth.
Recording of enamel extension rate
Microscopic sections through the buccal enamel of a sheep M3 and a goat M1 were chosen to record enamel extension rates. Specimens were selected because they exhibited clearly recognizable incremental lines in their enamel that were oriented in parallel and ran at a steep angle from the enamel–dentin junction (EDJ) to the enamel surface (Fig. 2). Some of the incremental lines were markedly accentuated and could be traced from the EDJ to the enamel surface. These markedly accentuated lines were used as landmark lines that could be matched between tooth sides and the different lobes of a tooth. Eleven landmark lines were present in the buccal enamel of the studied goat M1, while in the sheep M3 six such lines were observed in buccal enamel. The distance between successive landmark lines was not constant, but varied considerably (Fig. 2). Thus, the landmark lines did not constitute regular incremental markings and did not exhibit a constant repeat interval; instead they represented irregular incremental markings caused by a perturbation of the normal activity of secretory ameloblasts during episodes of systemic stress (Hillson, 1996, 2005; Witzel et al. 2008). Such markedly accentuated incremental lines are also known as Wilson bands (Rose, 1977; Hillson, 1996, 2005).
Fig. 2.
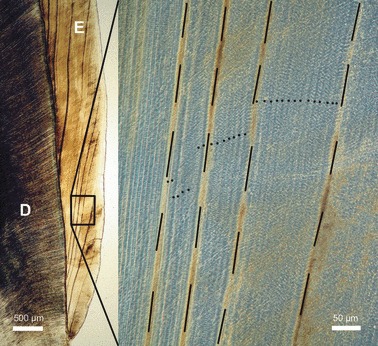
Transmitted light microscope images of incremental markings in buccal enamel (E) of a goat M2. Higher magnification image (right frame) viewed with phase contrast. Accentuated incremental lines (Wilson bands, dashed lines) that were used as landmark lines exhibit a variable spacing. Regular (daily) incremental lines (laminations) are indicated by dots. D, dentin. Cuspal direction to top of images.
The regular incremental lines observed between the landmark lines (Fig. 2) matched the descriptions of daily incremental lines previously reported in the enamel of different ungulate species (Iinuma et al. 2004; Tafforeau et al. 2007; Jordana & Köhler, 2011). These daily incremental lines, which have been referred to as laminations by Tafforeau et al. (2007), denote successive (daily) positions of the enamel-forming front during the secretory stage of amelogenesis.
In order to assess the formative periods of certain crown portions we counted the number of regular (daily) increments between successive landmark lines (Fig. 2). In addition, the numbers of regular increments between the most cuspally located landmark line and the occlusal enamel tip and between the last-formed (most cervically located) landmark line and the cervical enamel border were counted. In this way, the total number of daily increments present in the respective section plane of the buccal enamel was recorded in the two teeth.
In addition, the distance between successive landmark lines was measured along the EDJ and related to the number of daily increments present between these landmark lines. By applying this procedure to the entire buccal enamel, relative rates of enamel extension along the EDJ were established for the buccal enamel of both teeth. Results were plotted as the cumulative percentage of the number of total daily increments against the cumulative percentage of the total crown extension measured along the EDJ. Both teeth were already worn to some extent so that the cuspal enamel and a not exactly definable portion of the lateral enamel were no longer present, and it was therefore not possible to record enamel extension rates for the entire crown formation period.
Recording of enamel apposition rate
Daily enamel apposition rates were recorded in the goat M1 by measuring the distance along the prism course between consecutive landmark lines in the inner (near the EDJ), the central and the outer (near the surface) enamel, and dividing this value by the number of daily increments between them. Measurements were taken in the upper half of the crown as well as in lower lateral (25–50% of crown height) and in cervical (5–25% of crown height) enamel.
Results
Our study revealed considerable variation of enamel extension rates along the crown in the two studied teeth (Tables 1 and 2; Fig. 3). Thus, in both teeth, about half the number of daily increments recorded at the EDJ was present in approximately the upper three-quarters of the crown, while the other half was present in the cervical quarter of the crown.
Table 1.
Number of incremental markings and enamel extension rate at the EDJ in the buccal enamel of the posterior lobe of a goat M1.
| Landmarks | Distance to cervical enamel border measured along EDJ (μm) | Distance to cervically adjacent landmark line at EDJ (μm) | Increments between this and the preceding landmark | Cumulative increment count | Length of landmark line/secretory front (μm) | % of total increment number (cumulative count) | % of total crown height at EDJ (cumulative count) |
|---|---|---|---|---|---|---|---|
| Occlusal enamel tip | 20473.9 | 7013.1 | 0 | 0 | 0 | 0 | 0 |
| Line 1 | 13460.8 | 1907.9 | 46 | 46 | 7366.3 | 15.0 | 34.3 |
| Line 2 | 11552.9 | 3636.5 | 24 | 70 | 6254.1 | 22.8 | 43.6 |
| Line 3 | 7916.4 | 1987.4 | 34 | 104 | 6683.1 | 33.9 | 61.3 |
| Line 4 | 5929.0 | 1060.8 | 25 | 129 | 5525.1 | 42.0 | 71.0 |
| Line 5 | 4868.2 | 904.2 | 20 | 149 | 5273.7 | 48.5 | 76.2 |
| Line 6 | 3964.0 | 1235.4 | 16 | 165 | 5229.9 | 53.8 | 80.6 |
| Line 7 | 2728.6 | 1488.7 | 25 | 190 | 4850.7 | 61.9 | 86.7 |
| Line 8 | 1240.0 | 510.1 | 40 | 230 | 4112.8 | 74.9 | 93.9 |
| Line 9 | 729.8 | 351.6 | 16 | 246 | 3524.1 | 80.1 | 96.4 |
| Line 10 | 378.3 | 317.1 | 15 | 261 | 2883.8 | 85.0 | 98.2 |
| Line 11 | 61.2 | 61.2 | 20 | 281 | 2152.4 | 91.5 | 99.7 |
| Cervical enamel border | 0 | 0 | 26 | 307 | 0 | 100 | 100 |
Line = accentuated incremental (landmark) line.
EDJ, enamel–dentin junction.
Table 2.
Number of incremental markings and enamel extension rate at the EDJ in the buccal enamel of the posterior lobe of a sheep M3.
| Landmarks | Distance to cervical enamel border measured along EDJ (μm) | Distance to cervically adjacent landmark line at EDJ (μm) | Increments between this and the preceding landmark | Cumulative increment count | Length of landmark line/secretory front (μm) | % of total increment number (cumulative count) | % of total crown height at EDJ (cumulative count) |
|---|---|---|---|---|---|---|---|
| Occlusal enamel tip | 29095.6 | 14219.0 | 0 | 0 | 0 | 0 | 0 |
| Line 1 | 14876.6 | 6507.4 | 130 | 130 | 3764.5 | 28.5 | 48.9 |
| Line 2 | 8369.2 | 3111.8 | 84 | 214 | 3252.2 | 46.8 | 71.2 |
| Line 3 | 5257.4 | 2092.4 | 67 | 281 | 2015.0 | 61.5 | 81.9 |
| Line 4 | 3165.0 | 1280.0 | 53 | 334 | 1926.0 | 73.1 | 89.1 |
| Line 5 | 1885.0 | 1431.1 | 51 | 385 | 1002.6 | 84.3 | 93.5 |
| Line 6 | 453.9 | 453.9 | 54 | 439 | 837.5 | 96.1 | 98.4 |
| Cervical enamel border | 0 | 0 | 18 | 457 | 0 | 100 | 100 |
Line = accentuated incremental (landmark) line.
EDJ, enamel–dentin junction.
Fig. 3.
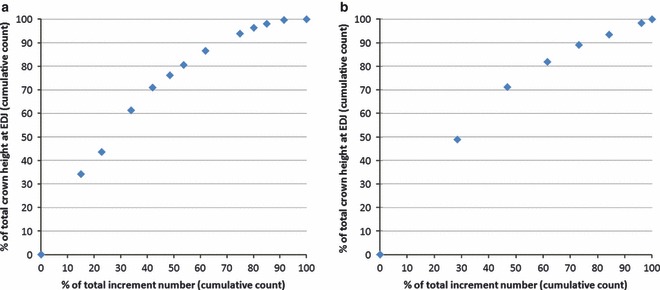
Enamel extension rates recorded in the buccal enamel of the posterior lobe of a goat M1 (a) and the buccal enamel of the posterior lobe of a sheep M3 (b).
In more cuspally located and in mid-coronal enamel, the incremental lines were steeply inclined, thus forming a very acute angle with the EDJ, while in more cervical enamel this angle was greater. In consequence, in more cuspally located enamel, the length of the incremental lines, i.e. their extension from the EDJ to the enamel surface, was much higher than in cervical enamel. The maximum length of an incremental line recorded was about 7370 μm. Our observations on enamel extension rates indicate that during the formation of the upper and middle crown portions, the wave of differentiation of new secretory ameloblasts rapidly spreads in the cervical direction, while this process is considerably slowed down during the formation of the more cervical crown portions.
At higher magnification, alternating light and dark bands were discernable along the prism course between successive laminations (Fig. 4). These bands, which were oriented nearly perpendicular to the prism long axis, were considered to represent intradian incremental markings, i.e., structures with a subdaily periodicity.
Fig. 4.
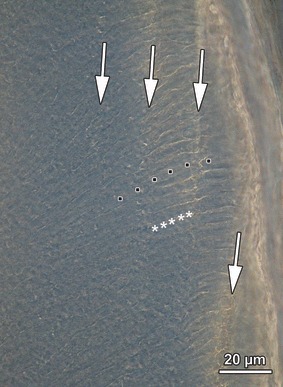
Incremental markings in buccal enamel of a Soay sheep M1. White arrows indicate daily incremental lines (laminations), asterisks indicate intradian markings along the prism course. The approximate prism course is indicated by the dotted line. Cuspal direction to top of image.
In the studied goat M1, the distance between consecutive laminations, reflecting daily enamel apposition rates, increased slightly from the inner over the central to the outer enamel (arithmetic means ± SDs of 10 measurements in each of the three regions at corresponding positions along the vertical tooth axis: inner enamel: 12.56 ± 4.16 μm; central enamel: 14.66 ± 2.34 μm; outer enamel: 15.45 ± 1.64 μm). No consistent variation in enamel apposition rate was recorded along the vertical crown axis for any of the three regions.
In all studied teeth, most of the enamel surface was covered by cementum. The thickness of this coronal cementum mostly varied between 20 and 30 μm (Fig. 5). The presence of such a relatively thin layer of cementum did not prevent the recording of enamel hypoplasia on external inspection (Fig. 1). In consequence, for crown areas covered by only thin layers of cementum the results of the macroscopic and microscopic inspections were largely identical with respect to the identification of hypoplastic enamel defects. Only in a few instances, furrow-type hypoplastic defects that had not been identified on external inspection were diagnosed microscopically.
Fig. 5.
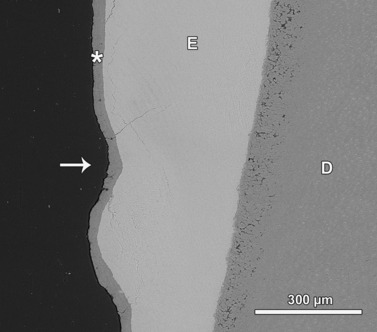
Thin cementum layer (asterisk) covering the buccal enamel (E) of the sheep M3 shown in Fig. 1. A hypoplastic enamel defect that was classified as furrow-type on external inspection of the tooth (asterisk in Fig. 1) is arrowed. D, dentin. BSE image. Cuspal direction to top of image.
A major diagnostic problem occurred, however, regarding the identification of hypoplastic enamel defects (typically deep pit-type and extended plane-type defects) that were largely or completely occluded by a thick layer of cementum. The cementum plug filling these defects could reach a thickness of up to several hundred microns. In more cuspal crown portions, this cementum was itself often overlain by dental calculus (Fig. 6). Microscopically, the calculus could easily be distinguished from cementum by its distinctly layered structure, its different color and the lack of cementocyte lacunae (Fig. 6). The presence of thick layers of cementum and often also calculus precluded the recording of the size and depth of severe hypoplastic enamel defects by external inspection. In consequence, none of the seven extended plane-type defects that were detected by microscopic inspection in the studied teeth had previously been correctly identified macroscopically. Instead, on external inspection all these defects had been diagnosed as examples of furrow-type enamel hypoplasia. This misclassification occurred due to the erroneous interpretation of the characteristic ledge forming the cervical border of a plane-type defect as representing a furrow-type hypoplasia (Fig. 7).
Fig. 6.
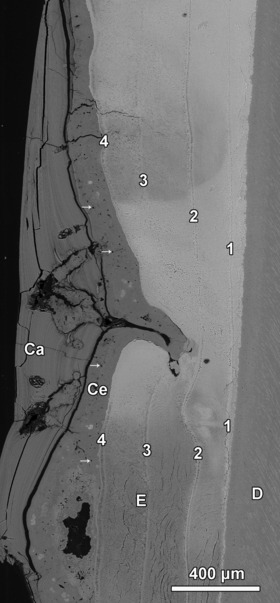
Compound enamel hypoplasia and associated structural aberrations in buccal enamel (E) of a goat M2. Four Wilson bands (1–4) are present in the enamel. The defect is completely occluded by cementum (Ce) and dental calculus (Ca). The cementum contains numerous cementocyte lacunae (arrows). The developmentally youngest Wilson band (4) constitutes the exposed incremental plane of the large defect. The second oldest Wilson band (2) forms the base of the deep pit-type defect. D, dentin. BSE image. Cuspal direction to top of image.
Fig. 7.
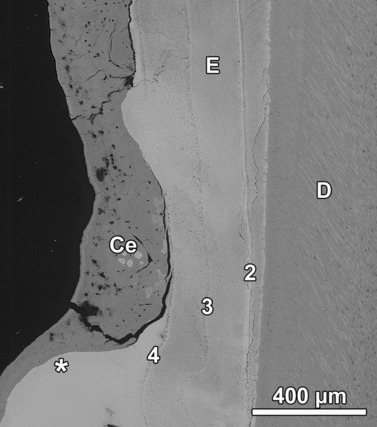
Cervical border of the plane-type defect shown in Fig. 6. The occurrence of the ledge (asterisk) that marks the transition from the defect area to the cervically adjacent area of normal enamel thickness had on macroscopic inspection led to the erroneous diagnosis of the defect as representing a furrow-type hypoplasia. Numbering of the Wilson bands corresponds to that in Fig. 6. Ce, cementum; D, dentin; E, enamel. BSE image. Cuspal direction to top of image.
Figure 6 shows a portion of a large plane-type defect that extends over a vertical distance of about 4500 μm in a goat M2 and the associated presence of a deep pit-type defect that reaches deeper into the enamel and must therefore have been formed earlier during crown growth. Four markedly accentuated incremental lines (Wilson bands) are visible in the enamel. The outermost and developmentally youngest Wilson band (no. 4 in Fig. 6) constitutes the exposed incremental plane that forms the base of the extended defect. The second oldest Wilson band (no. 2 in Fig. 6) forms the base of the deep pit-type defect. The morphological findings suggest that repeated stress episodes had occurred during enamel formation of this tooth. While the stress episode causing Wilson band no. 2 led to a local stop of enamel matrix secretion (formation of the pit-type defect), the latest of these stress episodes caused a permanent stop of matrix secretion over a wider area, leading to formation of the plane-type defect. On external inspection of his tooth, previously only a marked furrow-type defect had been diagnosed in that area, based on the presence of a ledge at the cervical border of the plane-type defect (Fig. 7).
Gray-level distribution in the BSE images (Figs 6 and 7) indicated that the hypoplastic enamel in the area of the plane-type defect exhibited various degrees of hypomineralization. This suggests that also the maturation stage of enamel formation had been impaired in this tooth. In some areas, a very severe enamel hypomineralization was observed. In these areas, the enamel exhibited conspicuous clefts due to water loss from the tissue, as well as patchy areas that appeared dark in the BSE images (Fig. 8).
Fig. 8.
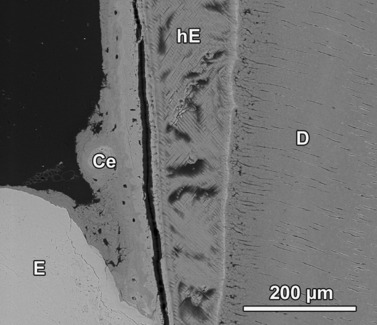
Severely hypomineralized enamel (hE) underneath a plane-type defect in the buccal enamel of a goat M2. The hypomineralized enamel is covered with cementum (Ce). The enamel (E) of the ledge area appears brighter, indicating a higher mineral content. D, dentin. BSE image. Cuspal direction to top of image.
A further example demonstrating the limitations of macroscopic diagnosis of severe developmental defects is demonstrated in the lingual enamel (Fig. 9) of the same tooth. Three Wilson bands can be seen in the depicted part of the lingual enamel that are numbered corresponding to the Wilson bands in the tooth’s buccal enamel (Figs 6 and 7). The stress episode that had led to the formation of Wilson band no. 2 had caused a local enamel aplasia in lingual enamel (Fig. 9). It may be assumed that in this location the cells of the inner dental epithelium were lethally damaged. The resulting deep defect had been completely filled with cementum. A later stress episode that caused the formation of the outermost Wilson band (no. 4) resulted in a more shallow hypoplastic defect located cuspal to the aplastic defect. Thus, in this case, a developmentally older enamel defect is located cervical to a developmentally younger one, a situation that may cause problems when trying to reconstruct the temporal sequence of stress episodes based on external inspection of the tooth surface. Because both defects are occluded by hyperplastic coronal cementum and in part also by dental calculus, however, neither of them had previously been correctly identified macroscopically.
Fig. 9.
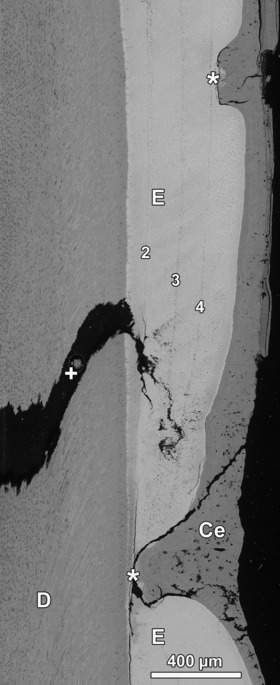
Aplastic defect (lower asterisk) and hypoplastic defect (upper asterisk) in lingual enamel (E) of a goat M2. Both defects are occluded by cementum (Ce) and were not correctly diagnosed on macroscopic inspection of the tooth surface. D, dentin; +, sectioning artifact. BSE image. Numbering of Wilson bands corresponds to that in Figs 6 and 7. Cuspal direction to top of image.
Even when the enamel is not overlain by thick layers of cementum and calculus, a correct reconstruction of the temporal sequence of stress episodes causing hypoplastic enamel defects can be difficult based on external inspection due to the steep inclination and the resulting large extension of the incremental lines in more cuspally located enamel portions. Thus, in the molar shown in Fig. 10, three hypoplastic defects can be observed along the vertical crown axis that are all associated with the same Wilson band and were thus formed contemporaneously. On external inspection, the more cuspally located hypoplastic defect (‘a’ in Fig. 10) might erroneously be interpreted to represent an earlier stress episode than that causing the more cervically located defects (‘b’ and ‘c’ in Fig. 10).
Fig. 10.
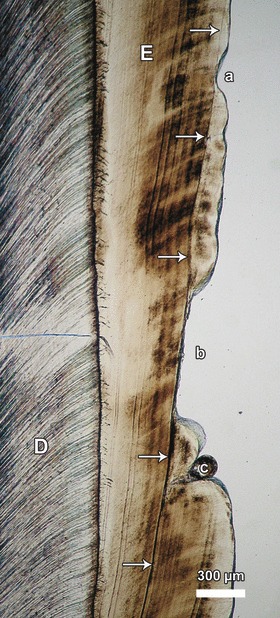
Transmitted light microscope image showing hypoplastic defects (a–c) in the buccal enamel (E) of an M1 of a sheep or goat (species assignment questionable). All defects are associated with the same accentuated incremental line (Wilson band, arrows) and were thus formed contemporaneously. D, dentin. Cuspal direction to top of image.
Likewise, the distinction between hypoplastic defects caused by systemic stress and those caused by local trauma to a developing tooth can be difficult based on external inspection alone. Figure 11A shows a hypoplastic defect in the cervical enamel of a sheep mandibular first molar. The depth of the defect could not be assessed on external inspection. Microscopic analysis of a section revealed a disruption of enamel continuity and an extension of the defect into the dentin (Fig. 11B,C). The funnel-shaped defect in the enamel was filled with cementum. A large lesion area in the dentin was composed of a tissue that was more highly mineralized than the surrounding dentin, but less mineralized than the enamel. The tissue in question contained numerous small cavities, presumably representing cell lacunae, but no dentinal tubules (Fig. 11C). Within this tissue, which is regarded to represent an irregularly structured reparative dentin (osteodentin sensuMiles & Grigson, 1990), an ovoid area of normally mineralized dentin was present. The latter contained some unmineralized areas that exhibited calcospherites along their walls and within their interior. The compound defect is regarded to have resulted from a trauma to the developing tooth during late crown formation that caused a disruption of the dental organ and also affected the cells of the dental pulp.
Fig. 11.
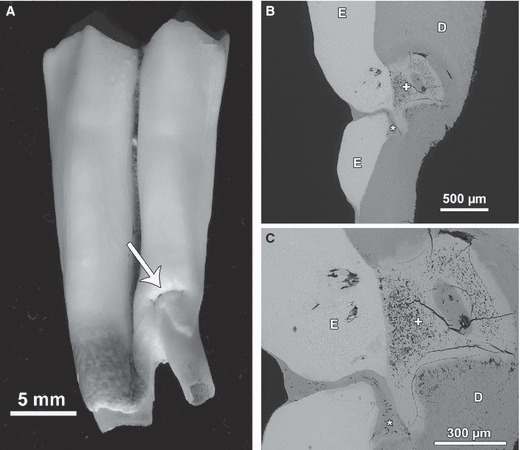
Hypoplastic defect attributed to local trauma in the buccal enamel of the anterior lobe of a sheep right M1. (A) Macroscopic appearance of the defect (arrow) located in cervical enamel. The defect is associated with an abnormal shape of the lower crown portion and the root. (B) Section showing disruption of enamel layer (E), filling of the enamel defect with cementum (asterisk) and area with irregular dentin (+). D, normal dentin. BSE image. (C) Higher magnification of the defect areas in enamel (E) and dentin (D). Asterisk: cementum; +, irregularly structured reparative dentin exhibiting numerous cavities. BSE image. Cuspal direction to top of images.
Discussion
This is the first study relating the location of hypoplastic enamel defects to the chronology of crown growth in sheep and goat molars. Our data demonstrate a considerable variation in enamel extension rates along the crowns of the studied teeth. A high extension rate was recorded for upper and mid-coronal lateral enamel, leading to extended enamel secretory fronts in these areas. In more cervical crown areas, the enamel extension rate was markedly lower. Our data indicate that roughly 75% of enamel extension along the EDJ occurs during the first half of the crown formation period, while during the second half only the remaining 25% of enamel extension takes place. Thus, the recruitment of new secretory ameloblasts into the enamel-forming front considerably slows down in the cervical direction. Corresponding data on enamel extension rates have recently been reported for sheep molars by Jordana & Köhler (2011). A reduction of enamel extension rates towards cervical crown areas has also been demonstrated in low-crowned primate teeth (e.g. Shellis, 1984, 1998; Reid & Ferrell, 2006; Smith, 2008; Birch & Dean, 2009; Dean, 2009).
Given that enamel thickness remains quite constant over large distances along the crown flanks of sheep and goat molars (C. Witzel & H. Kierdorf, unpublished observation), the recorded marked variation in enamel extension rates in combination with the relative constant apposition rate implies that in these teeth the formation of the cervical crown portion covers at least the same time span as that of the upper and middle crown portions. This fact is seen as the reason for the reported higher prevalence of enamel hypoplasia in the cervical compared with the upper and middle crown portions of these teeth (Balasse et al. 2010; Upex, 2010).
In the histological sections of sheep and goat enamel, three types of incremental features were observed. Those of the first type were markedly accentuated incremental lines (Wilson bands) that exhibited a variable spacing. These irregular incremental lines denote the position of the enamel-forming front at the time of a severe impact on the secretory ameloblasts and are thus indicative of stress episodes. Features of the second type were regular incremental lines that match the descriptions of laminations as reported by Tafforeau et al. (2007) for rhinoceros enamel, and by Jordana & Köhler (2011) for the enamel of M. balearicus. These authors consider laminations to be daily incremental markings.
The view that the regular incremental lines observed in the sheep and goat enamel also represent a daily incremental feature is supported by the fact that the overall numbers of increments recorded in the studied M1 (buccal enamel of posterior lobe; n = 307) and M3 (buccal enamel of posterior lobe; n = 457) reasonably well correspond to the crown formation periods reported for sheep M1s (about 280 days) and M3s (about 360 days) on the basis of radiographic studies (Weinreb & Sharav, 1964; Milhaud & Nezit, 1991). In this context it should be noted that early stages of tooth mineralization cannot be detected radiographically (Schroeder, 1987; Dean, 2010), and that completion of crown growth is delayed in the cervical enamel of the posterior lobe of the sheep M3 (C. Witzel & H. Kierdorf, unpublished observation). Based on the counting of increments in the lingual enamel of a tooth lobe, Jordana & Köhler (2011) previously reported crown formation times of 251 days in a sheep M1 and of 400 days in a sheep M3. Compared with lingual enamel, the buccal enamel of mandibular molars of sheep extends further apically, which may explain the difference in increment counts between Jordana & Köhler’s (2011) study and our investigation.
The alternating light and dark bands observed along the prism course between successive laminations represent the third type of incremental features and are regarded as intradian incremental markings. Occurrence of such intradian incremental markings has previously been reported in primate enamel (e.g. Smith, 2006).
Mean daily enamel apposition rate in the goat M1 ranged between 12.6 and 15.5 μm. These values are considerably higher than those reported for primate enamel, in which daily apposition rates between 2–3 μm and 6–7 μm have been observed (Shellis, 1998; Smith, 2008). The high enamel apposition rate in the goat tooth might lead to a misidentification of the daily incremental lines (laminations) as longer-period incremental features, that is, as lines with a repeat interval of more than 1 day. Such an erroneous interpretation could be favored by the presence of intradian markings in the form of alternating dark and light bands along the prism course of sheep and goat enamel. The latter markings resemble the prism cross-striations seen in primate enamel where they, however, represent daily (not subdaily as in the present case) incremental markings (Hillson, 1996, 2005; Smith, 2008; Antoine et al. 2009). Reconstruction of crown formation times involving a misinterpretation of daily and intradian incremental markings in ungulate enamel as, respectively, longer-period and daily markings will lead to an overestimation of formative periods. Such a misinterpretation may be the cause for previously reported crown formation times of more than 1000 days for molars of medium-sized African bovids (Macho & Williamson, 2002).
Regarding the reliability of identification of hypoplastic enamel defects by external inspection of sheep and goat molars, our results suggest that this depends on the type of defect and the associated presence of smaller or larger amounts of coronal cementum. Defects regarded to reflect a slight to moderate impairment of secretory ameloblast activity (i.e. furrow-type, depression-type and smaller plane-type defects) defects (Hillson & Bond, 1997; Witzel et al. 2006, 2008) can normally be correctly diagnosed as they are not occluded by hyperplastic coronal cementum. In contrast, deep pit-type, extended plane-type and aplastic defects, which are all indicative of a severe impairment of enamel matrix secretion (Witzel et al. 2008), can typically not be correctly diagnosed because they are occluded by large amounts of coronal cementum and, sometimes, additionally also by dental calculus. In consequence, neither the extension nor the depth of these defects can be correctly assessed on external inspection. Formation of a hyperplastic layer of coronal cementum is considered indicative of a premature breakdown of the enamel organ following an episode of severe stress (Kierdorf et al. 2005, 2009). The permanent disruption of ameloblast function resulting from this impact is also the cause of the severe enamel hypomineralization observed in the affected teeth.
The very long extension of the enamel secretory front during the formation of upper and mid-coronal lateral enamel of sheep and goat molars may cause problems in the reconstruction of the chronology of enamel defects on external inspection. Thus, hypoplastic defects underlain by the same Wilson band, and therefore reflecting the same stress episode, can be located at considerable vertical distances along the enamel surface. On external inspection, such contemporaneously formed defects could be misinterpreted as representing separate stress episodes. This problem is also encountered in low-crowned teeth, as has been shown for humans (Hillson & Bond, 1997) and pigs (Witzel et al. 2006), but is surely aggravated in the high-crowned teeth of bovids. Only on tooth sections can the depth of a hypoplastic defect and thus the timing of the underlying stress episode relative to crown formation be assessed. As was discussed with respect to the specimen shown in Fig. 11, a reliable distinction between enamel defects caused by systemic stress and those caused by local trauma likewise often requires microscopic analysis.
From a pragmatic point of view it is evident that when large numbers of teeth are to be scored for the presence of enamel hypoplasia, a macroscopic, non-destructive approach has to be chosen because a microscopic analysis would be too costly and time-consuming. Our data indicate that such a macroscopic approach is likely to provide reliable results in the case of hypoplastic enamel defects reflecting stress events of minor to moderate intensity. However, in the case of more severe enamel hypoplasia or of aplastic defects, a macroscopic approach has its serious limitations, and it is unlikely that such defects can be correctly identified by external inspection. The presence of large amounts of coronal cementum associated with these defect types will lead to an underestimation of their prevalence. It has been argued (Upex, 2010) that mechanical removal of the coronal cementum can help to solve the problem. However, it remains to be demonstrated that such a removal is possible without damaging the tooth and thereby producing artificial defects, especially in the case of severely hypomineralized enamel.
Acknowledgments
The authors thank Detlev Klosa for his skilful help with BSE imaging, and Marie Balasse for providing the sheep and goat molars from Kenya.
References
- Ainamo J. Morphogenetic and functional characteristics of coronal cementum in bovine molars. Scand J Dent Res. 1970;78:378–386. doi: 10.1111/j.1600-0722.1970.tb02085.x. [DOI] [PubMed] [Google Scholar]
- Antoine D, Hillson S, Dean MC. The developmental clock of dental enamel: a test for the periodicity of prism cross-striations in modern humans and an evaluation of the most likely sources of error in histological studies of this kind. J Anat. 2009;214:45–55. doi: 10.1111/j.1469-7580.2008.01010.x. [DOI] [PMC free article] [PubMed] [Google Scholar]
- Balasse M, Upex B, Ambrose S. The influence of environmental factors on enamel hypoplasia in domestic sheep and goat in southern Kenya, Masailand. In: Grupe G, McGlynn G, Peters J, editors. Tracking Down the Past: Ethnohistory Meets Archaeozoology. Vol. 7. 2010. pp. 10–13. Documenta Archaeobiologiae. [Google Scholar]
- Birch W, Dean MC. Rates of enamel formation in human deciduous teeth. In: Koppe T, Meyer G, Alt KW, editors. Comparative Dental Morphology. Vol. 13. 2009. pp. 116–120. Front Oral Biol. [DOI] [PubMed] [Google Scholar]
- Dean MC. Extension rates and growth in tooth height of modern human and fossil hominin canines and molars. In: Koppe T, Meyer G, Alt KW, editors. Comparative Dental Morphology. Vol. 13. 2009. pp. 68–73. Front Oral Biol. [DOI] [PubMed] [Google Scholar]
- Dean MC. Retrieving chronological age from dental remains of early fossil hominins to reconstruct human growth in the past. Philos Trans R Soc B. 2010;365:3397–3410. doi: 10.1098/rstb.2010.0052. [DOI] [PMC free article] [PubMed] [Google Scholar]
- Dobney K, Ervynck A. A protocol for recording linear enamel hypoplasia on archaeological pig teeth. Int J Osteoarchaeol. 1998;8:263–273. [Google Scholar]
- Dobney K, Ervynck A. Interpreting developmental stress in archaeological pigs: the chronology of linear enamel hypoplasia. J Archaeol Sci. 2000;27:597–607. [Google Scholar]
- Dobney K, Ervynck A, Albarella U, et al. The chronology and frequency of a stress marker (linear enamel hypoplasia) in recent and archaeological populations of Sus scrofa in north-west Europe, and the effects of early domestication. J Zool. 2004;264:197–208. [Google Scholar]
- Franz-Odendaal TA. Enamel hypoplasia provides insight into early systemic stress in wild and captive giraffes (Giraffa camelopardalis. J Zool. 2004;263:197–206. [Google Scholar]
- Goodman AH, Rose JC. Assessment of systemic physiological perturbations from dental enamel hypoplasias and associated histological structures. Yearb Phys Anthropol. 1990;33:59–110. [Google Scholar]
- Guatelli-Steinberg G. Linear enamel hypoplasia in gibbons (Hylobates lar carpenteri. Am J Phys Anthropol. 2000;112:395–410. doi: 10.1002/1096-8644(200007)112:3<395::AID-AJPA9>3.0.CO;2-H. [DOI] [PubMed] [Google Scholar]
- Guatelli-Steinberg G. Macroscopic and microscopic analysis of linear enamel hypoplasia in plio-pleistocene South-African hominins with respect to aspects of enamel development and morphology. Am J Phys Anthropol. 2003;120:309–322. doi: 10.1002/ajpa.10148. [DOI] [PubMed] [Google Scholar]
- Hillson S. Dental Anthropology. Cambridge: Cambridge University Press; 1996. [Google Scholar]
- Hillson S. Teeth. 2nd edn. Cambridge: Cambridge University Press; 2005. [Google Scholar]
- Hillson S, Bond S. Relationship of enamel hypoplasia to the pattern of tooth crown growth. Am J Phys Anthropol. 1997;104:89–103. doi: 10.1002/(SICI)1096-8644(199709)104:1<89::AID-AJPA6>3.0.CO;2-8. [DOI] [PubMed] [Google Scholar]
- Iinuma YM, Tanaka S, Kawasaki K, et al. Dental incremental lines in sika deer (Cervus nippon); polarized light and fluorescence microscopy of ground sections. J Vet Med Sci. 2004;66:665–669. doi: 10.1292/jvms.66.665. [DOI] [PubMed] [Google Scholar]
- Jordana X, Köhler M. Enamel microstructure in the fossil bovid Myotragus balearicus (Majorca, Spain): implications for life-history evolution of dwarf mammals in insular ecosystems. Palaeogeogr Palaeoclimatol Palaeoecol. 2011;300:59–66. [Google Scholar]
- Kierdorf H, Kierdorf U. Disturbances of the secretory stage of amelogenesis in fluorosed deer teeth: a scanning electron-microscopic study. Cell Tissue Res. 1997;289:125–135. doi: 10.1007/s004410050858. [DOI] [PubMed] [Google Scholar]
- Kierdorf H, Kierdorf U, Witzel C. Deposition of cellular cementum onto hypoplastic enamel of fluorotic teeth in wild boars (Sus scrofa L.) Anat Embryol. 2005;209:281–286. doi: 10.1007/s00429-004-0442-x. [DOI] [PubMed] [Google Scholar]
- Kierdorf H, Zeiler J, Kierdorf U. Problems and pitfalls in the diagnosis of linear enamel hypoplasia in cheek teeth of cattle. J Archaeol Sci. 2006;33:1690–1695. [Google Scholar]
- Kierdorf H, Kierdorf U, Witzel C, et al. Developmental defects and postmortem changes in archaeological pig teeth from Fais island, Micronesia. J Archaeol Sci. 2009;36:1637–1646. [Google Scholar]
- King T, Humphrey LT, Hillson S. Linear enamel hypoplasia as indicators of systemic physiological stress: evidence from two known age-at-death and sex populations from postmedieval London. Am J Phys Anthropol. 2005;128:546–559. doi: 10.1002/ajpa.20232. [DOI] [PubMed] [Google Scholar]
- Macho GA, Williamson DK. The effects of ecology on life history strategies and metabolic disturbances during development: an example from the African bovids. Biol J Linn Soc. 2002;75:271–279. [Google Scholar]
- Miles AEW, Grigson C. Colyer’s Variations and Diseases of the Teeth of Animals. rev. edn. Cambridge: Cambridge University Press; 1990. [Google Scholar]
- Milhaud G, Nezit J. Développement des molaires chez le mouton. Étude morphologique, radiographique et microdurométrique. Rec Méd Vét. 1991;167:121–127. [Google Scholar]
- Mills PB, Irving JT. Coronal cementogenesis in cattle. Arch Oral Biol. 1967;12:929–931. doi: 10.1016/0003-9969(67)90120-3. [DOI] [PubMed] [Google Scholar]
- Moggi-Cecchi J, Crovella S. Occurrence of enamel hypoplasia in the dentitions of Simian primates. Folia Primatol. 1991;57:106–110. doi: 10.1159/000156571. [DOI] [PubMed] [Google Scholar]
- Niven LB, Egeland CP, Todd LC. An inter-site comparison of enamel hypoplasia in bison: implications for paleoecology and modelling Late Plains archaic subsistence. J Archaeol Sci. 2004;31:1783–1794. [Google Scholar]
- Payne S. Kill-off patterns in sheep and goats: the mandibles from Aşvan Kale. Anatol Stud. 1973;23:281–303. [Google Scholar]
- Reid DJ, Dean MC. Variation in modern human enamel formation times. J Hum Evol. 2006;50:329–346. doi: 10.1016/j.jhevol.2005.09.003. [DOI] [PubMed] [Google Scholar]
- Reid DJ, Ferrell RJ. The relationship between number of striae of Retzius and their periodicity in imbricational enamel formation. J Hum Evol. 2006;50:195–202. doi: 10.1016/j.jhevol.2005.09.002. [DOI] [PubMed] [Google Scholar]
- Rose JC. Defective enamel histology of prehistoric teeth from Illinois. Am J Phys Anthropol. 1977;46:439–446. doi: 10.1002/ajpa.1330460309. [DOI] [PubMed] [Google Scholar]
- Schroeder HE. Orale Strukturbiologie. 3rd edn. Stuttgart: Thieme; 1987. [Google Scholar]
- Schwartz GT, Samonds KE, Godfrey LR, et al. Dental microstructure and life history in subfossil Malagasy lemurs. Proc Natl Acad Sci USA. 2002;99:6124–6129. doi: 10.1073/pnas.092685099. [DOI] [PMC free article] [PubMed] [Google Scholar]
- Schwartz GT, Reid DJ, Dean MC, et al. A faithful record of stressful life events preserved in the dental development of a juvenile gorilla. Int J Primatol. 2006;27:1201–1219. [Google Scholar]
- Shellis RP. Variations in growth of the enamel crown in human teeth and a possible relationship between growth and enamel structure. Arch Oral Biol. 1984;29:697–705. doi: 10.1016/0003-9969(84)90175-4. [DOI] [PubMed] [Google Scholar]
- Shellis RP. Utilization of periodic markings in enamel to obtain information on tooth growth. J Hum Evol. 1998;35:387–400. doi: 10.1006/jhev.1998.0260. [DOI] [PubMed] [Google Scholar]
- Simmer JP, Papagerakis P, Smith CE, et al. Regulation of dental enamel shape and hardness. J Dent Res. 2010;89:1024–1038. doi: 10.1177/0022034510375829. [DOI] [PMC free article] [PubMed] [Google Scholar]
- Skinner MF, Hopwood D. Hypothesis for the causes and periodicity of repetitive linear enamel hypoplasia in large, wild African (Pan troglodytes and Gorilla gorilla) and Asian (Pongo pygmaeus) apes. Am J Phys Anthropol. 2004;123:216–235. doi: 10.1002/ajpa.10314. [DOI] [PubMed] [Google Scholar]
- Smith TM. Experimental determination of the periodicity of incremental features in enamel. J Anat. 2006;208:99–113. doi: 10.1111/j.1469-7580.2006.00499.x. [DOI] [PMC free article] [PubMed] [Google Scholar]
- Smith TM. Incremental dental development: methods and applications in hominoid evolutionary studies. J Hum Evol. 2008;54:205–224. doi: 10.1016/j.jhevol.2007.09.020. [DOI] [PubMed] [Google Scholar]
- Tafforeau P, Bentaleb I, Jaeger JJ, et al. Nature of laminations and mineralization in rhinoceros enamel using histology and X-ray synchrotron microtomography: potential implications for palaeoenvironmental isotopic studies. Palaeogeogr Palaeoclimatol Palaeoecol. 2007;246:206–227. [Google Scholar]
- Upex BR. Enamel hypoplasia in archaeological and modern caprine populations: the development and application of a new methodological approach. University of Durham, UK; 2010. Unpublished PhD thesis, Department of Archaeology. [Google Scholar]
- Weinreb MM, Sharav Y. Tooth development in sheep. Am J Vet Res. 1964;25:891–908. [PubMed] [Google Scholar]
- Witzel C, Kierdorf U, Dobney K, et al. Reconstructing impairment of secretory ameloblast function in porcine teeth by analysis of morphological alterations in dental enamel. J Anat. 2006;209:93–110. doi: 10.1111/j.1469-7580.2006.00581.x. [DOI] [PMC free article] [PubMed] [Google Scholar]
- Witzel C, Kierdorf U, Schultz M, et al. Insights from the inside: histological analysis of abnormal enamel microstructure associated with hypoplastic enamel defects in human teeth. Am J Phys Anthropol. 2008;136:400–414. doi: 10.1002/ajpa.20822. [DOI] [PubMed] [Google Scholar]
- Zsigmondy O. On congenital defects of the enamel. Dent Cosmos. 1893;35:709–717. [PMC free article] [PubMed] [Google Scholar]


