

Abstract
Purkinje cells (PCs) in the mammalian cerebellum express high-frequency spontaneous activity with average spike rates between 30 and 200 Hz. Cerebellar nuclear (CN) neurons receive converging input from many PCs, resulting in a continuous barrage of inhibitory inputs. It has been hypothesized that pauses in PC activity trigger increases in CN spiking activity. A prediction derived from this hypothesis is that pauses in PC simple-spike activity represent relevant behavioral or sensory events. Here, we asked whether pauses in the simple-spike activity of PCs related to either fluid licking or respiration, play a special role in representing information about behavior. Both behaviors are widely represented in cerebellar PC simple-spike activity. We recorded PC activity in the vermis and lobus simplex of head-fixed mice while monitoring licking and respiratory behavior. Using cross-correlation and Granger causality analysis, we examined whether short interspike intervals (ISIs) had a different temporal relationship to behavior than long ISIs or pauses. Behavior-related simple-spike pauses occurred during low-rate simple-spike activity in both licking- and breathing-related PCs. Granger causality analysis revealed causal relationships between simple-spike pauses and behavior. However, the same results were obtained from an analysis of surrogate spike trains with gamma ISI distributions constructed to match rate modulations of behavior-related Purkinje cells. Our results therefore suggest that the occurrence of pauses in simple-spike activity does not represent additional information about behavioral or sensory events that goes beyond the simple-spike rate modulations.
Introduction
Purkinje cells in the mammalian cerebellar cortex express high levels of spontaneous baseline activity with average action potential rates between 30 and 200 Hz (Thach, 1970; Bryant et al., 2010). The inhibitory Purkinje cells contact neurons in the deep cerebellar nuclei (DCNs), whose spike trains represent the cerebellar output signals. Several tens of Purkinje cells converge on a single DCN neuron, generating a constant barrage of inhibitory inputs (Person and Raman, 2012). Despite this ongoing high-frequency inhibitory input, DCN neurons are spontaneously active with their firing rates presumably modulated by fluctuations in Purkinje cell inhibition. However, presynaptic Purkinje cell activity likely must show some degree of coherence to modulate DCN spike activity (for review, see De Zeeuw et al., 2011). It has been hypothesized that pauses in Purkinje cell inhibitory activity, particularly if synchronized across many presynaptic Purkinje cells, would trigger significant increases in DCN spiking activity (Aizenman and Linden, 1999; Gauck and Jaeger, 2000; Person and Raman, 2012). Other authors have suggested that Purkinje cell activity switches between active and silent states, creating “pauses” on the timescale of seconds (Loewenstein et al., 2005; Yartsev et al., 2009), a view that has been disputed by others (Schonewille et al., 2006). Theoretical studies suggest that patterns and pauses in Purkinje cell spike firing could play a key role in the neuronal representation of information (De Schutter and Steuber, 2009). Such a mechanism would predict that the occurrence of pauses in simple-spike activity could have a unique and independent role in coding behavioral or sensory events involving the cerebellum. Walter and Khodakhah (2006, 2009) offered an alternative view suggesting that Purkinje cells generate a linear rate-based output signal.
Here, we asked whether long intervals or “pauses” in Purkinje cell simple-spike firing are more strongly correlated with or have a higher causal relationship to behavioral or sensory events than average or short interspike intervals (ISIs), the alternative being that the occurrence of long ISIs follows expectations based on simple-spike rate modulation.
We recorded single-unit simple-spike activity in the cerebellum of awake, head-fixed mice while recording rhythmic fluid licking or respiratory behavior. Licking behavior is widely represented in Purkinje cell simple- and complex-spike activity in the cerebellum of rats and mice (Welsh et al., 1995; Bryant et al., 2010). We found respiration-related PCs predominantly in the vermis, which is consistent with previous studies demonstrating that their target cells, fastigial nuclear neurons, modulate respiratory activity (Xu et al., 2004). Here, we focused our analysis on the question whether particularly long ISIs or “pauses” in simple-spike activity occurred in unexpected numbers or showed a stronger than expected correlation or causal relationship with licking or respiratory behavior. We applied cross-correlation and Granger causality analysis to investigate how behavior is represented in the simple spike train of lick-related Purkinje cells as a function of interspike interval duration, and we created surrogate spike trains with specific ISI probability distributions to examine the likelihood of pauses based on rate fluctuations alone.
Materials and Methods
Animals.
Experiments were performed on male and female adult C57BL/6J (B6) mice (18–25 g; The Jackson Laboratory). All mice used in this study were raised and all experiments were performed in accordance with procedural guidelines approved by the University of Tennessee Health Science Center Animal Care and Use Committee. Principles of laboratory animal care (NIH publication no. 86-23, revised 1996) were followed.
Surgery.
A detailed description of the surgical and experimental procedures has been published previously (Bryant et al., 2009, 2010). Mice were initially anesthetized with 3% isoflurane in oxygen (Ohio isoflurane vaporizer; Highland Medical Equipment) in an incubation chamber and then transferred to a stereotaxic device. Anesthesia was maintained through a nose cone with 1–2% isoflurane during surgery. The depth of anesthesia was adjusted so that the mice failed to show a reflex withdrawal of the hindpaw to a strong pinch. Rectal temperature was maintained at 37–38°C with a servo-controlled heat blanket (FHC). Standard surgical techniques were used to secure three small machine screws in the skull (1/8′ dome head, 0.8 mm diameter, 2 mm long; Small Parts). A craniotomy (2–3 mm diameter) was performed to expose vermis and simple lobule of the right cerebellar hemisphere. The exposed dura was covered with triple antibiotic ointment (Walgreens) to keep it moist and to reduce infection risk. A cylindrical plastic chamber was placed over the craniotomy. A custom-made head post was place in a stereotaxically defined position relative to bregma. The chamber and head post were secured to the skull screws with dental acrylic (Teets methyl methacrylate denture material; Co-Oral-Ite Manufacturing). The chamber was completely filled with triple antibiotic ointment. While still under anesthesia, mice were injected subcutaneously with 2.5 mg/kg Torbugestic (Fort Dodge) in 0.5 ml of lactated Ringer's solution to alleviate pain and supply fluid following and 24 h after the surgery. A 3–4 d postsurgical recovery period was observed before electrophysiological experiments.
Electrophysiology and behavior.
Access to water in the home cages was restricted 24 h before electrophysiological experiments. During experiments, the mouse's head was fixed to a metal holder and the body was loosely covered with a plastic tube to limit body movements (Bryant et al., 2009). The recoding chamber was cleaned and filled with Ringer's solution. Up to seven recording electrodes (glass-insulated tungsten/platinum; 80 μm O.D.; impedance, 3–7 MΩ) were inserted into the cerebellum using a computer-controlled microdrive (System Eckhorn; Thomas Recording). Purkinje cells were identified based on their location and firing characteristics such as the presence of complex spikes as well as sustained high-frequency simple-spike firing rates (Thach, 1970). The raw signals were bandpass filtered (200 Hz to 8 kHz) and amplified (total, 230×) using a filter amplifier (FA32; Multi Channel Systems). Filtered and amplified voltage signals were digitized and stored on a computer hard disk (16 bit A/D converter; sampling rate, >20 kHz) using a CED power1401 and Spike2 software (both Cambridge Electronic Design). Licking behavior was monitored with a piezo foil sensor, which created a voltage signal at the moment when the mouse's tongue touched the waterspout. Respiratory behavior was monitored with a thermistor (Measurement Specialties) placed in front of one nostril. Breathing cycles were measured as increasing and decreasing temperature changes caused by exhale and inhale movements, respectively. Raw licking or respiratory signals were digitized at 1 kHz. Purkinje cell spike activity and behavior were recorded simultaneously and stored to the same data file for off-line analysis.
After each experiment, the chamber was rinsed with sterile Ringer's solution and filled with triple antibiotic ointment. During the last two experimental sessions, two to three small electrolytic lesions (5 μA/10 s) were formed in stereotaxically defined locations using the head post as reference.
To prepare the brains for anatomical verification of recording sites, mice were deeply anesthetized with intraperitoneal injection of Avertin (tribromoethanol; 500 mg/kg) and transcardially perfused with 0.01 m PBS, followed by 4% formaldehyde. After the perfusion, the cerebellum was removed and fixed in 4% formaldehyde for 24 h. The cerebellum was cut into 50 μm coronal sections, which were mounted and stained with cresyl violet. The location of lesion sites was determined using a stereotaxic atlas of the mouse brain (Paxinos and Franklin, 2001).
Data analysis.
Lick times were marked using a voltage threshold to detect negative voltage deflections in the signal generated by lick-related deflection of the piezo foil. Licking behavior was characterized by the mean and SD of the interlick interval (ILI) within an interval range from 30 to 200 ms. Intervals <30 or >200 ms were considered artifacts or an interruption of licking behavior, respectively. Peaks and troughs in the respiratory signals corresponded to the ends of expiration and inspiration cycles, respectively. Peak and trough times were detected and marked to be used as temporal aligns for cross-correlation analysis. Single-unit Purkinje cells were identified based on spike rate (30–200 Hz), the presence of simple and complex spikes, and a minimal 3 ms refractory period. Simple and complex spikes were separated based on spike shape and the typical pattern of spikelets and spike pause associated with complex spikes (Fig. 1A).
Figure 1.
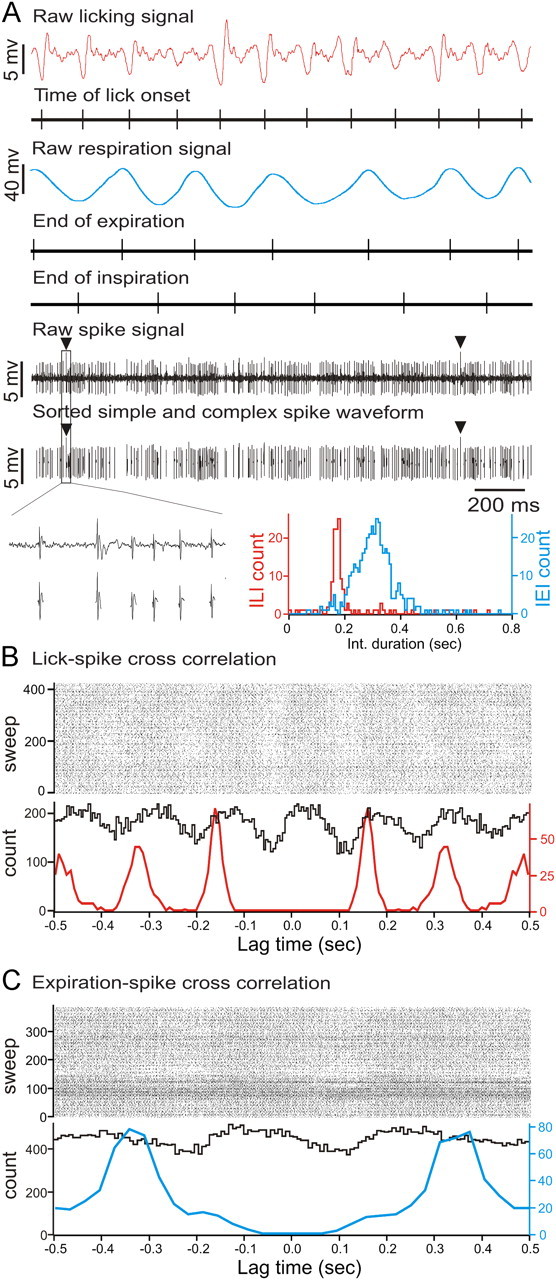
Raw data example of simple-spike activity correlated with licking and respiratory behavior. A, Raw data examples of simultaneous recordings of single-unit Purkinje cell spike activity with licking and respiratory behavior. Under each trace are time markers marking the tongue-to-spout contact times for the licking trace (red), the end-of-expiration and inspiration times for the respiratory trace (blue), and simple-spike and complex-spike activity for the PC spike train recording, respectively. The black triangles mark complex spikes. Expanded portion of raw spike train signal showing simple and complex spikes and the extracted spike shapes used for shape based spike sorting underneath each spike. The histogram on the right shows the interlick interval (red) and interexpiration interval (blue) distribution. B, Combined cross-correlation and autocorrelation histograms showing the cross-correlation between licking and simple-spike activity (black line) and the autocorrelation of licking events (red line). C, Combined cross-correlation and autocorrelation histograms showing the cross-correlation between expiration and simple-spike activity (black line) and the autocorrelation of expiration events (blue line).
In total, we analyzed 22 single-unit Purkinje cell spike trains, 12 that showed rhythmic lick-locked modulation of spiking activity and 10 that showed rhythmic respiration-locked modulation of spiking activity. The correlation between simple spikes and behavior was analyzed using cross-correlation analysis (Spike2 software; CED) with the lick times as the temporal aligns (Fig. 1B). Shin and De Schutter (Schonewille et al., 2006; De Schutter and Steuber, 2009) defined pause as an ISI of >12 ms. Here, we divided simple spike trains into six groups of ISIs with increasing durations as follows (in ms): 0–10, 10–20, 20–30, 30–40, 40–50, >50 (Fig. 2). Behavior–spike cross-correlations were calculated for the complete spike train (all ISIs) and separately for each of the six groups of ISIs using the interval onset spikes as the temporal marker for intervals. Correlation strengths were quantified using z-scores of peak correlation values. Z-score expresses the difference between raw correlation amplitude and the expected mean correlation in multiples of the expected SD. The mean and SDs of expected spike–behavior cross-correlations under the null hypothesis of independence were calculated from randomly shuffled spike trains (averaging over 100 shuffling repetitions). Peak correlation values with z-score ≥3 were considered significant.
Figure 2.

Decomposition of the simple-spike portion of the spike train into interval groups of increasing duration. A, ISI histograms of a single-unit Purkinje cell simple spike train. The ISI distribution for a matched gamma-distributed spike train is shown in the inset. B, Illustration of the decomposition of a simple spike train into groups of interspike intervals of different durations. (Colors correspond to those in the interval histogram in A). Cross-correlation analyses between spike intervals and behavior were performed using the first spikes (i.e., the interval onsets) as the time of interval occurrence.
We used Granger causality techniques to determine whether differences in causal influences from behavior to spike activity existed between the groups of ISIs. Granger causality is a statistical measure based on the concept of time series forecasting (Granger, 1969). If the current state of a time series is better predicted by incorporating the past knowledge of a second one, the second series is said to have a causal influence on the first. The causality measure exists both in time and frequency domains. The causality in the frequency domain provides not only the strength and direction but also the frequency of interactions between processes. Here, we used the Fourier transforms-based nonparametric Granger causality (Dhamala et al., 2008a,b), known to be effective for complex time series (Dhamala et al., 2008b) and spike trains (Nedungadi et al., 2009). With this nonparametric approach, spectral density matrices were estimated by using direct Fourier transforms of time series data. Matrices then underwent spectral density matrix factorization and Geweke's variance decomposition (Geweke, 1982) for the estimation of Granger causality in frequency domain.
We generated surrogate gamma-distributed spike trains that individually replicated the statistical properties of recorded PC simple spike trains in terms of mean firing rate, regularity of firing, and behavior-related rate modulation. In this analysis, each recorded Purkinje cell spike train was analyzed for ongoing fluctuations in rate and regularity using a Bayesian method (Shimokawa and Shinomoto, 2009). The method assumes that the interspike intervals are derived independently from a gamma distribution with time varying mean and regularity and accumulated as a series of spike times. By reverse engineering, we used the estimated rate and regularity from the recorded cells to create gamma-distributed interspike intervals to construct surrogate spike train. Because the method of Shimokawa and Shinomoto only follows slow changes in rate and regularity, the behavior-related fast modulations in rate were not present in the surrogate data constructed with this method. They were added by convolving the ongoing mean rate based on the Shimokawa and Shinomoto method values with normalized perievent rate modulations estimated from perievent spike histograms for licking or breathing.
The same quantitative analysis of correlations strength was repeated in surrogate spike trains. Statistical comparisons of Z-scores were made using two-way ANOVA with repeated measures, followed by Tukey's post hoc test. Statistical analysis was performed using the SigmaStat 3.5 software (Systat). All values are expressed as means ± SD.
Results
Correlation between licking behavior and Purkinje cells simple-spike intervals
Adult B6 WT mice licked at an average rate of 6.4 ± 0.7 Hz (mean ± SD) corresponding to an average ILI duration of 158.7 ± 6.4 ms (mean ± SD). A raw data example of the lick-signal and a simultaneously recorded single-unit Purkinje cell spike train is shown in Figure 1A. The combined lick–spike cross-correlation and lick autocorrelation histogram in Figure 1B illustrate the rhythmic correlation between simple-spike activity and rhythmic licking.
In our study, the mean simple-spike firing rate across all lick-related Purkinje cells (n = 12) was 84.1 ± 23.3 Hz, corresponding to an average ISI of 12.7 ± 3.1 ms. Lick–spike cross-correlations were calculated for simple and complex spikes separately. Complex spikes were analyzed separately to exclude pauses associated with this event from the simple-spike pause analysis. We did not find a significant correlation of complex spikes with licking or respiratory behavior, which is consistent with earlier findings (Bryant et al., 2010). Complex spikes were thus not analyzed further. All following analyses were performed on simple spikes only, excluding pauses associated with complex spikes.
Lick–spike cross-correlations were calculated for the entire simple spike train and for each of the six groups of ISIs with increasing durations as follows (in ms): 0–10, 10–20, 20–30, 30–40, 40–50, >50 (Fig. 2). The spikes at the interval onset were chosen as the time of the interval for all further analysis. We also performed the analysis with the spike at the end of the interval and with an artificial time marker placed in the center of intervals but found that the choice of time marker made no difference in the results. An example of a raw spike train decomposed into the six subspike trains by ISI duration is shown in Figure 2B. The ISI distributions of surrogate gamma spike trains for individual PC recordings (Fig. 2A, inset) had a slightly diminished peak at the modal interval. As a control, surrogate data were made from previously constructed gamma distributed spike trains made to match PC recordings, and in this second iteration the gamma distributed surrogate exactly matched the ISI distribution of the original. Therefore, the diminished peak at the mode for surrogate data that was found in all cells for which surrogate data were made (N = 22) indicates that the original PC recordings were not fully showing the statistical properties of a gamma distribution with time-varying mean and regularity. This finding is consistent with previous observations that PC spike trains show short runs of highly regular ISIs (De Schutter and Steuber, 2009), which would not be present in a gamma distribution. Our derived gamma-distributed spike trains, however, provide an ideal control for the question of whether long intervals (pauses) in the recorded spike trains play a special functional role with respect to behavior compared with long intervals expected by chance due to behavioral rate changes. This is the main topic of the analysis below.
Correlation analysis of decomposed spike trains revealed that the strength of lick–spike correlations were a function of ISI duration (Fig. 3A, first column). Figure 3A shows lick–spike cross-correlation results from a single-unit Purkinje cell. When taking all ISI into account, Purkinje cells in both columns show significant, rhythmic correlations with licking behavior (Fig. 3A, top row). The cell modulated its spike rate by rhythmically increasing the rate above the baseline rate, as indicated by the fact that the raw correlation values do not fall below the expected mean correlation. Comparison of the correlation results for the six different ISI groups shows that the lick-locked rate modulation is most pronounced in the 0–10 ms ISI range and weaker for longer ISIs. Comparison of lick–pause correlations (i.e., correlations with long ISIs) shows no lick–pause correlations for ISIs of >20 ms. For 10 of 12 cells, pause–lick correlations did not reach peak z-scores of 3 or larger. In pause correlations with behavior, regardless of their z-scores, their peak correlation always occurred at a 180° phase shift relative to the peak of short ISI–lick correlation (data not shown). For the majority of Purkinje cells (10 of 12), correlations with licking behavior were weak or absent for long ISIs.
Figure 3.

Cross-correlation analyses of biological and surrogate Purkinje cell simple spike trains with licking and respiratory behavior. A, Left, Lick–simple spike cross-correlations for all simple spikes (top histograms) and for interspike intervals of increasing duration as denoted on the left of each row. In each histogram, the thin black lines represent the raw cross-correlation histogram. The two gray lines and the center black line represent the ±3 SDs and mean of the shuffled correlations. Right, Same analysis as on the left, but applied to surrogate spike trains and licking intervals. B, Same analysis as in A but for expiration–simple spike cross-correlations in the left column and the matching surrogate spike data on the right. The y-axis scales show z-scores.
Cross-correlation analysis of our gamma-distributed surrogate simple-spike data replicated the results obtained with biological Purkinje cell data (Fig. 3A, second column). Pause correlations in the biological spike trains (Fig. 3A, first column) were found to be similar in the surrogate data constructed from the same spike train (Fig. 3A, second column). Thus, comparison of correlation results between simple-spike and surrogate data suggest that the correlation between long ISIs and licking behavior follows a time course that would be expected based on simple-spike rate fluctuations (i.e., with pause probability being highest during low-frequency firing and vice versa).
A quantitative comparison of peak lick–ISI cross-correlation amplitudes for biological and surrogate spike trains across all recorded Purkinje cells (N = 12) revealed that short ISIs (0–10 ms) in both biological and surrogate spike trains had the strongest correlation with the behavioral events (z-score = 6.3 ± 2.7), intermediate ISIs and long ISIs showed weak or no correlation (z-score < 2.59 for all other ISIs) (Fig. 4A). The same quantitative analysis of correlations strength was repeated in surrogate spike trains, and the results were concordant with biological spike trains (Fig. 4A). A two-way ANOVA analysis revealed no significant interaction effect (F(6,66) = 1.639; p = 0.136) between the group factor (two groups levels: biological vs surrogate) and ISI factor (seven levels: all, 0–10, 10–20, 20–30, 30–40, 40–50, >50 ms) and no significant overall group effect (F(1,66) = 0.097; p = 0.761). But the z-score for group of ISI 0–10 ms with licking is greater than all spikes and all groups of ISI >20 ms (all p < 0.05), and z-score for all spikes with licking is greater than all groups of ISI >20 ms for both biological and surrogate spike trains (all p < 0.05) (Fig. 4A).
Figure 4.

Quantitative analysis of peak spike–lick correlations as a function of interspike interval duration. A, Correlation strength between interspike intervals and fluid licking was quantified using the z-scores of the peak cross-correlation values from 12 Purkinje cell single-unit simple spike trains and matching surrogate spike trains. B, Z-scores of peak cross-correlation values for interspike intervals and expiration from 10 Purkinje cell single-unit simple spike trains and matching surrogate spike trains. #Significant differences between all-spikes correlation z-score with correlation z-scores of all other ISI groups. *Significant differences between correlation z-scores for 0–10 ms ISIs with z-scores of all other ISI groups.
Correlation between respiratory behavior and Purkinje cells simple-spike intervals
Adult B6 WT mice breathe at an average rate of 3.4 ± 0.2 Hz (mean ± SD) corresponding to an average interexhale interval (IEI) duration of 298.6 ± 14.5 ms (mean ± SD). A raw data example of the respiratory signal and a simultaneously recorded single-unit Purkinje cell spike train is shown in Figure 1A. The combined expiration–spike cross-correlation and expiration autocorrelation histogram in Figure 1C illustrates the rhythmic correlation between simple-spike activity and rhythmic respiration. The mean simple-spike firing rate across all respiration-related Purkinje cells (n = 10) was 111.7 ± 12 Hz, corresponding to an average ISI of 9.9 ± 1.1 ms.
Correlation analysis of decomposed spike trains revealed that correlation strength was a function of IEI duration (Fig. 3B, first column). Figure 3B shows expiration–spike cross-correlation results from a single-unit Purkinje cell. The cell modulated its rate around the expected mean with stronger rate decreases than increases. Comparison of the correlation results for the six different ISI groups shows that the expiration-locked rate modulation is most pronounced in the 0–10 ms ISI range and weaker for longer ISIs. For the majority of Purkinje cells (9 of 10), correlations with respiratory behavior were weak or absent for long ISIs.
As was the case with lick-related spike firing, the comparison of correlation results between simple-spike and surrogate data suggests that the correlation between long ISIs and respiratory behavior follows a time course that would be expected based on simple-spike rate fluctuations (i.e., with pause probability being highest during low-frequency firing and vice versa) (Fig. 3B).
A quantitative comparison of peak expiration–ISI cross-correlation amplitudes for biological and surrogate spike trains across all respiration-related Purkinje cells (N = 10) revealed that short ISIs (0–10 ms) in both biological and surrogate spike trains had the strongest correlation with the behavioral events (z-score = 4.1 ± 0.6), intermediate ISIs and long ISIs showed weak or no correlation (z-score < 2.55 for all other ISIs) (Fig. 4B). The same quantitative analysis of correlations strength was repeated in surrogate spike trains, and the results were concordant with biological spike trains (Fig. 4B). A two-way ANOVA analysis revealed no significant interaction effect (F(6,34) = 1.768; p = 0.135) between the group factor (two groups levels: biological vs surrogate) and ISI factor (seven levels: all, 0–10, 10–20, 20–30, 30–40, 40–50, >50 ms) and no significant overall group effect (F(1,34) = 0.05; p = 0.825). But the z-score for all spike and group of ISI 0–10 ms with expiration is greater than all groups of ISI >20 ms for both biological and surrogate spike trains (all p < 0.05) (Fig. 4B).
Granger causality analysis
The perievent time histograms of PC recordings split up into different ISI groups for licking (Fig. 5A, left column) and for breathing (Fig. 5C, left column) reflected behavioral modulation also seen in the cross-correlation analysis (Fig. 3). The fast ISIs showed a strong behavioral modulation, whereas intermediate ISIs of 10–30 ms duration did not show any modulation. However, a weak modulation in the opposite direction was seen for the longest ISIs (>30 ms). This same pattern of behavioral modulation was replicated in the surrogate gamma-distributed spike trains (Fig. 5B,D, middle column). This finding indicates that a behavioral modulation of firing rate alone fully accounts for the strong modulation of short ISIs, the weak opposite modulation of long ISIs, and the absence of modulation in intermediate ISIs. Essentially, in a gamma random distribution, short ISIs become more likely when the rate is increased, and long ISIs become more likely when the rate is decreased.
Figure 5.
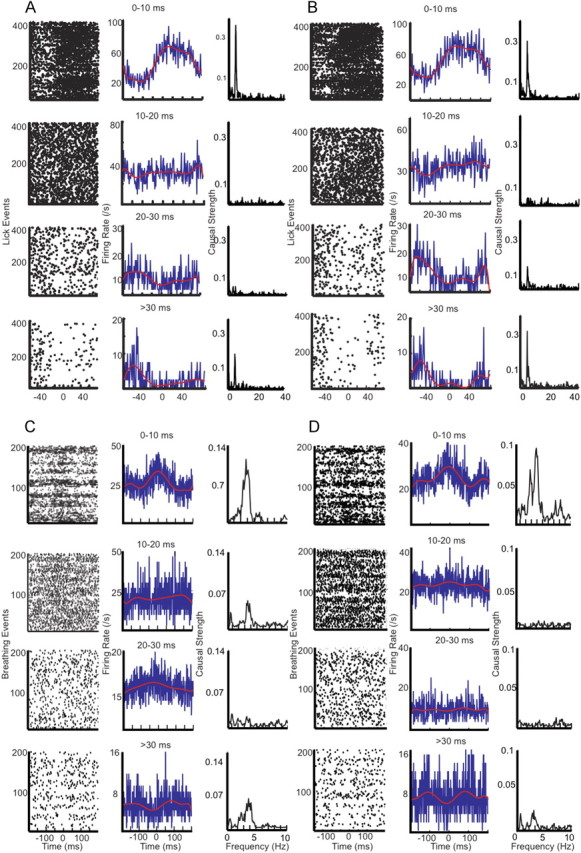
Granger causality analysis of biological and surrogate spike and lick data as a function of interspike interval duration. A, Left column, Perievent raster plots for spikes preceding intervals of durations as indicated at the center above each plot. The black dots represent spikes. Time “0” on the x-axis corresponds to the time at which the mouse's tongue touched the waterspout. Middle column, Firing rate estimation from the perievent time histogram (PETH). The blue traces correspond to firing rate estimation per 1 ms bins. The red traces are an eighth-order polynomial fit for spike rate modulation. Right column, Granger causality analysis for lick to spikes causality. The peak at 6 Hz corresponds to the average lick frequency and represents a causal relationship between licking behavior and simple-spike activity. Note there is a high causal strength for short and long interspike interval durations compared with intermediate ones. B, The same analyses as in A but performed on surrogate spike trains. Left column, Raster plots of surrogate spike activity. Middle column, Firing rate estimation from PETH. Right column, Granger causality analysis for surrogate spike trains. C, D, Same analyses performed for a representative PC recording in relation to breathing.
We then used Granger causality analysis as described previously (Dhamala et al., 2008a,b) to determine whether differences in Granger causality from behavior to spike activity existed between the groups of ISIs. Granger causality resolves the frequency, and allows the determination of directionality in the flow of information between spikes and behavior. Granger causality analysis was applied to both Purkinje cell and surrogate data (Fig. 5). Granger causality between lick event series and PC spiking showed a strong peak at the main 6 Hz frequency of licking (Fig. 5A, right column). This peak was present when only short or only long ISIs were used in the analysis, but not for intermediate ISIs. Similarly, the Granger causality between breathing and PC spiking showed a peak at the main breathing frequency of 3 Hz for short and long intervals (Fig. 5C, right column). These findings were identical for the surrogate gamma-distributed spike trains (Fig. 5B,D, right column). In no case was a significant causality peak observed in the reverse direction (from spikes to behavior), suggesting that spiking from a single neuron does not let one determine the variability in behavioral event timing. Overall, the Granger causality data fully support the conclusion that the relationship between behavior and PC spike trains can be fully explained by behaviorally locked rate modulation in the latter. Figure 6 shows the group statistics for Granger causality peaks for five lick-related and five breathing-related data PC recordings and surrogate spike trains. This analysis shows that, consistently, the shortest ISIs showed the largest Granger causality peak at the behavioral event frequency, whereas intermediate ISIs showed no peaks above chance. An increase in peak size was consistently seen for the longest intervals both for recorded and surrogate data.
Figure 6.

Distribution of Granger causality peak values at different ISIs. Five recordings for each behavioral condition with a mean rate close to the overall mean rate were chosen for analysis. This selection ensured that all cases had a representative sample of the different ISI groups chosen. The causality peak distribution plots for recordings and the matched surrogate data are shown side by side. Each black asterisk corresponds to peak Granger causality value of ∼6–7 Hz for datasets associated with licking behavior and ∼3–4 Hz for datasets associated with breathing. The blue bar denotes the mean, and the vertical red line, the SD. The asterisks represent individual data points. The figure clearly shows that the causality prediction is high for short but not for intermediate ISIs, and again increases for long ISIs > 30 ms.
Discussion
It has been suggested that pauses in the high-frequency simple-spike activity of Purkinje cells play a special role in the neuronal representation of information (De Schutter and Steuber, 2009). Here, we asked whether long intervals or “pauses” in Purkinje cell simple-spike firing are more strongly correlated with or have a higher causal relationship to sensory-motor events than average or short interspike intervals. Purkinje cell activity recorded in awake mice during licking or respiratory behavior was analyzed to determine the representation of behavioral events in the simple-spike activity of Purkinje cells as a function of interspike interval durations. Precise temporal correlations of long ISIs with behavior were commonly observed in Purkinje cells showing behavior-related modulation of simple-spike rate. Analysis of surrogate spike trains, which emulated the rate modulations but not the individual timing, revealed the same relationship between ISIs of different durations and the two behaviors. Comparative cross-correlation and Granger causality analysis of surrogate and Purkinje cell data revealed that temporal correlations and Granger causality relationships between behavior and long ISIs or “pauses” in simple spikes followed the statistical expectation based on simple-spike rate modulations. In other words, long ISIs occurred with the highest probability during periods of low simple-spike activity and vice versa. Non-task-related Purkinje cells without behavior-related modulation of simple-spike activity showed no correlation between ISIs of any duration and the behavior.
The fact that ISIs of intermediate duration showed weak to no cross-correlation with or Granger causal relationship to licking or respiration behavior can be explained by the fact that these ISIs are similarly common during observed rate modulations, in which in one case they form a population of ISIs slower than the mean, and in the other case faster than the mean. Intermediate ISIs thus have little predictive value regarding the ongoing rate modulation.
Our results thus suggest that the occurrence of behavior-related long ISIs or pauses in simple-spike activity are a direct consequence of simple-spike rate modulation and not generated by a potential separate “pause code” process. However, our findings do not exclude the possibility of rate synchrony between Purkinje cells, which would result in large reductions in inhibitory input to DCN neurons; that in turn, provided a sufficient number of synchronized afferent Purkinje cells, would result in strong disinhibition. Also, precisely synchronized simple spikes in populations of Purkinje cells can control spike timing in DCN neurons without increasing or decreasing Purkinje cell firing rate (Aizenman and Linden, 1999; Gauck and Jaeger, 2000; Person and Raman, 2012) (for review, see De Zeeuw et al., 2011). However, such a mechanism would still argue for a rate-based representation of information rather than a separate pause code. It should be noted, however, that the behavior in our animals was not challenged and thus did not require adaptive learning, and motor adjustments to account for environmental challenges were probably minimal as well. Hence a specific relationship of pause coding to motor errors or adaptive processes remains possible.
The activity patterns observed by us are consistent with the findings by Schonewille et al. (2006), as we also failed to observe seconds-long interruptions of simple-spike activity described by others (Loewenstein et al., 2005; Yartsev et al., 2009). These differences are not easily explained. Loewenstein et al. (2005) performed their recordings in rodents but under anesthesia, which might affect Purkinje cell firing patterns (Antkowiak and Heck, 1997). Yartsev et al. (2009) recorded what they termed “pausing Purkinje cells” in awake behaving cats, excluding the possibility of any artifact due to anesthesia. It might thus be possible that “pausing Purkinje cells” exist in some species but not others or only in some specific parts of the cerebellum. In this and a previous study (Bryant et al., 2010), lick-related Purkinje cells were recorded in the vermis and hemispheres of the mouse cerebellum without observing pausing Purkinje cells. More and detailed investigations across different animal species under awake and behaving conditions will be required to determine under what circumstances Purkinje cells generate seconds-long pauses in spike firing.
In summary, our results suggest that the occurrence of pauses in simple-spike activity in awake behaving mice does not represent additional information about behavioral or sensory events but is rather fully explained by simple-spike rate modulations, at least with respect to rhythmic behaviors.
Footnotes
This work was supported by National Institutes of Health (NIH) Grants R01NS067201 (D.J.) and R01NS060887 (D.H.H.) and National Science Foundation (NSF) Grant BCS 0955037 (M.D.). We thank Michael Nguyen for excellent custom mechanical designs and Shuhua Qi for outstanding technical assistance. We also thank Dr. Shigeru Shinomoto for providing his MATLAB code for rate and regularity estimation. The content of this publication is solely the responsibility of the authors and does not necessarily represent the official views of the NIH and the NSF.
The authors declare no competing financial interests.
References
- Aizenman CD, Linden DJ. Regulation of the rebound depolarization and spontaneous firing patterns of deep nuclear neurons in slices of rat cerebellum. J Neurophysiol. 1999;82:1697–1709. doi: 10.1152/jn.1999.82.4.1697. [DOI] [PubMed] [Google Scholar]
- Antkowiak B, Heck DH. Effects of the volatile anaesthetic enflurane on spontaneous discharge rate and GABA A-mediated inhibition of Purkinje cells in rat cerebellar slices. J Neurophysiol. 1997;77:2525–2538. doi: 10.1152/jn.1997.77.5.2525. [DOI] [PubMed] [Google Scholar]
- Bryant JL, Roy S, Heck DH. A technique for stereotaxic recordings of neuronal activity in awake, head-restrained mice. J Neurosci Methods. 2009;178:75–79. doi: 10.1016/j.jneumeth.2008.11.014. [DOI] [PMC free article] [PubMed] [Google Scholar]
- Bryant JL, Boughter JD, Gong S, LeDoux MS, Heck DH. Cerebellar cortical output encodes temporal aspects of rhythmic licking movements and is necessary for normal licking frequency. Eur J Neurosci. 2010;32:41–52. doi: 10.1111/j.1460-9568.2010.07244.x. [DOI] [PMC free article] [PubMed] [Google Scholar]
- De Schutter E, Steuber V. Patterns and pauses in Purkinje cell simple spike trains: experiments, modeling and theory. Neuroscience. 2009;162:816–826. doi: 10.1016/j.neuroscience.2009.02.040. [DOI] [PubMed] [Google Scholar]
- De Zeeuw CI, Hoebeek FE, Bosman LW, Schonewille M, Witter L, Koekkoek SK. Spatiotemporal firing patterns in the cerebellum. Nat Rev Neurosci. 2011;12:327–344. doi: 10.1038/nrn3011. [DOI] [PubMed] [Google Scholar]
- Dhamala M, Rangarajan G, Ding M. Estimating Granger causality from Fourier and wavelet transforms of time series data. Phys Rev Lett. 2008a;100 doi: 10.1103/PhysRevLett.100.018701. 018701. [DOI] [PubMed] [Google Scholar]
- Dhamala M, Rangarajan G, Ding M. Analyzing information flow in brain networks with nonparametric Granger causality. Neuroimage. 2008b;41:354–362. doi: 10.1016/j.neuroimage.2008.02.020. [DOI] [PMC free article] [PubMed] [Google Scholar]
- Gauck V, Jaeger D. The control of rate and timing of spikes in the deep cerebellar nuclei by inhibition. J Neurosci. 2000;20:3006–3016. doi: 10.1523/JNEUROSCI.20-08-03006.2000. [DOI] [PMC free article] [PubMed] [Google Scholar]
- Geweke Measurement of linear dependence and feedback between multiple time series. J Am Stat Assoc. 1982;103:304–313. [Google Scholar]
- Granger CWJ. Investigating causal relations by economotric models and cross-spectral methods. Econometrica. 1969;37:424–438. [Google Scholar]
- Loewenstein Y, Mahon S, Chadderton P, Kitamura K, Sompolinsky H, Yarom Y, Häusser M. Bistability of cerebellar Purkinje cells modulated by sensory stimulation. Nat Neurosci. 2005;8:202–211. doi: 10.1038/nn1393. [DOI] [PubMed] [Google Scholar]
- Nedungadi AG, Rangarajan G, Jain N, Ding M. Analyzing multiple spike trains with nonparametric Granger causality. J Comput Neurosci. 2009;27:55–64. doi: 10.1007/s10827-008-0126-2. [DOI] [PubMed] [Google Scholar]
- Paxinos G, Franklin K. The mouse brain in stereotaxic coordinates. Ed 2. New York: Academic; 2001. [Google Scholar]
- Person AL, Raman IM. Purkinje neuron synchrony elicits time-locked spiking in the cerebellar nuclei. Nature. 2012;481:502–505. doi: 10.1038/nature10732. [DOI] [PMC free article] [PubMed] [Google Scholar]
- Schonewille M, Khosrovani S, Winkelman BH, Hoebeek FE, De Jeu MT, Larsen IM, Van der Burg J, Schmolesky MT, Frens MA, De Zeeuw CI. Purkinje cells in awake behaving animals operate at the upstate membrane potential. Nat Neurosci. 2006;9:459–461. doi: 10.1038/nn0406-459. author reply 461. [DOI] [PubMed] [Google Scholar]
- Shimokawa T, Shinomoto S. Estimating instantaneous irregularity of neuronal firing. Neural Comput. 2009;21:1931–1951. doi: 10.1162/neco.2009.08-08-841. [DOI] [PubMed] [Google Scholar]
- Thach WT. Discharge of cerebellar neurons related to two maintained postures and two prompt movements. II. Purkinje cell output and input. J Neurophysiol. 1970;33:537–547. doi: 10.1152/jn.1970.33.4.537. [DOI] [PubMed] [Google Scholar]
- Walter JT, Khodakhah K. The linear computational algorithm of cerebellar Purkinje cells. J Neurosci. 2006;26:12861–12872. doi: 10.1523/JNEUROSCI.4507-05.2006. [DOI] [PMC free article] [PubMed] [Google Scholar]
- Walter JT, Khodakhah K. The advantages of linear information processing for cerebellar computation. Proc Natl Acad Sci U S A. 2009;106:4471–4476. doi: 10.1073/pnas.0812348106. [DOI] [PMC free article] [PubMed] [Google Scholar]
- Welsh JP, Lang EJ, Suglhara I, Llinás R. Dynamic organization of motor control within the olivocerebellar system. Nature. 1995;374:453–457. doi: 10.1038/374453a0. [DOI] [PubMed] [Google Scholar]
- Xu F, Zhou T, Frazier DT. Purkinje cell degeneration elevates eupneic and hypercapnic ventilation in rats. Cerebellum. 2004;3:133–140. doi: 10.1080/14734220310023332. [DOI] [PubMed] [Google Scholar]
- Yartsev MM, Givon-Mayo R, Maller M, Donchin O. Pausing Purkinje cells in the cerebellum of the awake cat. Front Syst Neurosci. 2009;3:2. doi: 10.3389/neuro.06.002.2009. [DOI] [PMC free article] [PubMed] [Google Scholar]