

Abstract
Induced pluripotent stem cells (iPSC) offer an unprecedented opportunity to model human disease in relevant cell types, but it is unclear whether they could successfully model age-related diseases such as Parkinson's disease (PD). Here, we generated iPSC lines from seven patients with idiopathic PD (ID-PD), four patients with familial PD associated to the G2019S mutation in the Leucine-Rich Repeat Kinase 2 (LRRK2) gene (LRRK2-PD) and four age- and sex-matched healthy individuals (Ctrl). Over long-time culture, dopaminergic neurons (DAn) differentiated from either ID-PD- or LRRK2-PD-iPSC showed morphological alterations, including reduced numbers of neurites and neurite arborization, as well as accumulation of autophagic vacuoles, which were not evident in DAn differentiated from Ctrl-iPSC. Further induction of autophagy and/or inhibition of lysosomal proteolysis greatly exacerbated the DAn morphological alterations, indicating autophagic compromise in DAn from ID-PD- and LRRK2-PD-iPSC, which we demonstrate occurs at the level of autophagosome clearance. Our study provides an iPSC-based in vitro model that captures the patients' genetic complexity and allows investigation of the pathogenesis of both sporadic and familial PD cases in a disease-relevant cell type.
Keywords: autophagy, disease modeling, LRRK2 mutation, neurodegeneration, pluripotent stem cells
INTRODUCTION
Parkinson's disease (PD) is a common and devastating neurodegenerative disorder characterized by motor clinical manifestations, although non-motor features are also important in later stages of the disease (Lees et al, 2009; Obeso et al, 2010; Schapira & Tolosa, 2010). Movement alterations in PD stem from the selective loss of dopaminergic neurons (DAn) from the pars compacta of the substantia nigra, a specific subtype of neurons patterned as ventral midbrain DAn (vmDAn). Neuronal loss is typically progressive and accompanied by α-synuclein (SNCA)-containing intraneuronal inclusions known as Lewy bodies and Lewy neurites. While the majority of PD cases are sporadic, likely resulting from complex interactions among gene susceptibility and environmental factors, around 10% of patients present monogenic forms of the disease (Lesage & Brice, 2009). Pathogenic mutations in the Leucine-Rich Repeat Kinase 2 (LRRK2) and SNCA genes have been identified and associated to PD, while mutations in four genes (Parkin, DJ-1, PINK1 and ATP13A2) cause early onset parkinsonism (Lees et al, 2009). In particular, LRRK2 mutations cause an autosomal dominant, late-onset familial PD, whose clinical and pathological features are indistinguishable from those of the common, sporadic form of PD (Paisan-Ruiz et al, 2004; Zimprich et al, 2004). While over 50 variants have been identified throughout the different LRRK2 domains in PD patients, the mutation G2019S has been regarded as the most common cause of dominant familial PD and accounts for up to 2% of sporadic PD cases (Cookson, 2010).
The pathogenic mechanisms that lead to neurodegeneration in PD are not well understood, since current experimental PD models do not recapitulate key neuropathological features of the disease (Dawson et al, 2010). In particular, the special susceptibility of DAn to neurodegeneration and the progressive nature of this process in PD, together with the presence of Lewy bodies, have proven especially difficult to model in animal models of PD. The advent of induced pluripotent stem cell (iPSC) technology (Takahashi & Yamanaka, 2006) has made it possible to reprogram human somatic cells to pluripotency (Park et al, 2008b; Takahashi et al, 2007; Yu et al, 2007), thus enabling the generation of disease-specific iPSC (Lee & Studer, 2010). In this way, disease-relevant cell types have been generated from iPSC representing a variety of early onset diseases, and shown to display specific features of the disease in vitro (Carvajal-Vergara et al, 2010; Ebert et al, 2009; Ku et al, 2010; Lee et al, 2009; Marchetto et al, 2010; Moretti et al, 2010; Rashid et al, 2010; Raya et al, 2009; Zhang et al, 2011). Disease-specific iPSC have also been generated from sporadic cases of PD, but DAn differentiated from these cells did not show any conspicuous phenotype (Soldner et al, 2009), prompting uncertainty as to whether iPSC technology might be useful to model diseases of non-monogenic, complex etiology and/or late onset. Here, we generated iPSC lines from both idiopathic PD (ID-PD) and familial PD associated to the G2019S mutation in the LRRK2 gene (the most frequent cause of familial PD, Cookson, 2010), as well as from age- and sex-matched healthy individuals. We show that, over long-time culture, DAn differentiated from PD-iPSC display specific PD pathology related phenotypes and, thus, provide proof-of-concept for iPSC-based cellular models that capture PD patients' genetic complexity and allow investigation of the PD pathogenesis in disease-relevant cell types.
RESULTS
Generation of PD-specific iPS cell lines
We recruited a total of 15 individuals into this study: 7 patients diagnosed with ID-PD, with no family history of disease and no known PD-related mutations; 4 unrelated patients diagnosed with familial PD carrying the G2019S mutation in the LRRK2 gene (LRRK2-PD); and 4 healthy individuals with no history of neurological disease (Ctrl). Individuals in each group were also selected so that no significant bias in gender or age occurred (Table 1). Primary cultures of epidermal keratinocytes and dermal fibroblasts were established from all individuals and were used for reprogramming at passages 2–4. We used retroviral delivery of OCT4, KLF4 and SOX2 to generate 2–6 independent iPSC lines per individual, totalling 50 iPSC lines. Of those, 2 lines per patient were thoroughly characterized and shown to be fully reprogrammed to pluripotency, as judged by colony morphology and growth dynamics, sustained long-term passaging (>20 passages), karyotype stability, alkaline phosphatase (AP) staining, expression of pluripotency associated transcription factors (OCT4, SOX2, NANOG, CRIPTO and REX1) and surface markers (SSEA3, SSEA4, TRA1-60 and TRA1-81), silencing of retroviral transgenes, demethylation of OCT4 and NANOG promoters, in vitro pluripotent differentiation ability and generation of teratomas comprising derivatives of the three main embryo germ layers (Table 1 and Fig 1A–N).
Table 1.
Summary of iPSC lines generated
| Patient | Disease |
iPSC |
|||||||||||||
|---|---|---|---|---|---|---|---|---|---|---|---|---|---|---|---|
| Code | Sex | Agea | Age onset | Family history | Mutation | Initial symptomsb | LDopa response | # of Lines | Clones selected | Karyotype | Transgene silencingc | Pluripotency markersc | In vitro differentiationc | Teratoma assayc | |
| CONTROL | SP09 | M | 66 | 4 | SP09.2 | 46,XY | Passed | Passed | Passed | N/P | |||||
| SP09.4 | 46,XY | Passed | Passed | Passed | Passed | ||||||||||
| SP11 | F | 48 | 3 | SP11.1 | 46,XX | Passed | Passed | Passed | Passed | ||||||
| SP11.4 | 46,XX | Passed | Passed | Passed | N/P | ||||||||||
| SP15 | F | 47 | 4 | SP15.2 | 46,XX | Passed | Passed | Passed | Passed | ||||||
| SP15.3 | 46,XX | Passed | Passed | Passed | N/P | ||||||||||
| SP15.4 | 47,XX + 20 | Passed | Passed | N/P | N/P | ||||||||||
| SP17 | M | 52 | 3 | SP17.1 | 47,XY + 20 | Passed | Passed | Passed | N/P | ||||||
| SP17.2 | 46,XY | Passed | Passed | Passed | Passed | ||||||||||
| SP17.3 | 46,XY | Passed | Passed | Failed | N/P | ||||||||||
| ID-PD | SP01 | F | 63 | 58 | No | No | T and B | N/A | 4 | SP01.1 | 46,XX | Passed | Passed | Passed | Passed |
| SP01.4 | 46,XX | Passed | Passed | Passed | N/P | ||||||||||
| SP02 | M | 55 | 48 | No | No | T | N/A | 2 | SP02.1 | 46,XY | Passed | Passed | Passed | Passed | |
| SP02.2 | 46,XY | Passed | Passed | Passed | N/P | ||||||||||
| SP04 | M | 46 | 40 | No | No | B | Good | 2 | SP04.1 | 46,XY | Passed | Passed | Passed | N/P | |
| SP04.2 | 46,XY | Passed | Passed | Passed | Passed | ||||||||||
| SP08 | F | 66 | 60 | No | No | T | Good | 4 | SP08.1 | 46,XX | Passed | Passed | Passed | Passed | |
| SP08.2 | 46,XX | Passed | Passed | Passed | N/P | ||||||||||
| SP08.3 | 46,XX | Failed | N/P | N/P | N/P | ||||||||||
| SP10 | M | 58 | 50 | No | No | D | Good | 2 | SP10.1 | 46,XY | Passed | Passed | Passed | N/P | |
| SP10.2 | 46,XY | Passed | Passed | Passed | Passed | ||||||||||
| SP14 | M | 55 | 51 | No | No | B | Good | 2 | SP14.1 | 46,XY | Passed | Passed | Passed | Passed | |
| SP14.2 | 46,XY | Passed | Passed | Passed | N/P | ||||||||||
| SP16 | F | 51 | 48 | No | No | B | N/A | 4 | SP16.2 | 46,XX | Passed | Passed | Passed | Passed | |
| SP16.3 | 46,XX | Passed | Passed | Passed | N/P | ||||||||||
| LRRK2-PD | SP05 | M | 66 | 52 | Yes | LRRK2 | B | Good | 2 | SP05.1 | 46,XY | Passed | Passed | Passed | Passed |
| SP05.2 | 46,XY | Passed | Passed | Passed | N/P | ||||||||||
| SP06 | M | 44 | 33 | Yes | LRRK2 | T | Good | 6 | SP06.1 | 46,XY | Passed | Passed | N/P | N/P | |
| SP06.2 | 46,XY | Passed | Passed | Passed | Passed | ||||||||||
| SP12 | F | 63 | 49 | Yes | LRRK2 | T | Good | 4 | SP12.3 | 46,XX | Passed | Passed | Passed | Passed | |
| SP12.4 | 46,XX | Passed | Passed | Passed | N/P | ||||||||||
| SP13 | F | 68 | 57 | Yes | LRRK2 | T | Good | 4 | SP13.2 | 46,XX | Passed | Passed | Passed | N/P | |
| SP13.4 | 46,XX | Passed | Passed | Passed | Passed | ||||||||||
N/A, information not available; N/P, test not performed.
Age at biopsy.
T, tremor; B, bradykinesia; D, foot dystonia.
Tests performed as exemplified in Fig 1.
Figure 1. Generation and characterization of PD patient-specific iPSC lines.

A-C. Representative colonies of passage-20 LRRK2-PD-iPSC (cell line SP13.4) stained positive for the pluripotency-associated markers NANOG, OCT4 and SOX2 (green), TRA-1-81, SSEA3 and SSEA4 (red).
D-F. Immunofluorescence analyses of LRRK2-PD-iPSC (cell line SP13.4) differentiated in vitro show the potential to generate cell derivatives of all three primary germ cell layers including ectoderm (D, stained for TUJ1, green), endoderm (E, stained for α-fetoprotein, green, and FOXA2, red) and mesoderm (F, stained for smooth muscle actin, SMA, red).
G-I. Immunofluorescence analyses of sections from a teratoma induced by injecting LRRK2-PD-iPSC (cell line SP13.4), showing derivatives of the three main embryo germ layers: ectoderm (G, stained for TUJ1, green, and GFAP, red), endoderm (H, stained for α-fetoprotein, green, and FOXA2, red) and mesoderm (I, stained for SOX9, green, and chondroitin sulphate, CS, red). In (A–I) nuclei are counterstained with DAPI, shown in blue. Scale bars, 50 µm.
J. LRRK2-PD-iPSC (cell line SP13.4) stained for alkaline phosphatase (AP) activity.
K. Normal karyotype of LRRK2-PD-iPSC (cell line SP13.4) at passage 20.
L. Bisulphite genomic sequencing of the OCT4 and NANOG promoters showing demethylation in LRRK2-PD-iPSC (cell line SP13.4).
M. Southern blot analysis of LRRK2-PD-iPSC (cell line SP13.4) showing genomic integrations (asterisk) of the indicated retroviruses.
N. RT-qPCR analyses of the expression levels of retroviral-derived reprogramming factors (transgenic) and endogenous expression levels (endogenous) of the indicated genes in LRRK2-PD-iPSC (cell line SP13.4).
O. Direct sequence of genomic DNA from LRRK2-PD-iPSC (cell line SP13.4) identifying the LRRK2G2019S mutation.
The efficiency of iPSC generation varied among different individuals, but did not depend on the presence or type of disease, nor on the age of donors. Whereas, most of the iPSC lines analyzed met our criteria for bona fide pluripotent stem cells, those that failed to silence the reprogramming transgenes, did not differentiate appropriately in vitro, or presented karyotype alterations were identified and excluded from further studies (Table 1). Overall, iPSC generated from PD patients or from healthy individuals were indistinguishable in all tests performed, with the exception that LRRK2-PD iPSC lines carried the LRRK2G2019S mutation (Fig 1O).
Generation of PD-specific vmDA neurons
For the directed differentiation of iPSC towards vmDA neurons (the cell type most affected in PD), we used a 30-day protocol recently implemented in our laboratory that relies on lentiviral-mediated forced expression of the ventral midbrain determinant LMX1A, together with DA neuron patterning factors (Sanchez-Danes et al, 2012). All iPSC lines tested generated DAn using this differentiation protocol, as judged by co-staining with the neuron-specific class III-β-tubulin (TUJ1) and tyrosine hydroxylase (TH; Fig 2A–C). Moreover, DAn differentiated in this way were mature and mostly of the A9 subtype, as revealed by expression of dopamine transporter (DAT), G protein-activated inward rectifier potassium channel 2 (GIRK2) and FOXA2, respectively (Fig S1 of Supporting information). We found a large variability in the numbers of DAn obtained from different iPSC lines, ranging from 9 to 29% of all differentiated cells, which did not depend on the presence or type of disease (Fig 2D), nor on the efficiency of lentiviral infection (Fig S2 of Supporting information), but rather appeared to depend on the specific iPSC clone used (Fig S3 of Supporting information), consistent with previous results on differentiation to other neuronal lineages (Hu et al, 2010). Thus, our results so far confirm previous data on the similar ability of control and ID-PD iPSC to give rise to DAn (Soldner et al, 2009, 2011) and extend these findings to iPSC derived from LRRK2-PD patients.
Figure 2. Differentiation of DA neurons from PD patient-specific iPSC.

Ctrl-, ID-PD and LRRK2-PD iPSC were differentiated into DA neurons and analysed by immunofluorescence for expression of TUJ1 (green) and TH (red) at the end of the 30-day differentiation protocol.
A-C. All iPSC-derived neurons express TUJ1 and TH. Shown are representative images of differentiation experiments from Ctrl-iPSC (cell line SP11.1), ID-PD iPSC (cell line SP08.1) and LRRK2-PD iPSC (cell line SP06.2). Nuclei are counterstained with DAPI, shown in blue. Scale bars, 50 µm.
D. Quantitative analyses of cells stained positive for TUJ1 (left bars) or TUJ1 and TH (right bars). TUJ1-positive cells are represented as the percentage of total number of cells (stained with DAPI). Bars represent average with SEM as error bars. Data for CONTROL is the average of 4 iPSC lines, for ID-PD from 7 iPSC lines and LRRK2-PD from 4 iPSC. No significant differences were found in the ability of iPSC to generate neurons [F(2,12) = 0.953; p = 0.413] or DA neurons [F(2,12) = 0.679; p = 0.526] after 30 days of differentiation.
Spontaneous phenotypes of PD-specific vmDA neurons
Because SNCA is the main component of Lewy bodies, and immunolabelling with antibodies against SNCA has become the standard and most sensitive immunohistochemical method for the neuropathological diagnosis of PD (Lees et al, 2009), we first investigated whether SNCA could be detected in DAn differentiated from PD-specific iPSC. The majority of DAn differentiated from Ctrl-iPSC and ID-PD iPSC exhibited barely detectable levels of endogenous SNCA in their cytoplasm, while ∼20% of DAn showed cytoplasmic staining (Fig 3A, B and D). However, most DAn derived from LRRK2-PD iPSC exhibited diffuse cytoplasmic accumulations of SNCA (Fig 3C and D), which did not form obvious aggregates or inclusions. This finding is consistent with results from animal studies that reported post-translational regulatory interactions of mutant LRRK2 and SNCA (reviewed in Cookson, 2010). In this line, the accumulation of SNCA in our model of LRRK2-PD iPSC-derived DAn did not appear to depend on transcriptional regulation of SNCA expression, which was upregulated during DAn differentiation to a similar extent compared with Ctrl-iPSC- and ID-PD iPSC-derived cells (Fig S4 of Supporting information), which also showed similar LRRK2 levels (Fig S5 of Supporting information).
Figure 3. Abnormal SNCA accumulation in DA neurons from LRRK2-PD iPSC.
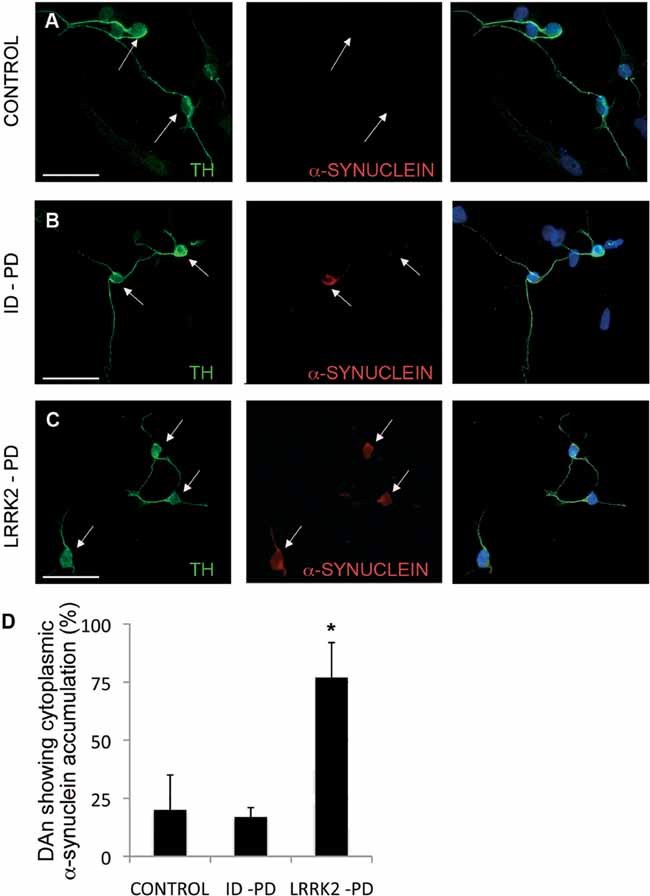
A-C. Immunofluorescence analyses of DA neurons after 30 days of differentiation from Crtl-iPSC (A), ID-PD iPSC (B) and LRRK2-PD iPSC (C), co-stained for TH (green) and SNCA (red). Arrows point to DA neurons, as identified by TH positive staining.
D. Quantitative analyses of DA neurons showing cytoplasmic accumulation of SNCA. Bars represent average with SEM as error bars. Data is the average of at least two-independent experiments using 3 Ctrl-iPSC lines, 4 ID-PD iPSC lines and 3 LRRK2-PD iPSC lines. The differences in the number of DA neurons showing accumulation of SNCA are statistically significant (asterisk) when comparing those derived from LRRK2-PD iPSC with either those from Ctrl-iPSC (p = 0.019) or from ID-PD iPSC (p = 0.002) [F(2,16) = 6.888; p = 0.007].
Since neuronal degeneration in PD patients takes decades to occur, we next attempted to maintain iPSC-derived DAn over longer culture times. For this purpose, we co-cultured them over a monolayer of mouse post-natal cortical astrocytes (Johnson et al, 2007), which supported viable cultures of vmDA neurons for up to 75 days (latest time point analysed, see Fig S6 of Supporting information). Under these conditions, Ctrl-iPSC gave rise to DAn that were morphologically homogeneous and showed the expected features of mature DAn, including complex dendritic arborizations (Fig 4A and F). However, DAn differentiated from ID-PD or LRRK2-PD iPSC developed a range of altered morphologies over long-term culture that were not evident at shorter time points (Fig S7 of Supporting information). After detailed analysis, we categorized the morphologies of individual DAn in these cultures in three types: type 1 were neurons with mature morphology and long neurites with complex arborization, similar to those differentiated from Ctrl-iPSC; type 2 DAn showed fewer and simpler processes, reminiscent of immature neurons; and type 3 were DAn with clear signs of degeneration, including very short or absent neurites, vacuolated soma, fragmented nucleus and positive staining for cleaved caspase-3 (Fig 4A–D and Fig S7 of Supporting information). In aged (∼75 days) cultures, most of DAn differentiated from ID-PD or LRRK2-PD iPSC were of altered type 2 or type 3 morphologies (Fig S7 of Supporting information), with a significant percentage of them undergoing apoptosis (Fig 4E).
Figure 4. Morphological alterations of PD-iPSC-derived DA neurons after long-term culture.
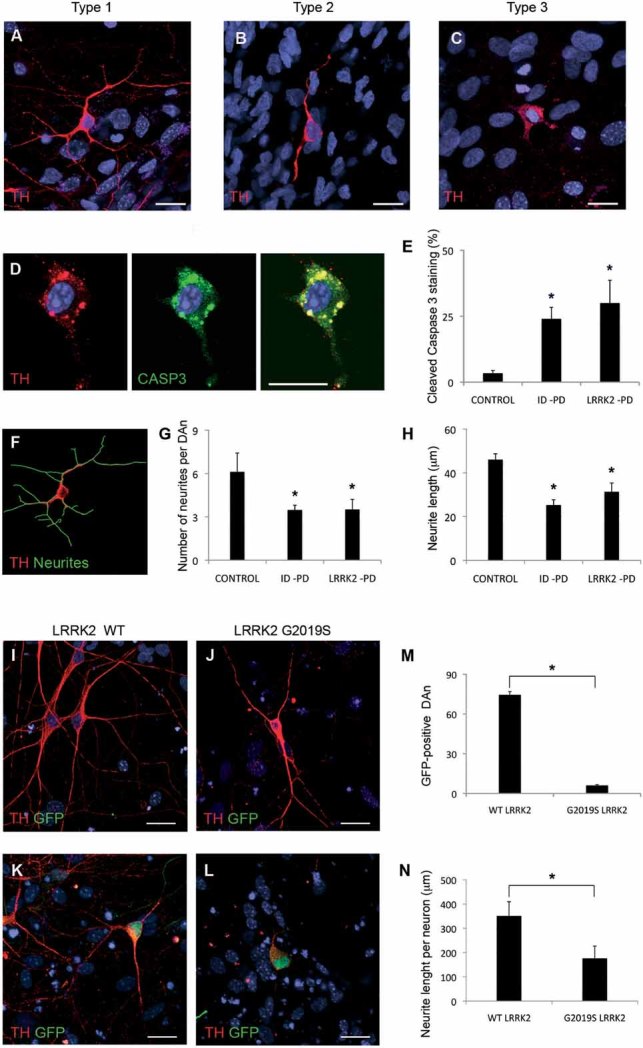
A-C. Immunofluorescence analyses of Ctrl-iPSC (cell line SP11.1, A), ID-PD iPSC (cell line SP08.1, B) and LRRK2-PD iPSC (cell line SP06.2, C), differentiated towards DA neurons and cultured for 75 days on cortical astrocytes, stained for TH (red). Images are representative of the three morphologies of DA neurons found under these conditions.
D. Immunofluorescence analysis of DA neurons differentiated from LRRK2-PD iPSC (cell line SP06.2) for 75 days, co-stained for TH (red) and cleaved caspase-3 (green). In A–D nuclei are counterstained with DAPI, shown in blue. Scale bar, 12.5 µm.
E. Quantitative analyses of the percentage of DA neurons differentiated for 75 days showing cleaved caspase-3 staining. Data for CONTROL is the average of 4 iPSC lines, for ID-PD from 7 iPSC lines and LRRK2-PD from 4 iPSC. Asterisks denote statistically significant differences between CONTROL and ID-PD (p = 0.004) or LRRK2-PD (p = 0.011) [F(2,12) = 5.668; p = 0.018].
F. Image of the same DA neuron shown in (A), with neurites outlined by green traces as processed by NIH ImageJ software.
G. Quantitative analyses of the number of neurites in DAn differentiated for 75 days. Data for CONTROL is the average of 87 DAn from 4 iPSC lines, for ID-PD is from 119 DAn from 7 iPSC lines and for LRRK2-PD is from 91 DAn from 4 iPSC. Asterisks denote statistically significant differences between CONTROL and ID-PD (p < 0.001) or LRRK2-PD (p < 0.001) [F(2,294) = 21.096; p < 0.001].
H. Quantitative analyses of the neurite length in DA neurons differentiated for 75 days. Data for CONTROL is the average of 540 neurites from 4 iPSC lines, for ID-PD is from 409 neurites from 7 iPSC lines and for LRRK2-PD is from 303 neurites from 4 iPSC. Asterisks denote statistically significant differences between CONTROL and ID-PD (p < 0.001) or LRRK2-PD (p < 0.001) [F(2,1249) = 42.161; p < 0.001]. (E, G and H) bars represent average with SEM as error bars.
I-L. DAn (TH positive, red) and GFP (green) from Ctrl-iPSC (SP11.1) co-transfected with plasmids encoding WT LRRK2 (WT, I and K) or mutant LRRK2G2019S (J and L) and GFP. (I and J) Images showing GFP negative DA neurons. (K and L) Co-transfected DA neurons being GFP positive. Nuclei are counterstained with DAPI, shown in blue. Scale bar, 12.5 µm.
M. Quantitative analysis of the number of GFP positive neurons present in co-transfected cells.
N. Quantitative analyses of the neurite length per neuron in co-transfected DAn. For (M and N) data are average of two-independent experiments using two different Ctrl-iPSC lines. Bars represent average with SEM as error bars. Statistically significant differences are indicated with asterisks (p = 0.003 in M; p = 0.006 in N).
To rule out any subjectivity that might have occurred in the adscription of different morphologies to iPSC-derived DAn, we also directly measured the number and length of neurites. For this, we used high-power confocal images of TH-stained single neurons, randomly chosen, differentiated from all the PD patient-specific and control iPSC lines and used software-assisted analysis (Fig 4F, see also Chu et al, 2009). These analyses confirmed that both the number and length of neurites of Ctrl-iPSC-derived DAn were significantly higher than those of DAn differentiated from ID-PD or LRRK2-PD iPSC (Fig 4G and H). The causative role of the genetic background of patient-specific cells was further investigated by ectopically expressing mutated LRRK2G2019S in DAn differentiated from Ctrl-iPSC. In these experiments, DAn differentiated for 65 days were co-transfected with plasmids encoding wild-type (WT) LRRK2 or LRRK2G2019S and GFP, and cells were analysed after 10 days. Even though the transfection efficiency (as evaluated by GFP/TH double positive cells) was low in all cases, we could readily detect DAn transfected with WT LRRK2, which were morphologically indistinguishable from untransfected DAn (Fig 4I–K and M). In contrast, few DAn transfected with mutant LRRK2G2019S were found after 10 days, suggesting that the expression of pathogenic LRRK2 is deleterious for these cells (Fig 4M). Indeed, surviving DAn expressing mutated LRRK2G2019S displayed evident morphological alterations, including fewer and shorter neurites compared to untransfected DAn or DAn expressing WT LRRK2 (Fig 4I–L and N). So far, our data show that, even though PD-specific iPSC differentiate normally into vmDA neurons, they display evident signs of morphological alterations upon long-time culture.
Impaired autophagy of PD-specific vmDA neurons
We next investigated the bases for the altered morphology and shorter/fewer neurites of PD iPSC-derived DAn compared to those differentiated from Ctrl-iPSC. Given that autophagy has been shown to play key roles for maintaining neurite length (reviewed in Chu et al, 2009) and that several lines of evidence indicate that dysregulated autophagy may be a pathogenic mechanism in PD (Menzies et al, 2011), we first analysed the autophagosome content in iPSC-derived DAn. For this purpose, we used immunofluorescence labelling with antibodies to the light chain type 3 protein (LC3), a marker of autophagosomes (Kabeya et al, 2000). After 75 days of culture, DAn differentiated from Ctrl-iPSC showed a diffuse cytoplasmic LC3 staining with very few autophagosomes (LC3-positive puncta, Fig 5A). In contrast, a marked increase in LC3-positive puncta was evident in untreated DAn differentiated from ID-PD or LRRK2-PD iPSC (Fig 5B–E). The fact that autophagosomes were evident even in the absence of inhibitors of lysosomal proteolysis in these neurons suggests either massive upregulation of autophagosome formation, or a compromise in the clearance of autophagic compartments in these cells. To distinguish between these possibilities, we compared levels of p62 in the three groups of cells. A large fraction of p62 undergoes degradation through autophagy because it serves as a cargo-recognizing protein that it is sequestered in autophagosomes along the cytosolic cargo. Immunostaining for p62 revealed a marked increase in the levels of this protein in DAn differentiated from ID-PD or LRRK2-PD iPSC, where it showed a punctuate pattern reminiscent of the one observed for LC3 (Fig 5F–J).
Figure 5. Alterations in autophagic clearance in DA neurons from PD patient-specific iPSC.

A-E. Immunofluorescence analyses of Ctrl-iPSC (cell line SP17.2, A), ID-PD iPSC (cell line SP16.2, B and C) and LRRK2-PD iPSC (cell line SP12.3, D and E), differentiated towards DA neurons and cultured for 75 days on cortical astrocytes, co-stained for LC3 (green) and TH (red). Images are representative of the most abundant morphologies of DA neurons found under these conditions.
F-J. Immunofluorescence analyses of Ctrl-iPSC (cell line SP17.2, F), ID-PD iPSC (cell line SP10.2, G and H) and LRRK2-PD iPSC (cell line SP06.2, I and J), differentiated towards DA neurons and cultured for 75 days on cortical astrocytes, co-stained for p62 (green) and TH (red). Images are representative of the morphologies of DA neurons found under these conditions. In A–J, nuclei are counterstained with DAPI, shown in blue. Scale bars, 35 µm.
K. Western blot analysis for LC3 in DA neuron cultures at 75 days of differentiation from the indicated iPSC lines, treated with leupeptin and NH4Cl during the indicated period of time. α-tubulin is used as a loading control.
L. Quantification analyses of the basal levels (treatment time = 0) of LC3-II relative to α-tubulin. Asterisks denote statistically significant differences between CONTROL and ID-PD (p = 0.003) and between CONTROL and LRRK2-PD (p = 0.046) [F(2,12) = 4.253; p = 0.046].
M. Quantification of LC3 flux normalized to α-tubulin. Asterisks denote statistically significant differences between CONTROL and ID-PD (p = 0.002) and between CONTROL and LRRK2-PD (p = 0.029) [F(2,12) = 9.614; p = 0.003].
N. Quantification of the autophagosome formation normalized to α-tubulin. No significant differences were found among groups [F(2,12) = 1.570; p = 0.248]. (L–N) Data per each group is the average of the blots shown in K. Bars represent average with SEM as error bars.
To directly analyse autophagic clearance we compared the rates of degradation of LC3-II in the different cells by immunoblot (LC3-flux assay), even though we were aware that neural-specific changes could be underestimated in this type of analysis, as DAn represent only a fraction of the cells present in whole-culture lysates. Part of the LC3 located in the inner membrane of the autophagosome is degraded along with the cargo when these compartments fuse to lysosomes, consequently the increase in levels of LC3-II upon blockage of lysosomal proteolysis provides information on autophagic clearance. As expected, immunoblot for LC3 confirmed an increase in basal steady-state levels of LC3-II in the PD-derived cells (Fig 5K and L). Blockage of lysosomal degradation resulted in an increase in LC3-II levels in all cells but, despite some level of individual variability, the autophagic flux was significantly reduced in PD-derived cells (Fig 5K and M). To separately analyse autophagosome formation independently of clearance, we also compared changes in LC3-II at two different times after blockage of lysosomal degradation (under these conditions, any increase in LC3-II would directly result from autophagosome formation as degradation is no longer occurring). Although we found a consistent trend for increased autophagosome formation in DAn differentiated from ID-PD or LRRK2-PD, when compared to Crtl-iPSC (Fig 5K and N), this increase was not statistically significant and clearly less pronounced that the changes observed on clearance. Our findings thus support that the marked increase in the abundance of these compartments in PD-iPSC-derived neurons when compared with control was due, for the most part, to blockage on their clearance.
Ultrastructural analysis by electron microscopy confirmed marked differences in the autophagic system between DAn differentiated from Ctrl-iPSC and those of PD origin. As shown in Fig 6A–C, autophagic vacuoles were in general more abundant in the PD groups. In control cells, most of the autophagic profiles corresponded to autophagolysosomes (autophagic vacuoles already fused to lysosomal compartments; Fig 6A and D). In contrast, in the case of the ID-PD and LRRK2-PD, autophagosomes (prior to lysosomal fusion) were predominant (Fig 6B–D), supporting that the increase in LC3-positive structures is likely due to problems in the maturation of autophagosomes. An increase in intracellular lipid droplets, previously shown to undergo degradation by macroautophagy (Singh et al, 2009), and the presence of dilated ER in the PD cells are also common features of cells with compromised autophagy (Fig 6B, C and E).
Figure 6. Autophagic system in iPSC-derived neurons.
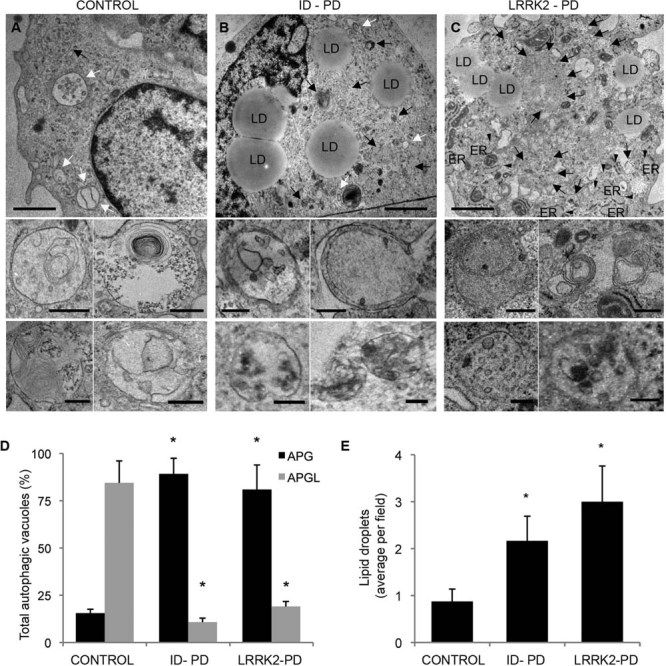
A-C. Ultrastructure of DA neurons at 75 days of differentiation from Ctrl-iPSC (A), ID-PD iPSC (B) and LRRK2-PD (C) iPSC. Lower inserts show higher magnification images to illustrate individual examples of autophagic vacuoles. Black arrows: autophagosomes; white arrows: autophagolysosomes; arrowheads: dilated ER; LD: lipid droplets. Scale bars: 0.5 µm (top) and 0.2 µm (bottom).
D. Percentage of autophagosomes (APG) and autophagolysosomes (APGL) relative to the total amount of autophagic vacuoles per field. Asterisks denote statistically significant differences in the percentage of autophagosomes [F(2,16) = 28.274; p < 0.001] and of autophagolysosomes [F(2,16) = 8.894; p = 0.003] between CONTROL and ID-PD (autophagosomes, p < 0.001; autophagolysosomes, p = 0.003), and between CONTROL and LRRK2-PD (autophagosomes, p = 0.003; autophagolysosomes, p = 0.010).
E. Content of lipid droplets per field. Asterisks denote statistically significant differences [F(2,16) = 28.274; p < 0.001] between CONTROL and ID-PD (p = 0.010), and between CONTROL and LRRK2-PD (p = 0.013). Bars represent average with SEM as error bars (n = 4–8).
Lastly, defective autophagosome clearance was also confirmed analyzing the co-localization of autophagosome (LC3) and lysosomal (LAMP-1) markers in DAn differentiated from ID-PD, LRRK2-PD or Crtl-iPSC. The very low levels of LC3 puncta detected in basal conditions in the control cells (Fig S8 of Supporting information) precluded evaluating LC3/LAMP-1 co-localization in these cells. To be able to compare the autophagic flux among the three groups of cells, we reduced degradation of LC3 in lysosomes by treatment with leupeptin (which does not modify autophagosome/lysosome fusion). Under these conditions, we detected a significantly lower level of LC3/LAMP-1 co-localization in both ID-PD and LRRK2-PD iPSC-derived DAn, when compared to control cells (Fig 7A–D). These results confirm compromised maturation of autophagosomes into autophagolysosomes in these cells.
Figure 7. Defective autophagosome clearance in PD-iPSC-derived DA neurons.

A-C. DAn (TH positive, white) cultured on astrocytes for 75 days stained for LC3 (green) and LAMP1 (red) after 6 h of treatment with leupeptin from CONTROL (cell line SP11.1, A), ID-PD (cell line SP10.2, B) and LRRK2-PD (cell line SP05.1, C) iPSC. Z-stack views are shown on the merged images (right panels). Nuclei are counterstained with DAPI, shown in blue. Scale bars, 5 µm.
D. Quantitative analyses of the colocalization of LAMP1 and LC3. Data for each group is the average of 15, 15 and 14 DAn representing three different Ctrl-, ID-PD and LRKK2-PD iPSC lines, respectively. Asterisks denote statistically significant differences between CONTROL and ID-PD (p < 0.001) or LRRK2-PD (p < 0.001) [F(2,41) = 41.628; p < 0.001].
E. Quantitative analyses of the total neurite length per neuron with or without treatment with rapamycin and leupeptin. Under basal conditions (without treatment), data for CONTROL is the average of 97 DAn from 4 iPSC lines, for ID-PD is from 127 DAn from 7 iPSC lines and for LRRK2-PD is from 80 DAn from 4 iPSC lines. After treatment with rapamycin and leupeptin (RAPA + LEUP), data for CONTROL is the average of 60 DAn from 4 iPSC lines, for ID-PD is from 112 DAn from 7 iPSC lines and for LRRK2-PD is from 74 DAn from 4 iPSC lines. Asterisks above data bars denote statistically significant differences under basal conditions [F(2,301) = 5.886; p = 0.003] between CONTROL and ID-PD (p = 0.003), and between CONTROL and LRRK2-PD (p = 0.022), and after treatment with rapamycin and leupeptin [F(2,243) = 48.812; p < 0.001] between CONTROL and ID-PD (p < 0.001), and between CONTROL and LRRK2-PD (p < 0.001). Asterisks comparing data sets denote statistically significant differences in total neurite length after treatment with rapamycin and leupeptin in DAn from ID-PD (p = 0.001) and LRRK2-PD (p < 0.001), but not from CONTROL (p = 0.090). In (D–E) bars represent average with SEM as error bars.
To evaluate whether morphological alterations and autophagy defects in DAn were mechanistically linked, we next reproduced in Ctrl-iPSC-derived DAn the blockage of autophagic clearance observed in ID-PD and LRRK2-PD iPSC, by inducing autophagosome formation through mTOR inhibition with rapamycin and, at the same time, blocking lysosomal degradation with leupeptin. This treatment resulted in ∼20% of Ctrl-iPSC-derived DAn showing higher number of autophagosomes, which stained positive for LC3 as well as for LAMP-1 (Fig S9 of Supporting information). This combined treatment had an even more marked effect in DAn differentiated from ID-PD or LRRK2-PD iPSC. In either case, rapamycin/leupeptin treatment induced a significant shortening in the average total neurite length of DAn (Fig 7E). Importantly, the increased susceptibility of ID-PD and LRRK2-PD iPSC-derived DAn to rapamycin/leupeptin treatment appeared to be cell type-specific, since patients' fibroblasts showed an increase of LC3-positive puncta and changes in LC3 levels comparable to control cells upon this treatment (Fig S10 of Supporting information), further supporting that the compromise in autophagosome clearance may be specific for DAn. These results indicate that DAn differentiated from either ID-PD or LRRK2-PD iPSC have a deficient competence for autophagic clearance compared with Ctrl-iPSC-derived DAn, and suggest that the PD pathology related phenotypes revealed in our in vitro model are caused, at least in part, by an impairment in the autophagy pathway.
DISCUSSION
In this study, we describe the generation and characterization of a collection of iPSC lines representing age- and sex-matched patients of sporadic and LRRK2-associated PD, as well as control individuals. Consistent with previous studies describing the generation of patient-specific iPSC in the context of PD (Park et al, 2008a; Soldner et al, 2009, 2011) or other conditions (Dimos et al, 2008; Park et al, 2008a; Raya et al, 2010), the efficiency of iPSC generation varied among different individuals, but did not depend on the presence or type of disease, nor on the donor age. We chose retroviral delivery of reprogramming transgenes to secure the derivation of iPSC lines from valuable biopsy material, because of the higher efficiency of this system in our hands compared to that of lentivirus-based systems. A clear advantage of the latter is the possibility of using inducible excisable lentivirus (Soldner et al, 2009), so that iPSC are free of reprogramming transgenes. However, we reasoned that a careful analysis of the silencing of integrated transgenes in our iPSC lines, together with the generation of independent iPSC lines from several patients representing each condition, would rule out any confounding effects due to residual transgene expression in individual iPSC lines, while still allowing a high efficiency of iPSC generation. In any case, we omitted c-MYC from the reprogramming cocktail due to the possibility of its interaction with LRRK2 in the context of eukaryotic initiation factor 4E (eIF4E) function regulation (Imai et al, 2008; Ruggero et al, 2004).
All the iPSC lines tested in our study were competent to give rise to DAn, although the efficiency at which they did so varied among lines. Similar findings have been reported for iPSC in a variety of differentiation protocols, including neuronal lineages other than DAn (Hu et al, 2010), cardiomyocytes (Zhang et al, 2009) and haematopoietic cells (Woods et al, 2011). Importantly, the variability in differentiation efficiency of our iPSC lines was independent of the presence or type of disease, indicating inter-line variation, rather than a result of the disease. Moreover, DAn differentiated from Ctrl- or PD-iPSC appeared morphologically and phenotypically indistinguishable after 30 days in culture, in agreement with a previous report that analysed the DAn differentiation ability of IP-PD iPSC (Soldner et al, 2009), and extending these findings to iPSC derived from LRRK2-PD patients. Despite this similarity, we found anomalous accumulation of SNCA in DAn differentiated from LRRK2-PD iPSC, compared to those from Ctrl- or ID-PD iPSC. The identification of this PD-related phenotype in LRRK2 mutant DAn is consistent with the notion that LRRK2 and SNCA may participate in intersecting pathways (reviewed in Cookson, 2010), and with the fact that LRRK2 can accelerate mutant SNCA-induced neuropathology in mice in a dose-dependent manner (Lin et al, 2009). Moreover, these results demonstrate the ability of iPSC-based cellular systems to recapitulate PD-related pathology and to model a monogenic form of PD.
Probably the most significant finding of our work is the identification of spontaneous phenotypes in long-term cultures of DAn from both idiopathic and LRRK2-associated PD. To our knowledge, this is the first time such phenotypes have been described. Indeed, Soldner and colleagues did not find any differences between DAn differentiated from ID-PD iPSC and from control iPSC (Soldner et al, 2009), a fact that they attributed to the short time span of cultured neurons (32–42 days). Moreover, these authors suggested that additional manipulations might be necessary to accelerate PD-pathology related phenotypes in iPSC-derived DAn in vitro, such as increasing oxidative stress, challenge with neurotoxins or overexpressing PD-related genes (Soldner et al, 2009). Thus, it may not appear entirely unexpected that DAn differentiated from our LRRK2-PD iPSC displayed PD-related alterations in vitro. However, during the writing of this manuscript, a study was published that found no alterations in DAn differentiated from iPSC from one LRRK2-PD patient, unless these were challenged with H2O2, 6-hydroxydopamine (a PD-related neurotoxin) or MG-132 (proteasome inhibitor; Nguyen et al, 2011). We believe that the lack of spontaneous PD pathology-related phenotypes in previous iPSC-based models of ID-PD (Soldner et al, 2009) and LRRK2-PD (Nguyen et al, 2011), in contrast with our results presented here, may be due to at least two reasons: First, the longer time span of cultured neurons (up to 75 days) in our experiments, which may have induced culture-related stress conditions mimicking in vivo aging in PD patients, and thus accelerated the development of PD-related phenotypes in vitro. In support of this, we found that DAn differentiated for 30 days from ID-PD- or LRRK2-PD iPSC, a time when no alterations (other than SNCA accumulation in LRRK2-PD iPSC-derived DAn) were evident, showed increased susceptibility to sub-lethal concentrations of the PD-related toxin MPP+ (Fig S11 of Supporting information). Thus, it is likely that the prolonged culture of these cells in our 75-day differentiation protocol served to amplify the intrinsic susceptibility of PD-iPSC-derived DAn to undergo neurodegeneration in response to aging, the most important PD-related susceptibility factor. Second, it should be noted that the majority of iPSC-derived neurons in our experiments were of vmDA neuron phenotype, whereas, this cell population was much rarer in previous studies, with Soldner and colleagues reporting ∼10% of DAn (TH+/TUJ1+ cells) of a phenotype that was not examined in detail (Soldner et al, 2009), and Nguyen and colleagues reporting less than 1% of neurons of a vmDA phenotype (Nguyen et al, 2011). We believe that the enrichment of vmDA neuron in our experiments facilitated the identification of PD pathology-related phenotypes, which are known to affect preferentially this specific subtype of DAn.
Our iPSC-based PD model should help investigating the pathogenic mechanisms that underlie PD neurodegeneration. Thus, although several lines of evidence suggest a causal link between impaired autophagy and the development of PD-related pathology, definitive proof for this has been elusive (reviewed in Yang & Mao, 2010). Our findings of defective autophagosome clearance in DAn from PD patient-specific iPSC, together with the positive correlation between the expansion of the autophagic compartment and the degree of morphological alterations in these cells, provide strong support for this hypothesis. In addition, the iPSC-based PD model described here should also prove an invaluable tool to investigate early functional alterations that predate the onset of neurodegeneration, which surely will help identifying potentially new therapeutic targets for the prevention, rather than rescue, of PD-related neurodegeneration.
Overall, our studies demonstrate the potential of iPSC-based technology to experimentally model the pathogenic mechanisms of late-onset diseases such as PD. Not only did we find PD pathology related phenotypes in long-term cultures of DAn representing a monogenic form of PD, but also in those from patients of ID-PD. This critical point indicates that the cause for the increased susceptibility of ID-PD-derived DAn to undergo degeneration in vitro after long-time culture, albeit complex, is encoded in the genome of ID-PD patients, or at least of those tested in our study. Therefore, intrinsic cell-autonomous factors, rather than environmental influences, appear to be sufficient to trigger neurodegeneration of DAn from PD patients, in a process that requires time to manifest itself, but that can be modelled within the time-frame of in vitro experiments. We believe that key aspects to the success of our strategy were the efficient differentiation of the PD relevant cell type, the ability to maintain DAn cultures over a long-term culture span and the use of multiple patients per condition, which allowed controlling the inherent variability of human pluripotent stem cell lines. In this way, we have identified in vitro phenotypes associated with ID and/or LRRK2 PD, which could be harnessed as readouts for drug screening studies. Our findings provide important conceptual and technical advances for the understanding of PD pathogenesis and, eventually, for the identification of novel therapeutic strategies in this disease.
MATERIALS AND METHODS
Description of PD patients
Studies were approved by the authors' Institutional Review Board and conducted under the Declaration of Helsinki. Patients were encoded to protect their confidentiality, and written informed consent obtained. The generation of human iPS cells was done following a protocol approved by the Spanish competent authorities (Commission on Guarantees concerning the Donation and Use of Human Tissues and Cells of the Carlos III Health Institute). PD was diagnosed according to UK Brain Bank criteria (Hughes et al, 1992). We identified subjects participating in the study among patients attending the outpatient Movement Disorder Unit at the Hospital Clinic of Barcelona (Barcelona, Spain). Four patients were known from previous studies to have LRRK2-associated PD. The remaining seven patients had a sporadic form of PD and LRRK2 mutation was excluded by direct DNA sequencing. Healthy controls were recruited among patients' spouses.
Generation of iPSC
Epidermal keratinocytes were used for iPSC generation, except for patients SP05 and SP09, for whom dermal fibroblasts were used. Keratinocytes were cultured in serum-free low calcium medium (Epilife, Invitrogen) and reprogrammed using a 1:1:1 mix of retroviruses encoding FLAG-tagged OCT4, SOX2 and KLF4, essentially as previously described (Aasen et al, 2008). Fibroblasts were reprogrammed using a 1:1:1 mix of retroviruses encoding FLAG-tagged OCT4, SOX2 and KLF4, following a previously described protocol (Raya et al, 2010). For selecting reprogrammed cells, the medium was changed to human ES cell (hESC) medium, consisting of KO-DMEM (Invitrogen) supplemented with 20% KO-Serum Replacement (Invitrogen), 2 mM Glutamax (Invitrogen), 50 µM 2-mercaptoethanol (Invitrogen), non-essential aminoacids (Cambrex) and 10 ng/ml bFGF (Peprotech). Cultures were maintained at 37°C, 5% CO2, with media changes every other day. Colonies were picked based on morphology 45–60 days after the initial infection and plated onto fresh feeders. Lines of patient-specific iPS cells were maintained by mechanical dissociation of colonies and splitting 1:3 onto feeder cells in hESC medium or by limited trypsin digestion and passaging onto Matrigel-coated plates with hESC medium pre-conditioned by mouse embryonic fibroblasts. The iPSC lines generated and characterized in this study are currently in the process of being registered and deposited in the Spanish Stem Cell Bank, through which they will be made available to interested researchers.
Characterization of iPSC lines
Expression of retroviral transgenes and endogenous pluripotency-associated transcription factors by quantitative Polymerase Chain Reaction (after reverse transcription) (RT-PCR), integration of retroviral transgenes by Southern blot and methylation status of OCT4 and NANOG promoters were assessed as previously reported (Aasen et al, 2008). In vitro differentiation towards endoderm, mesoderm and neuroectoderm was carried out essentially as described (Raya et al, 2008). Severe combined immunodeficient (SCID) beige mice (Charles River Laboratories) were used to test the teratoma induction capacity of patient-specific iPS cells essentially as described (Aasen et al, 2008). All animal experiments were conducted following experimental protocols previously approved by the Institutional Ethics Committee on Experimental Animals, in full compliance with Spanish and European laws and regulations.
iPSC differentiation to DA neurons
For DAn differentiation, iPSC were transduced with LV.NES.LMX1A.GFP and processed as previously described (Sanchez-Danes et al, 2012). For DAn yield analysis cells were co-cultured with PA6 for 3 weeks in N2B27 medium. For SNCA and LRRK2 staining, DAn generated on the top of PA6 for 3 weeks were trypsinized and cultured for 3 days on Matrigel-coated dishes. For long-term culture, neural progenitor cells were seeded onto mouse primary cortical astrocytes, prepared as described elsewhere (Giralt et al, 2010), and maintained in N2B27 medium. After 9 weeks, some wells were incubated with 4 µM rapamycin (LC Labs) and/or 100 µM leupeptin (Sigma) for 6 h prior to fixation. For LC3 flux studies in DAn, neurons differentiated on murine astrocytes for 9 weeks were treated for 2 and 4 h with lysosomal inhibitors NH4Cl (20 mM, Sigma) and leupeptin (200 µM) in N2B27 media. After the treatment a pellet was obtained using a cell scraper (BD).
Expression of wild-type or mutant LRRK2 in DAn
DAn differentiated on top of murine astrocytes were grown on coverslips and transfected at day 65 of the differentiation protocol. The transfection was done as described previously (Kaech & Banker, 2006). Briefly, transfection media consisting on 200 µl of MEM media (Invitrogen), 5 µl lipofectamine 2000 (Invitrogen), 1 µg of plasmids encoding WT LRRK2 or mutant LRRK2G2019S (kindly provided by Giorgio Rovelli, Novartis Pharma Ltd, Basel, Switzerland, and Philipp Kahle, Hertie Institute for Clinical Brain Research, University Clinics Tübingen, Germany) and 0.25 µg pmaxGFP plasmid (Lonza) was prepared. The media was aspirated from the wells and in each coverslip containing the DAn culture 200 µl of transfection media was added and incubated for 4 h at 37°C followed by replacement (two times) with fresh N2B27 media. GFP positive cells started to appear 2 days after transfection.
Immunohistochemistry
Cells were fixed with 4% paraformaldehyde in PBS at 4°C for 10 min and permeabilized for 15 min in 0.5% Triton in PBS. Cells were then blocked in Triton-X100 with 3% donkey serum for 2 h. The following antibodies were used: mouse anti-Tra-1-81 (Chemicon, MAB4381, 1:100), rabbit anti-Sox2 (Chemicon, AB5603, 1:500), mouse anti-SSEA-4 (MC-813-70, 1:2) and mouse anti-SSEA-3 (MC-631, 1:2) from the Developmental Studies Hybridoma Bank at the University of Iowa, mouse anti-SMA (Sigma, 1:400), mouse anti-Tuj1 (Covance, 1:500), mouse Oct-3/4 (Santa Cruz, 1:100), rabbit anti-α-fetoprotein (Dako, 1:400), goat anti-Nanog (Everest Biotech; 1:100), goat anti-FoxA2 (R&D Biosystems, 1:100), rabbit anti-TH (Sigma, 1:1000), mouse anti-TH (Chemicon, MAB5280, 1:1000), rabbit anti-Girk2 (Sigma, 1:40), rat anti-DAT (Chemicon, MAB369, 1:400), rabbit anti-cleaved Caspase-3 (Cell Signalling, 1:400), rabbit anti-LC3 (Cell Signalling, 1:100), mouse anti-LAMP1 (U. Iowa Developmental Hybridoma Bank, 1:100), rabbit anti-p62 (Enzo Life Sciences, 1:200), chicken anti-GFP (Aves Labs, 1: 500), rabbit anti-LRRK2 (MJFF C41-2, kindly provided by MJFF, 1:100), mouse anti-chondroitin sulphate (Sigma, 1:400), rabbit anti-Nurr1 (Santa Cruz, 1: 50) and mouse anti-SNCA (Ab-2, Thermo Scientific, 1:1000). Secondary antibodies used were all the Alexa Fluor Series from Invitrogen (all 1:500). Images were taken using Leica SP5 confocal microscope. For quantification of the DAn yield randomly 300 cells per differentiated aggregate were counted (average 6–8 differentiated aggregates per experiment). Data points represent the average of at least three-independent experiments. To visualize nuclei, slides were stained with 0.5 µg/ml DAPI (4′,6-diamidino-2-phenylindole) and then mounted with PVADABCO. Direct AP activity was analysed using an AP blue/red membrane substrate solution kit (Sigma) according to the manufacturer's guidelines.
Neurite analysis
Neurite analysis was performed at the indicated time-points on iPSC-derived neurons differentiated on top of cortical mouse astrocytes fixed and stained for TH. We randomly selected a minimum of 20 DAn per iPSC line (on the only condition that were isolated from surrounding DAn, so that we could unambiguously ascribe neurites to a single DAn), using a Leica SP5 confocal microscope, and analysed with the ImageJ plugin NeuronJ to determine the number and length of neurites per cell.
Fibroblast culture and treatment for autophagy studies
Fibroblasts from all patients were cultured in IMDM (Invitrogen) supplemented with 10% FBS (Gibco) and 2 mM Glutamax (Invitrogen). Fibroblasts were grown until reaching 65–75% confluence, when they were used as controls or treated for 6 h with rapamycin (0.2 or 2 µM) and 100 µM leupeptin. After the treatment, some cells were fixed and analysed by immunofluorescence for LC3 and the rest was processed as a pellet for Western blot analysis for LC3. For LC3 flux studies in fibroblasts, cells were treated for 2 and 4 h in supplemented IMDM containing lysosomal inhibitors, consisting in 20 mM NH4Cl (Sigma) and 200 µM leupeptin, after the treatment a pellet was obtained using 0.25% trypsin–EDTA.
Protein extraction and Western blotting
Proteins were extracted using RIPA protein extraction buffer (Sigma) supplemented with protease inhibitor (Sigma) and phosphatase inhibitor cocktails (Sigma). In brief, cells were detached from culture dishes, centrifuged and washed once with cold PBS. Cell pellets were then resuspended and incubated in RIPA buffer for 20 min on ice and sonicated in one pulse of 5 s at 10% amplitude on ultrasonicator (Branson Digital Sonifier, Branson Ultrasonics Corporation, Danbury, CT, USA) to ensure high efficiency of lysis. After centrifugation, supernatants of total protein extracts were denatured in loading buffer for 10 min at 98°C. Proteins were separated using SDS–polyacrylamide gel electrophoresis (SDS–PAGE) and transferred to PVDF membrane. The membrane was probed with anti-α-tubulin (Sigma T6074; 1:10,000), anti-LC3 (Cell Signalling; 1:1000) and anti-LRRK2 (MJFF2 c41-2; 1:50).
Electron microscopy and morphometric analysis
Cells were fixed in 2.5% gluteraldehyde/2% paraformaldehyde in 100 mM sodium cacodylate, pH 7.43 (SC) and post-fixed in 1% osmium tetroxide in SC followed by 1% uranyl acetate. After ethanol dehydration and embedding in LX112 resin (LADD Research Industries), ultrathin sections were stained with uranyl acetate followed by lead citrate. All grids were viewed on a JEOL 100CX II transmission electron microscope at 80 kV. Morphometric analysis was performed using ImageJ in 15–20 different micrographs for each condition after thresholding. Autophagic vacuoles were identified using previously established criteria (Dunn, 1990; Nixon et al, 2005). Autophagic vacuoles (vesicles <0.5 µm) were classified as autophagosomes when they met two or more of the following criteria: double membranes (complete or at least partially visible), absence of ribosomes attached to the cytosolic side of the membrane, luminal density similar to cytosol and identifiable organelles or regions of organelles in their lumen. Vesicles of similar size but with a single membrane (or less than 40% of the membrane visible as double), luminal density lower than the surrounding cytosol, multiple single membrane-limited vesicles containing light or dense amorphous material were classified as autophagolysosomes.
The paper explained
PROBLEM
Parkinson's disease (PD) has a lifetime risk of 2%, making it the second most common neurodegenerative disease after Alzheimer's disease. It is associated to a selective loss of dopaminergic neurons (DAn) from the substantia nigra pars compacta responsible for controlling body movement. Around 90% of PD cases are sporadic, while 10% have a familial or genetic origin, of which mutations in the LRRK2 gene are the most frequent cause. The pathogenic mechanisms leading to PD are not well understood, to a large extent owing to the lack of suitable genetic models of this disease in animals. Therefore, there is an urgent need for developing reliable experimental models that recapitulate the salient features of PD. Recently, induced pluripotent stem cells (iPSC) have been used to model human diseases, although it is currently unclear if this approach would be able to model age-related diseases.
RESULTS
We generated iPSC from sporadic PD patients, PD patients with LRRK2 mutation and healthy controls. All of these iPSC lines were comparable in their ability to generate DAn, and no major differences were found in these neurons under conventional culture conditions, except for increased accumulation of SNCA in neurons from LRRK2 mutant iPSC. However, when cultured for over 2.5 months (a condition mimicking aging in vitro), DAn differentiated from patient-specific iPSC developed evident signs of neurodegeneration, including fewer and shorter neurites and a significant increase in apoptotic cells. Most importantly, this degeneration occurred in neurons from either sporadic PD or mutant PD, but not from healthy individuals. We then show that these alterations are caused by a deficient autophagic machinery.
IMPACT
We have generated an iPSC-based model for PD that recapitulates key pathological features of PD such as neurodegeneration and SNCA accumulation in DAn generated from PD-patients. Our findings indicate that the bases of the increased susceptibility of DAn to degenerate upon aging in sporadic PD patients should be encoded in their genome. Moreover, our iPSC-based PD model provides a valuable tool to investigate the pathogenic mechanisms of PD, such as altered autophagy, and to screen for drugs that may prevent or rescue neurodegeneration in PD.
RT-qPCR analyses
Total mRNA was isolated by guanidinium thiocynate–phenol–chloroform extraction (TRIzol, Invitrogen) and treated with DNaseI. One microgram was used to synthesize cDNA with the SuperScript III Reverse Transcriptase Synthesis Kit (Invitrogen). Quantitative PCR analyses were done in triplicate on 50 ng with Platinum Syber Green qPCR Super Mix (Invitrogen) in an ABI Prism 7000 thermocycler (Applied Biosystems). All results were normalized to HPRT and β-2-microglobulin. The primers used were: B2micro-F, 5′-GCCGTGTGAACCATGTGACT-3′; B2micro-R, 5′-GCTTACATGTCT CGATCCCACTT-3′; HPRT-F, 5′-TTATGGACAGGACTGAACGTCTTG-3' HPRT-R, 5′-GCACACAGAGGGCTACAATGTG-3′; NANOG-F, 5′-ACAACTGGCCGAAGAATA GCA-3′; NANOG-R, 5′-GGTTCCCAGTCGGGTTCAC-3′; FOXA2-F, 5′-AGACTCCTGC TTCTTCAAGCACCT-3′; FOXA2-R, 5′-ACTTCCCTGCAACAACAGCAATGG-3′; LRRK2-F, 5′-GGGAGCAGATGCCAATCAAGCAAA-3′; LRRK2-R, 5′-TCCACCAATTT GGGACTGCTCTCT-3′; SNCA-F, 5′-AGCGGACCTCCACAAGTAACGAAT-3′; SNCA-R, 5′-TTGGCATCTGTCTTCCTCCCAAGT-3′; TAU-F, 5′-ACGAAGGCCTGAAGCACA GGATTA-3′; TAU-R, 5′-TCCTTTGGGACTGCCATGAGACTT-3'.
Statistical analysis
Differences among groups were evaluated by one-way ANOVA, and comparisons between two groups by Student's t-test, using the StatPlus build for Microsoft Excel.
Acknowledgments
We thank Alberto Garcia for excellent technical assistance, and Irene Fernández, Roger Torrent, Bahaa Arefai and Enric Navas for help with experiments. We also thank G. Rovelli, P. Kahle and the MJFF for the kind gift of reagents. AS-D was partially supported by a pre-doctoral fellowship from MEC. Additional support was provided by grants from MICINN (BFU2009-13277, PLE2009-0144 and ACI2010-1117 to AR; RyC-2008-02772 and BFU2010-21823 to AC; SAF2008-04360, to JA; SAF2009-07774 and PLE2009-0089, to JMC), FIS (PI10/00849 to MV; RD06/0010/0006 to JMC), NIH/NIA AG031782/AG038072 (to AMC) and Fondazione Guido Berlucchi (to AC). The Cell Therapy Program was supported by the CMRB (Promt-0901 to JMC). The work was also part of a CIBERNED Cooperative Project (to JA, JL-B, MV, ET and AR).
Supporting information is available at EMBO Molecular Medicine online.
The authors declare that they have no conflict of interest.
Author contributions
ASD differentiated DAn from iPSC, performed neurodegeneration and autophagy studies and analyzed data; YRP and SJD generated and characterized iPSC lines; ICC and MV analysed SNCA and MPP+ susceptibility; CC, ME and ET identified and recruited the PD patients, and obtained authorization for the study; SM performed LC3 flux studies; CDG helped with iPSC cultures; BP performed electron microscopy studies; AMC designed the autophagy studies, analysed data and edited the manuscript; AG, JMC, MM, JA and JLB provided materials; AC conceived, designed and supervised the study, and edited the manuscript; AR generated iPSC lines, conceived, designed and supervised the study and wrote the manuscript.
Supplementary material
Detailed facts of importance to specialist readers are published as ”Supporting Information”. Such documents are peer-reviewed, but not copy-edited or typeset. They are made available as submitted by the authors.
References
- Aasen T, Raya A, Barrero MJ, Garreta E, Consiglio A, Gonzalez F, Vassena R, Bilic J, Pekarik V, Tiscornia G, et al. Efficient and rapid generation of induced pluripotent stem cells from human keratinocytes. Nat Biotechnol. 2008;26:1276–1284. doi: 10.1038/nbt.1503. [DOI] [PubMed] [Google Scholar]
- Carvajal-Vergara X, Sevilla A, D'Souza SL, Ang YS, Schaniel C, Lee DF, Yang L, Kaplan AD, Adler ED, Rozov R, et al. Patient-specific induced pluripotent stem-cell-derived models of LEOPARD syndrome. Nature. 2010;465:808–812. doi: 10.1038/nature09005. [DOI] [PMC free article] [PubMed] [Google Scholar]
- Chu CT, Plowey ED, Dagda RK, Hickey RW, Cherra S,J, III, Clark RS. Autophagy in neurite injury and neurodegeneration: in vitro and in vivo models. Methods Enzymol. 2009;453:217–249. doi: 10.1016/S0076-6879(08)04011-1. [DOI] [PMC free article] [PubMed] [Google Scholar]
- Cookson MR. The role of leucine-rich repeat kinase 2 (LRRK2) in Parkinson's disease. Nat Rev Neurosci. 2010;11:791–797. doi: 10.1038/nrn2935. [DOI] [PMC free article] [PubMed] [Google Scholar]
- Dawson TM, Ko HS, Dawson VL. Genetic animal models of Parkinson's disease. Neuron. 2010;66:646–661. doi: 10.1016/j.neuron.2010.04.034. [DOI] [PMC free article] [PubMed] [Google Scholar]
- Dimos JT, Rodolfa KT, Niakan KK, Weisenthal LM, Mitsumoto H, Chung W, Croft GF, Saphier G, Leibel R, Goland R, et al. Induced pluripotent stem cells generated from patients with ALS can be differentiated into motor neurons. Science. 2008;321:1218–1221. doi: 10.1126/science.1158799. [DOI] [PubMed] [Google Scholar]
- Dunn WA., Jr Studies on the mechanisms of autophagy: maturation of the autophagic vacuole. J Cell Biol. 1990;110:1935–1945. doi: 10.1083/jcb.110.6.1935. [DOI] [PMC free article] [PubMed] [Google Scholar]
- Ebert AD, Yu J, Rose FF, Jr, Mattis VB, Lorson CL, Thomson JA, Svendsen CN. Induced pluripotent stem cells from a spinal muscular atrophy patient. Nature. 2009;457:277–280. doi: 10.1038/nature07677. [DOI] [PMC free article] [PubMed] [Google Scholar]
- Giralt A, Friedman HC, Caneda-Ferron B, Urban N, Moreno E, Rubio N, Blanco J, Peterson A, Canals JM, Alberch J. BDNF regulation under GFAP promoter provides engineered astrocytes as a new approach for long-term protection in Huntington's disease. Gene Ther. 2010;17:1294–1308. doi: 10.1038/gt.2010.71. [DOI] [PubMed] [Google Scholar]
- Hu BY, Weick JP, Yu J, Ma LX, Zhang XQ, Thomson JA, Zhang SC. Neural differentiation of human induced pluripotent stem cells follows developmental principles but with variable potency. Proc Natl Acad Sci USA. 2010;107:4335–4340. doi: 10.1073/pnas.0910012107. [DOI] [PMC free article] [PubMed] [Google Scholar]
- Hughes AJ, Ben-Shlomo Y, Daniel SE, Lees AJ. What features improve the accuracy of clinical diagnosis in Parkinson's disease: a clinicopathologic study. Neurology. 1992;42:1142–1146. doi: 10.1212/wnl.42.6.1142. [DOI] [PubMed] [Google Scholar]
- Imai Y, Gehrke S, Wang HQ, Takahashi R, Hasegawa K, Oota E, Lu B. Phosphorylation of 4E-BP by LRRK2 affects the maintenance of dopaminergic neurons in Drosophila. EMBO J. 2008;27:2432–2443. doi: 10.1038/emboj.2008.163. [DOI] [PMC free article] [PubMed] [Google Scholar]
- Johnson MA, Weick JP, Pearce RA, Zhang SC. Functional neural development from human embryonic stem cells: accelerated synaptic activity via astrocyte coculture. J Neurosci. 2007;27:3069–3077. doi: 10.1523/JNEUROSCI.4562-06.2007. [DOI] [PMC free article] [PubMed] [Google Scholar]
- Kabeya Y, Mizushima N, Ueno T, Yamamoto A, Kirisako T, Noda T, Kominami E, Ohsumi Y, Yoshimori T. LC3, a mammalian homologue of yeast Apg8p, is localized in autophagosome membranes after processing. EMBO J. 2000;19:5720–5728. doi: 10.1093/emboj/19.21.5720. [DOI] [PMC free article] [PubMed] [Google Scholar]
- Kaech S, Banker G. Culturing hippocampal neurons. Nat Protoc. 2006;1:2406–2415. doi: 10.1038/nprot.2006.356. [DOI] [PubMed] [Google Scholar]
- Ku S, Soragni E, Campau E, Thomas EA, Altun G, Laurent LC, Loring JF, Napierala M, Gottesfeld JM. Friedreich's ataxia induced pluripotent stem cells model intergenerational GAATTC triplet repeat instability. Cell Stem Cell. 2010;7:631–637. doi: 10.1016/j.stem.2010.09.014. [DOI] [PMC free article] [PubMed] [Google Scholar]
- Lee G, Studer L. Induced pluripotent stem cell technology for the study of human disease. Nat Methods. 2010;7:25–27. doi: 10.1038/nmeth.f.283. [DOI] [PubMed] [Google Scholar]
- Lee G, Papapetrou EP, Kim H, Chambers SM, Tomishima MJ, Fasano CA, Ganat YM, Menon J, Shimizu F, Viale A, et al. Modelling pathogenesis and treatment of familial dysautonomia using patient-specific iPSCs. Nature. 2009;461:402–406. doi: 10.1038/nature08320. [DOI] [PMC free article] [PubMed] [Google Scholar]
- Lees AJ, Hardy J, Revesz T. Parkinson's disease. Lancet. 2009;373:2055–2066. doi: 10.1016/S0140-6736(09)60492-X. [DOI] [PubMed] [Google Scholar]
- Lesage S, Brice A. Parkinson's disease: from monogenic forms to genetic susceptibility factors. Hum Mol Genet. 2009;18:R48–R59. doi: 10.1093/hmg/ddp012. [DOI] [PubMed] [Google Scholar]
- Lin X, Parisiadou L, Gu XL, Wang L, Shim H, Sun L, Xie C, Long CX, Yang WJ, Ding J, et al. Leucine-rich repeat kinase 2 regulates the progression of neuropathology induced by Parkinson's-disease-related mutant alpha-synuclein. Neuron. 2009;64:807–827. doi: 10.1016/j.neuron.2009.11.006. [DOI] [PMC free article] [PubMed] [Google Scholar]
- Marchetto MC, Carromeu C, Acab A, Yu D, Yeo GW, Mu Y, Chen G, Gage FH, Muotri AR. A model for neural development and treatment of Rett syndrome using human induced pluripotent stem cells. Cell. 2010;143:527–539. doi: 10.1016/j.cell.2010.10.016. [DOI] [PMC free article] [PubMed] [Google Scholar]
- Menzies FM, Moreau K, Rubinsztein DC. Protein misfolding disorders and macroautophagy. Curr Opin Cell Biol. 2011;23:190–197. doi: 10.1016/j.ceb.2010.10.010. [DOI] [PMC free article] [PubMed] [Google Scholar]
- Moretti A, Bellin M, Welling A, Jung CB, Lam JT, Bott-Flugel L, Dorn T, Goedel A, Hohnke C, Hofmann F, et al. Patient-specific induced pluripotent stem-cell models for long-QT syndrome. N Engl J Med. 2010;363:1397–1409. doi: 10.1056/NEJMoa0908679. [DOI] [PubMed] [Google Scholar]
- Nguyen HN, Byers B, Cord B, Shcheglovitov A, Byrne J, Gujar P, Kee K, Schule B, Dolmetsch RE, Langston W, et al. LRRK2 mutant iPSC-derived DA neurons demonstrate increased susceptibility to oxidative stress. Cell Stem Cell. 2011;8:267–280. doi: 10.1016/j.stem.2011.01.013. [DOI] [PMC free article] [PubMed] [Google Scholar]
- Nixon RA, Wegiel J, Kumar A, Yu WH, Peterhoff C, Cataldo A, Cuervo AM. Extensive involvement of autophagy in Alzheimer disease: an immuno-electron microscopy study. J Neuropathol Exp Neurol. 2005;64:113–122. doi: 10.1093/jnen/64.2.113. [DOI] [PubMed] [Google Scholar]
- Obeso JA, Rodriguez-Oroz MC, Goetz CG, Marin C, Kordower JH, Rodriguez M, Hirsch EC, Farrer M, Schapira AH, Halliday G. Missing pieces in the Parkinson's disease puzzle. Nat Med. 2010;16:653–661. doi: 10.1038/nm.2165. [DOI] [PubMed] [Google Scholar]
- Paisan-Ruiz C, Jain S, Evans EW, Gilks WP, Simon J, van der Brug M, Lopez deMunain, Aparicio A, Gil S, Khan AM, et al. Cloning of the gene containing mutations that cause PARK8-linked Parkinson's disease. Neuron. 2004;44:595–600. doi: 10.1016/j.neuron.2004.10.023. [DOI] [PubMed] [Google Scholar]
- Park IH, Arora N, Huo H, Maherali N, Ahfeldt T, Shimamura A, Lensch MW, Cowan C, Hochedlinger K, Daley GQ. Disease-specific induced pluripotent stem cells. Cell. 2008a;134:877–886. doi: 10.1016/j.cell.2008.07.041. [DOI] [PMC free article] [PubMed] [Google Scholar]
- Park IH, Zhao R, West JA, Yabuuchi A, Huo H, Ince TA, Lerou PH, Lensch MW, Daley GQ. Reprogramming of human somatic cells to pluripotency with defined factors. Nature. 2008b;451:141–146. doi: 10.1038/nature06534. [DOI] [PubMed] [Google Scholar]
- Rashid ST, Corbineau S, Hannan N, Marciniak SJ, Miranda E, Alexander G, Huang-Doran I, Griffin J, Ahrlund-Richter L, Skepper J, et al. Modeling inherited metabolic disorders of the liver using human induced pluripotent stem cells. J Clin Invest. 2010;120:3127–3136. doi: 10.1172/JCI43122. [DOI] [PMC free article] [PubMed] [Google Scholar]
- Raya A, Rodriguez-Piza I, Aran B, Consiglio A, Barri PN, Veiga A, Belmonte JC. Generation of cardiomyocytes from new human embryonic stem cell lines derived from poor-quality blastocysts. Cold Spring Harb Symp Quant Biol. 2008;73:127–135. doi: 10.1101/sqb.2008.73.038. [DOI] [PubMed] [Google Scholar]
- Raya A, Rodriguez-Piza I, Guenechea G, Vassena R, Navarro S, Barrero MJ, Consiglio A, Castella M, Rio P, Sleep E, et al. Disease-corrected haematopoietic progenitors from Fanconi anaemia induced pluripotent stem cells. Nature. 2009;460:53–59. doi: 10.1038/nature08129. [DOI] [PMC free article] [PubMed] [Google Scholar]
- Raya A, Rodriguez-Piza I, Navarro S, Richaud-Patin Y, Guenechea G, Sanchez-Danes A, Consiglio A, Bueren J, Izpisua Belmonte JC. A protocol describing the genetic correction of somatic human cells and subsequent generation of iPS cells. Nat Protoc. 2010;5:647–660. doi: 10.1038/nprot.2010.9. [DOI] [PubMed] [Google Scholar]
- Ruggero D, Montanaro L, Ma L, Xu W, Londei P, Cordon-Cardo C, Pandolfi PP. The translation factor eIF-4E promotes tumor formation and cooperates with c-Myc in lymphomagenesis. Nat Med. 2004;10:484–486. doi: 10.1038/nm1042. [DOI] [PubMed] [Google Scholar]
- Sanchez-Danes A, Consiglio A, Richaud Y, Rodriguez-Piza I, Dehay B, Edel M, Bove J, Memo M, Vila M, Raya A, et al. Efficient generation of A9 midbrain dopaminergic neurons by lentiviral delivery of LMX1A in human embryonic stem cells and induced pluripotent stem cells. Hum Gene Ther. 2012;23:56–69. doi: 10.1089/hum.2011.054. [DOI] [PMC free article] [PubMed] [Google Scholar]
- Schapira AH, Tolosa E. Molecular and clinical prodrome of Parkinson disease: implications for treatment. Nat Rev Neurol. 2010;6:309–317. doi: 10.1038/nrneurol.2010.52. [DOI] [PubMed] [Google Scholar]
- Singh R, Kaushik S, Wang Y, Xiang Y, Novak I, Komatsu M, Tanaka K, Cuervo AM, Czaja MJ. Autophagy regulates lipid metabolism. Nature. 2009;458:1131–1135. doi: 10.1038/nature07976. [DOI] [PMC free article] [PubMed] [Google Scholar]
- Soldner F, Hockemeyer D, Beard C, Gao Q, Bell GW, Cook EG, Hargus G, Blak A, Cooper O, Mitalipova M, et al. Parkinson's disease patient-derived induced pluripotent stem cells free of viral reprogramming factors. Cell. 2009;136:964–977. doi: 10.1016/j.cell.2009.02.013. [DOI] [PMC free article] [PubMed] [Google Scholar]
- Soldner F, Laganiere J, Cheng AW, Hockemeyer D, Gao Q, Alagappan R, Khurana V, Golbe LI, Myers RH, Lindquist S, et al. Generation of isogenic pluripotent stem cells differing exclusively at two early onset Parkinson point mutations. Cell. 2011;146:318–331. doi: 10.1016/j.cell.2011.06.019. [DOI] [PMC free article] [PubMed] [Google Scholar]
- Takahashi K, Yamanaka S. Induction of pluripotent stem cells from mouse embryonic and adult fibroblast cultures by defined factors. Cell. 2006;126:663–676. doi: 10.1016/j.cell.2006.07.024. [DOI] [PubMed] [Google Scholar]
- Takahashi K, Tanabe K, Ohnuki M, Narita M, Ichisaka T, Tomoda K, Yamanaka S. Induction of pluripotent stem cells from adult human fibroblasts by defined factors. Cell. 2007;131:861–872. doi: 10.1016/j.cell.2007.11.019. [DOI] [PubMed] [Google Scholar]
- Woods NB, Parker AS, Moraghebi R, Lutz MK, Firth AL, Brennand KJ, Berggren WT, Raya A, Belmonte JC, Gage FH, et al. Brief report: efficient generation of hematopoietic precursors and progenitors from human pluripotent stem cell lines. Stem Cells. 2011;29:1158–1164. doi: 10.1002/stem.657. [DOI] [PMC free article] [PubMed] [Google Scholar]
- Yang Q, Mao Z. Parkinson disease: A role for autophagy. Neuroscientist. 2010;16:335–341. doi: 10.1177/1073858409357118. [DOI] [PubMed] [Google Scholar]
- Yu J, Vodyanik MA, Smuga-Otto K, Antosiewicz-Bourget J, Frane JL, Tian S, Nie J, Jonsdottir GA, Ruotti V, Stewart R, et al. Induced pluripotent stem cell lines derived from human somatic cells. Science. 2007;318:1917–1920. doi: 10.1126/science.1151526. [DOI] [PubMed] [Google Scholar]
- Zhang J, Wilson GF, Soerens AG, Koonce CH, Yu J, Palecek SP, Thomson JA, Kamp TJ. Functional cardiomyocytes derived from human induced pluripotent stem cells. Circ Res. 2009;104:e30–e41. doi: 10.1161/CIRCRESAHA.108.192237. [DOI] [PMC free article] [PubMed] [Google Scholar]
- Zhang J, Lian Q, Zhu G, Zhou F, Sui L, Tan C, Mutalif RA, Navasankari R, Zhang Y, Tse HF, et al. A human iPSC model of Hutchinson Gilford Progeria reveals vascular smooth muscle and mesenchymal stem cell defects. Cell Stem Cell. 2011;8:31–45. doi: 10.1016/j.stem.2010.12.002. [DOI] [PubMed] [Google Scholar]
- Zimprich A, Biskup S, Leitner P, Lichtner P, Farrer M, Lincoln S, Kachergus J, Hulihan M, Uitti RJ, Calne DB, et al. Mutations in LRRK2 cause autosomal-dominant parkinsonism with pleomorphic pathology. Neuron. 2004;44:601–607. doi: 10.1016/j.neuron.2004.11.005. [DOI] [PubMed] [Google Scholar]
Associated Data
This section collects any data citations, data availability statements, or supplementary materials included in this article.