

Abstract
Over the past years, bottom-up bionanotechnology has been developed as a promising tool for future technological applications. Many of these biomolecule-based assemblies are characterized using various single-molecule techniques that require strict anaerobic conditions. The most common oxygen scavengers for single-molecule experiments are glucose oxidase and catalase (GOC) or protocatechuate dioxygenase (PCD). One of the pitfalls of these systems, however, is the production of carboxylic acids. These acids can result in a significant pH drop over the course of experiments and must thus be compensated by an increased buffer strength. Here, we present pyranose oxidase and catalase (POC) as a novel enzymatic system to perform single-molecule experiments in pH-stable conditions at arbitrary buffer strength. We show that POC keeps the pH stable over hours, while GOC and PCD cause an increasing acidity of the buffer system. We further verify in single-molecule fluorescence experiments that POC performs as good as the common oxygen-scavenging systems, but offers long-term pH stability and more freedom in buffer conditions. This enhanced stability allows the observation of bionanotechnological assemblies in aqueous environments under well-defined conditions for an extended time.
Keywords: single-molecule, oxygen-scavenging, pH stability, photostability, pyranose oxidase
Over the past fifteen years, experiments at the single-molecule level have introduced a new perspective to understanding the function of individual cellular machines involved in many biological processes, ranging from DNA replication, recombination, and repair and RNA synthesis to translation and degradation of proteins.1 Numerous such experiments use either force or fluorescence1,2 to visualize samples and dynamic behavior, for example, in optical tweezers,1,3 in super-resolution techniques,4 or in single-molecule Förster resonance energy transfer (smFRET).5 Crucial to the performance of such experiments is the fluorophore and tether lifetime, i.e. the time until photophysical bleaching occurs or until radical oxygen species damage the tethered molecules.6 Therefore, enzymes oxidizing a substrate—so-called oxygen scavengers—are employed to create anaerobic conditions and thus increase the lifetime by preventing oxygen-based reactions.
The two most common oxygen scavenger systems are glucose oxidase in combination with catalase (GOC) and the recently introduced protocatechuate-dioxygenase (PCD),7,8 with β-d-glucose and 3,4-protocatechuic acid (PCA) as substrate, respectively. However, in both cases, the substrate oxidation produces carboxylic acids (d-gluconic acid and 3,3-carboxy-cis,cis-muconic acid, respectively, Figure 1a, reactions 1 and 2). If not buffered sufficiently, this acid production will lead to a continuous pH drop over time, hence changing the experimental conditions. The activities of many biomolecules and cells studied in single-molecule experiments are both pH and salt sensitive, while fluorophores may show unfavorable pH-dependent blinking behavior.9 The need for high buffer concentrations, however, prevents the use of low ionic strength conditions, yet increased salt concentrations have been associated with the precipitation of proteins,10 thereby interfering with some single-molecule experiments. Therefore, efficient oxygen scavenging at constant and well-defined pH conditions, with arbitrary buffer strength and pH, is of high priority.
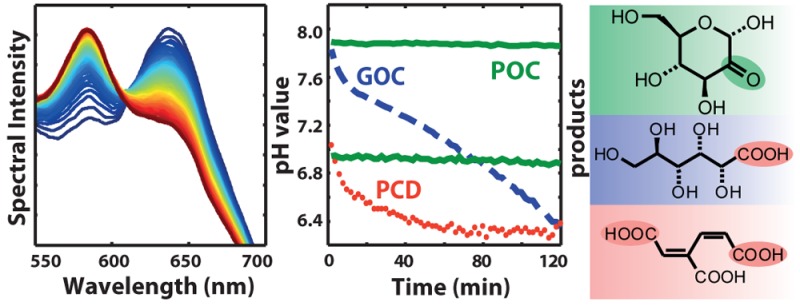
Figure 1.

(a) GOC, PCD, and POC reactions. (b) Time series of fluorescence spectra of SNARF-1 in solution with GOC and 10 mM Tris:HCl-buffer. An emission spectrum was recorded every 2 min (blue to red). (c) pH value evolution for GOC (dashed), PCD (dotted), and POC (solid) with different starting pH. The grayed area indicates saturation of the SNARF-1 sensor.
Results and Discussion
Here we suggest a solution to the shortcomings of GOC and PCD through an enzymatic oxygen scavenging system that enables reliable pH conditions in single-molecule experiments. Pyranose oxidase (EC 1.1.3.10) in combination with catalase (POC) was recently applied to maintain anaerobic conditions in electrochemical field biosensors.11 The oxidation product of D-glucose with the POC system is a ketone (2-dehydro-d-glucose; see Figure 1a, reaction 3), which is not expected to affect the pH. Moreover, pyranose oxidase has more favorable Michaelis–Menten constants for both substrates (Km(O2) = 0.46 mM, Km(d-glucose) = 3.1 mM) than glucose oxidase (Km(O2) = 2.9 mM, Km(d-glucose) = 225 mM) and shows no anomeric preference for d-glucose.12,13
First, we confirmed the performance in oxygen reduction of POC in comparison to GOC and PCD with a Clark-type electrode and an oxygen optode. For all three enzymatic systems at a concentration of 7.5 U mL–1, after 10 min, the O2 concentration was below the detection limit of both methods.
Next, we monitored the pH value evolution in a flow cell typical for single-molecule experiments (see Figure S3) by using the ratiometric, dual-emission dye SNARF-1 (seminaphtharhodafluor),14 which changes its emission by protonation or deprotonation of side groups with a pKa ≈ 7.6.15Figure 1b shows a series of fluorescence spectra of SNARF-1 in a buffer solution with GOC over the course of 120 min (from blue to red) in an imaging buffer containing 10 mM Tris-HCl pH 8, 50 mM NaCl, 0.8% d-glucose and 7.5 U mL–1 glucose oxidase, and 1 kU mL–1 catalase. Calibrating the emission intensity ratios for the two peaks with buffers at given pH values (see Supporting Information), we extracted the time course of the pH value in the flow cell (Figure 1c). In the experiments with GOC, the starting pH, ∼8.0, dropped quickly below pH 7.5 and then continued to decrease more slowly (blue dashed line in Figure 1c; for confidence intervals see Figure S5). At lower starting pH (pH 7.5 and 7.0) GOC rapidly acidified the solution in the flow cell below the sensitivity of our fluorescent in situ probe (indicated by the grayed area below pH 6.4 in Figure 1c). The steep pH decays at the beginning of our time series are most likely due to depletion of the initial oxygen concentration present from buffer preparation, while beyond that, diffusion kinetics of oxygen into the flow cell (details in the Supporting Information) determine the further drop of the pH value. The rate of oxygen mass transfer in the solution may be limited by an appropriate flow cell design, but might still occur through buffer exchange tubing and small inlet holes, and thus in extension still lead to a solution acidification.16
Strikingly, replacing GOC with POC keeps the starting pH of ∼8.0, 7.5, and 7.0 constant for a period of at least 2 h (solid lines in Figure 1c). This pH stability is consistent with the product of glucose oxidation by pyranose oxidase (reaction 3 in Figure 1a) and illustrates a major advantage of POC over GOC.
Recent reports indicate that the oxygen-scavenging system based on PCD would also provide pH stability over a long time.14 Our experiments (at pH ∼8.0) confirmed that PCD (blue dotted line in Figure 1c), after a small initial drop, maintained a stable pH value during oxygen scavenging for up to 90 min and then showed a slight drop. This pH stability is surprising since the oxidation of PCA creates two carboxylic acid groups (Figure 1a, reaction 2). From calculated molecular charge curves we derived that PCA acts as a buffering compound around pH 8, hence preventing a significant drop in the pH (see Supporting Information). We experimentally verified this by moving the starting pH value further away from the optimal buffering range of PCA (pKa ∼8.7) (dotted lines in Figure 1c), which led to a more rapid decrease of the pH. At starting pH 7.0, PCD clearly showed a rapid acidification in contrast to POC (Figure 1c). The self-buffering effect of PCA at pH 8 entailed a high ionic strength in solution. For a concentration of 50 mM PCA in the buffer, approximately 65–70 mM Na+ was introduced during basic titration to achieve pH 8, which is in accordance with the pKa values of PCA.17,18
In order to test the oxygen-scavenging ability of POC in comparison to GOC and PCD on the single-molecule level, several series of fluorescence bleaching experiments of two common fluorophores, Cy3 and Cy5, were carried out in a custom-built single-molecule FRET setup as described by Roy etal.5 with a typical flow cell design as illustrated in Figure 2a. We tested the performance of all three enzymes at starting pH values of 7.0, 7.5, and 8.0 (as in Figure 1c), to determine whether effects unique to the single-molecule level appear in contrast to ensemble averaging. The performance of a given enzymatic system was rated as the characteristic lifetime from a sequence of single-molecule fluorescence scans with on average 300 to 600 molecules per field of view (for detailed numbers of molecules see Table S2). Each molecule was individually identified in post-experiment processing using a custom-written Matlab code (see Supporting Information). The integrated fluorescence intensity of these molecules was used to fit a single-exponential decay using the nonlinear least-squares method and to extract the characteristic lifetime before bleaching. Triplet states were quenched in all three systems using a saturated Trolox solution.19
Figure 2.
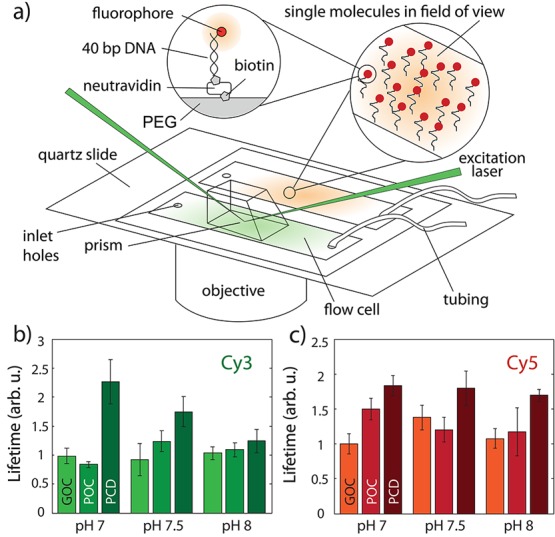
(a) Setup sketch for single-molecule bleaching experiments and flow cell design. (b) Normalized lifetimes of Cy3 fluorophores at different starting pH for GOC, POC, and PCD. (c) Cy5 fluorophore lifetimes, same conditions as (b). Error bars are standard error; molecule and field of view counts in Supporting Information.
In Figure 2b and c we show normalized photobleaching lifetimes of Cy3 and Cy5 fluorophores attached to double-stranded DNA, respectively, for different enzymatic conditions. The error bars represent the measurement standard error, and measurements were performed 5 min after flush-in of the buffer solution to deplete any initial oxygen concentration. Cy3 molecules with POC and GOC live equally long within the error bars (Figure 2b), yet longest with PCD in all conditions. Interestingly, the Cy3 photobleaching lifetime is the longest with PCD at a starting pH value of 7.0. For Cy5, the photobleaching lifetime with POC slightly exceeded that of GOC (Figure 2c), while PCD exhibited less pH sensitivity than for Cy3. We performed additional tests to exclude influences of glucose and PCA in the buffers and did not observe any significant effect on the measured fluorophore lifetimes (see Supporting Information). Further photobleaching experiments of Cy3 and Alexa647 attached to the protein streptavidin did not reveal any significant performance difference of GOC, POC, and PCD (see Supporting Information and Figure S10), when used with fluorescently labeled proteins.
We then intended to directly probe the effect of increasing acidity on individual fluorophores and performed photobleaching and blinking experiments of Cy3 and Cy5 attached to double-stranded DNA 1, 3, 5, 15, 30, 60, and 120 min after injecting the imaging buffer at pH 7.5 to our flow chamber. The photobleaching lifetime did not show any significant change over the time course of 120 min in any of the three oxygen-scavenging systems (see Supporting Information, Figure S9). To quantify the blinking due to the products from the oxygen scavenging over a longer time scale, we characterized the ratio of non-emitting and emitting time (off/on ratio) by analyzing individual molecules before bleaching (see Supporting Information and Figure 3). The average off/on ratio of Cy3 was between 0.2% and 4% 1 min after buffer injection and stayed nearly constant in the case when we used the PCD—at high buffer strength, due to its PCA substrate—or POC systems, but rapidly and steadily increased using the GOC system (Figure 3a). For Cy5 we found very similar behavior, showing strongly increased blinking after longer incubation with the GOC imaging buffer (Figure 3b). Figure 3c and d show typical single-molecule traces of Cy3 and Cy5, respectively, approximately 1 min after the imaging buffer injection with GOC and no blinking of the fluorophores and a clear single bleaching step. After 120 min incubation of the imaging buffer with GOC, the fluorophores showed intense blinking, and dark states were identified by an intensity drop below 35% of the maximum after background subtraction (Figure 3e and f). Previous studies have reported that different experimental pH values directly influence fluorophore blinking.9 The increased blinking observed with GOC and the stable blinking behavior observed with PCD under high buffer strength and with POC are consistent with their respective effects on pH at starting pH 7.5 during the experiment time of 120 min (Figure 1c).
Figure 3.
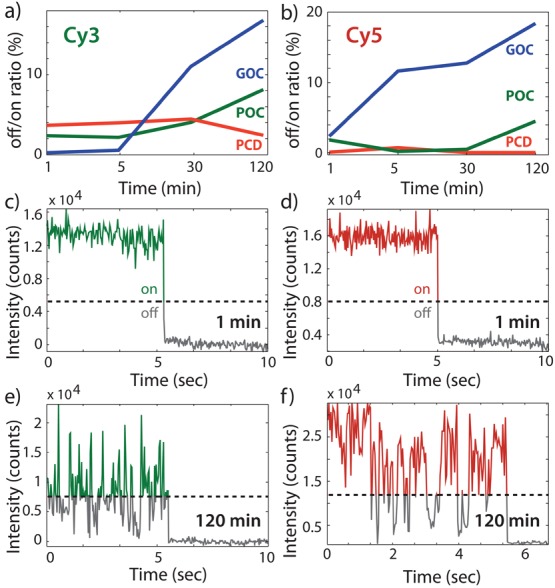
(a) Molecular blinking characterized by the off-time/on-time ratio before bleaching, averaged over Cy3 molecules at starting pH 7.5, after 1, 5, 30, and 120 min of flushing the buffer into the experimental chamber, for GOC (blue), POC (green), and PCD (red). (b) Same as (a) for Cy5. (c, d) Example traces of single-molecule fluorescence intensity with GOC at starting pH 7.5, 1 min after flush-in, for Cy3 and Cy5, respectively. The dashed line represents the limit for considering the molecule in “off” versus “on”-state. (e, f) Example traces under the same conditions 120 min after flush-in with GOC imaging buffer, for Cy3 and Cy5, respectively.
Conclusion
In conclusion, we showed that pyranose oxidase in combination with catalase can be used as an enzymatic system to efficiently remove oxygen in single-molecule experiments, while providing pH-stable conditions. The single-molecule lifetimes of Cy3 and Cy5 are equal or better with POC compared to GOC, and experiments with Alexa647, Atto550, Atto647N, and TAMRA also showed qualitatively similar photostability. Additionally, with POC, the molecule lifetime as well as the blinking behavior was not affected in our long-exposure single-molecule experiments. In terms of photostability, PCD performs well and its substrate shows a self-buffering effect at pH 8, yet the high ionic strength of PCA may hinder its application in experiments with salt-sensitive molecules. POC is superior to both previously used oxygen-scavenging systems in its absence of acidification over time. This translates to a reliable pH value over the full time frame of a single-molecule experiment and allows significantly more freedom in the choice of buffer conditions. While anaerobic, low-salt conditions and pH stability were previously mutually exclusive, POC may fill that gap in the single-molecule toolbox. Additionally, the POC system can readily replace the GOC system, since it is based on the oxidation of glucose. Recent experiments showed that the oxidation product of the POC system does not affect biomolecules;11 thus, POC may be applied advantageously, without unexpected side effects, in experiments previously performed with GOC. These include single-molecule FRET19 or single-nanoparticle20,21 fluorescence investigations of conformational change in bionanodevices,22 real time locomotion of nanomachines,23 or dynamic measurements in living cells.24 POC may prove especially valuable for long-lasting single-molecule experiments such as optical tweezers experiments6 or super-resolution microscopy using the STORM (stochastic optical reconstruction microscopy)25,26 method, in which the pH dependence of fluorophore blinking can severely impact the experiments.
Methods
Enzymes
Glucose oxidase (GOx), type VII, from Aspergillus niger, pyranose oxidase (P2Ox) from Coriolus sp., expressed in E. coli, protocatechuate-dioxygenase from Pseudomonas sp., and catalase from bovine liver were available commercially from Sigma-Aldrich. We additionally tested a P2Ox prepared from Trametesmulticolor overexpressed in Escherichia coli with a C-terminal His-tag and purified by a single metal-affinity chromatography step, which yielded a homogeneous preparation of the enzyme.12
Oxygen concentrations in the presence of the enzymes and their substrates were measured in an unstirred solution of Tris:HCl buffer (pH 8, 10 mM) with (i) a Clark-type electrode (WTW CellOx 325, detection limit = 0.01 mg/L O2) and (ii) an O2 Optode (OxySense Gen III 325i, detection limit = 15 ppb O2). For POC and GOC, 7.5 U/mL of the oxidase, 1 kU/mL of catalase, and 50 mM glucose was used. For PCD, 7.5 U/mL PCD and 50 mM PCA were used.
Buffer Conditions
Single-molecule experiment buffers were composed of 20 mM Tris:HCl pH 8, 50 mM NaCl, and 40 mM glucose in a saturated aged Trolox solution (6-hydroxy-2,5,7,8-tetramethylchroman-2-carboxylic acid) at pH 8, if not stated otherwise. The solution was kept overnight to produce Trolox–quinone to minimize fluorophore blinking.19 When using PCD, its substrate PCA was used at 24 mM concentration instead of glucose, if not stated otherwise. The enzymes were dissolved in 10 mM Tris:HCl buffer at pH 8 with 50 mM NaCl, if not stated otherwise.
PCD was used in a concentration of 175 nM or 3.7 U/mL in the imaging buffer (stock 12.5 mg/mL or 37.5 U/mL, from a batch with 3 U/mg). With GOx, 192 U/mL was typically used in the imaging buffer, and for P2Ox, 3 U/mL pyranose oxidase was used. Catalase, if needed, was added to a final concentration of 90 U/mL. To ensure that these mismatching activities of the enzymes did not influence the measurement, a comparison of POC and GOC at 3 U/mL was also performed, which did not yield any different behavior (after a 5 min waiting period to ensure equilibrium kinetics) in oxygen scavenging.
Single-Molecule Experiments
Biotinylated DNA double strands labeled with the cyanine dye Cy3 or Cy5, respectively, were immobilized via neutravidin–biotin interaction, on a surface passivated with polyethylene glycol, of which 0.8% (w/w) was labeled with biotin (Figure S1). The flow cell consisted of channels separated by double-sided tape between a coverslip and a drilled quartz objective slide and typically had a volume of about 40 μL.
The single-molecule traces were recorded with a setup as shown in Figure 2a. An inverted microscope from Nikon was modified to include a Pellin-Broca prism for fluorescence excitation by total-internal reflection. A Coherent Sapphire laser at 532 nm wavelength was used to excite Cy3, while a Coherent Obis at 640 nm was used for Cy5. Most experiments were carried out in a channel arrangement as in Figure 2a, with one channel loaded with Cy3-labeled DNA molecules and the other channel loaded with Cy5-labeled DNA. Different enzymes and buffers were supplied to the experiment through the drilled holes shown in Figure 2a, which allowed keeping the spot size and beam coupling and therefore excitation parameters constant for a given experiment.
The fluorescence was collected using an Andor electron-multiplying CCD-camera (iXon 897-D) and measurement software written in LabView. Postprocessing code written in Matlab extracted single-molecule intensity traces from the data as shown in Figure 3c–f and Figure S2a.
Acknowledgments
We gratefully acknowledge measurement time at the fluorescence spectrometer from the Zhang lab, the software support from Andreas Hartmann and Steffen Hahn to this work, as well as Michal Bledowski for his help with the oxygen concentration determination. This work was supported by grants from BMBF 03Z2EN11 (to M.S.) and from the EU as well as the state NRW in the framework of the HighTech.NRW program (to N.P.), the doctoral program "BioToP − Biomolecular Technology of Proteins" (Austrian Science Funds, W1224; to D.H.).
Supporting Information Available
Detailed Materials and Methods, SNARF-1 calibration, SNARF-1 chamber design, SNARF-1 confidence, pH fitting, glucose/PCA-dependent enzyme performance, PCA buffering calculations, long-lifetime studies, blinking evaluation details, labeled protein bleaching. This material is available free of charge via the Internet at http://pubs.acs.org.
Author Contributions
M.S., N.P., and M.S. designed the experiments. M.S., J.H., and H.C. performed and analyzed the experiments. D.B. and D.H. provided new reagents. The manuscript was written with contributions of all authors.
This work was supported by grants from BMBF 03Z2EN11 (to M.S.) and from the EU as well as the state NRW in the framework of the HighTech NRW program (to N.P.) and the doctoral program “BioToP–Biomolecular Technology of Proteins” (Austrian Science Funds, W1224; to D.H.).
The authors declare no competing financial interest.
Supplementary Material
References
- Bustamante C. In Singulo Biochemistry: When Less is More. Annu. Rev. Biochem. 2008, 77, 45–50. [DOI] [PubMed] [Google Scholar]
- Joo C.; Balci H.; Ishitsuka Y.; Buranachai C.; Ha T Advances in Single-molecule Fluorescence Methods for Molecular Biology. Annu. Rev. Biochem. 2008, 77, 51. [DOI] [PubMed] [Google Scholar]
- Woodside M. T.; García-García C.; Block S. M. Folding and Unfolding Single RNA Molecules under Tension. Curr. Opin. Chem. Biol. 2008, 12, 640–646. [DOI] [PMC free article] [PubMed] [Google Scholar]
- Huang B.; Bates M.; Zhuang X. Super-Resolution Fluorescence Microscopy. Annu. Rev. Biochem. 2009, 78, 993–1016. [DOI] [PMC free article] [PubMed] [Google Scholar]
- Roy R.; Hohng S.; Ha T. A Practical Guide to Single-Molecule FRET. Nat. Methods 2008, 5, 507–516. [DOI] [PMC free article] [PubMed] [Google Scholar]
- Landry M. P.; McCall P. M.; Qi Z.; Chemla Y. R. Characterization of Photoactivated Singlet Oxygen Damage in Single-Molecule Optical Trap Experiments. Biophys. J. 2009, 97, 2128–2136. [DOI] [PMC free article] [PubMed] [Google Scholar]
- Echeverría Aitken C.; Marshall R. A.; Puglisi J. D. An Oxygen Scavenging System for Improvement of Dye Stability in Single-Molecule Fluorescence Experiments. Biophys. J. 2008, 94, 1826–1835. [DOI] [PMC free article] [PubMed] [Google Scholar]
- Patil P. The Use of Protocatechuate Dioxygenase for Maintaining Anaerobic Conditions in Biochemical Experiments. Anal. Biochem. 2000, 286, 187–192. [DOI] [PubMed] [Google Scholar]
- Vogelsang J.; Cordes T.; Tinnefeld P. Single-Molecule Photophysics of Oxazines on DNA and its Application in a FRET Switch. Photochem. Photobiol. Sci. 2009, 8, 486. [DOI] [PubMed] [Google Scholar]
- McDonald H. B.; Stewart R. J.; Goldstein L. S. The Kinesin-like ncd Protein of Drosophila is a Minus End-Directed Microtubule Motor. Cell 1990, 63, 1159–1165. [DOI] [PubMed] [Google Scholar]
- Plumeré N.; Henig J.; Campbell W. Enzyme-Catalyzed O2 Removal System for Electrochemical Analysis under Ambient Air: Application in an Amperometric Nitrate Biosensor. Anal. Chem. 2012, 84, 2141–2146. [DOI] [PubMed] [Google Scholar]
- Decamps K.; Joye I. J.; Haltrich D.; Nicolas J.; Courtin C. M.; Delcour J. A. Biochemical Characteristics of Trametes Multicolor Pyranose Oxidase and Aspergillus niger Glucose Oxidase and Implications for their Functionality in Wheat Flour Dough. Food Chem. 2012, 131, 1485–1492. [Google Scholar]
- Giffhorn F. Fungal Pyranose Oxidases: Occurrence, Properties and Biotechnical Applications in Carbohydrate Chemistry. Appl. Microbiol. Biotechnol. 2000, 54, 727–740. [DOI] [PubMed] [Google Scholar]
- Shi X.; Lim J.; Ha T. Acidification of the Oxygen Scavenging System in Single-Molecule Fluorescence Studies: In Situ Sensing with a Ratiometric Dual-Emission Probe. Anal. Chem. 2010, 82, 6132–6138. [DOI] [PMC free article] [PubMed] [Google Scholar]
- Whitaker J. E.; Haugland R. P.; Prendergast F. G. Spectral and Photophysical Studies of Benzo[c]xanthene Dyes: Dual Emission pH Sensors. Anal. Biochem. 1991, 194, 330–344. [DOI] [PubMed] [Google Scholar]
- Kim S.-E.; Lee I.-B.; Hong S.-C. The Effect of the Oxygen Scavenging System on the pH of Buffered Sample Solutions: in the Context of Single-Molecule Fluorescence Measurements. Bull. Korean Chem. Soc. 2012, 33, 958–962. [Google Scholar]
- Hilal S. H.; Karickhoff S. W.; Carreira L. A. A Rigorous Test for SPARC’s Chemical Reactivity Models: Estimation of More Than 4300 Ionization pKa’s. Quant. Struct. Act. Rel. 1995, 14, 348. [Google Scholar]
- Erdemgil F.; Sanli S.; Sanli N.; Özkan G.; Barbosa J.; Guiteras J.; Beltran J. Determination of pKa Values of Some Hydroxylated Benzoic Acids in Methanol–Water Binary Mixtures by LC Methodology and Potentiometry. Talanta 2007, 72, 489–496. [DOI] [PubMed] [Google Scholar]
- Rasnik I.; McKinney S. A.; Ha T. Nonblinking and Long-Lasting Single-Molecule Fluorescence Imaging. Nat. Methods 2006, 3, 891–893. [DOI] [PubMed] [Google Scholar]
- Tian Z.; Yu J.; Wu C.; Szymanski C.; McNeill J. Amplified Energy Transfer in Conjugated Polymer Nanoparticle Tags and Sensors. Nanoscale 2010, 2, 1999. [DOI] [PubMed] [Google Scholar]
- Liu H.-W.; Ngo A. T.; Cosa G. Enhancing the Emissive Properties of Poly(p-phenylenevinylene)-Conjugated Polyelectrolyte-Coated SiO2 Nanoparticles. J. Am. Chem. Soc. 2012, 134, 1648–1652. [DOI] [PubMed] [Google Scholar]
- Zhou R.; Kunzelmann S.; Webb M. R.; Ha T. Detecting Intramolecular Conformational Dynamics of Single Molecules in Short Distance Range with Subnanometer Sensitivity. Nano Lett. 2011, 11, 5482–5488. [DOI] [PMC free article] [PubMed] [Google Scholar]
- Lee G.; Hartung S.; Hopfner K.-P.; Ha T. Reversible and Controllable Nanolocomotion of an RNA-Processing Machinery. Nano Lett. 2010, 10, 5123–5130. [DOI] [PMC free article] [PubMed] [Google Scholar]
- Benke A.; Olivier N.; Gunzenhäuser J.; Manley S. Multicolor Single Molecule Tracking of Stochastically Active Synthetic Dyes. Nano Lett. 2012, 12, 2619–2624. [DOI] [PubMed] [Google Scholar]
- Rust M. J.; Bates M.; Zhuang X. Sub-Diffraction-Limit Imaging by Stochastic Optical Reconstruction Microscopy (STORM). Nat. Methods 2006, 3, 793–796. [DOI] [PMC free article] [PubMed] [Google Scholar]
- Dempsey G. T.M; Vaughan J. C.; Chen K. H.; Bates M.; Zhuang X. Evaluation of Fluorophores for Optimal Performance in Localization-Based Super-Resolution Imaging. Nat. Methods 2011, 8, 1027–1036. [DOI] [PMC free article] [PubMed] [Google Scholar]
Associated Data
This section collects any data citations, data availability statements, or supplementary materials included in this article.