Abstract
Transcription factors (TFs) play important roles in plants. However, there is no systematic study of their structures and functions of most TFs in plants. Here, we performed template-based structure prediction for all TFs in Arabidopsis thaliana, with their full-length sequences as well as C-terminal and N-terminal regions. A total of 2918 model structures were obtained with a high confidence score. We find that TF families employ only a smaller number of templates for DNA-binding domains (DBD) but a diverse number of templates for transcription regulatory domains (TRD). Although TF families are classified according to DBD, their sizes have a significant correlation with the number of unique non-DNA-binding templates employed in the family (Pearson correlation coefficient of 0.74). That is, the size of TF family is related to its functional diversity. Network analysis reveals new connections between TF families based on shared TRD or DBD templates; 81% TF families share DBD and 67% share TRD templates. Two large fully connected family clusters in this network are observed along with 69 island families. In addition, 25 genes with unknown functions are found to be DNA-binding and/or TF factors according to predicted structures. This work provides a global view of the classification of TFs based on their DBD or TRD templates, and hence, a deeper understanding of DNA-binding and regulatory functions from structural perspective. All structural models of TFs are deposited in the online database for public usage at http://sysbio.unl.edu/AthTF.
Keywords: structure prediction, structure classification, transcription factors, plants
Introduction
Transcription factors (TFs) interact with the basal transcription apparatus at target gene promoters to activate or repress the target gene function. They are essential for the regulation of gene expression, response to development, and intercellular signals. The portion of TF genes in Arabidopsis thaliana genome and diversity of DNA-binding specificity are higher than that of Drosophila melanogaster and Caenorhabditis elegans.1–3 These suggest that TFs play more active roles in plants than in animals. Despite their extreme importance, the functions of most TFs currently are poorly understood.
The first step to understand the mechanism of protein functions is to obtain their three-dimensional (3D) structures. However, most protein structures are unknown. For instance, only 464 protein structures have been determined for a total of 25,498 coding genes of A. thaliana by the end of 2010.4 Thus, protein structure prediction is the key to bridge the gap between the number of known protein sequences and the number of structures solved. The most effective method for protein structure prediction is template-based protein structure prediction that detects close or remote homology by matching query sequence with known structure templates.5–8 Protein structures can enhance our understating of biological systems; for example, integration of structural data with other biological analysis, such as network analysis, may generate insight into the function, mechanism, and evolution of biological systems.9
Previously, we developed a series of template-based methods called SPARKS10–14 that were ranked as one of the best template-based techniques according critical assessment of structure prediction techniques (CASP 6, 7, 9).15, 16 The most recent version is called SPARKS-X14 that further improves the sensitivity and accuracy of structure prediction by employing a probability-based scoring function and improved prediction of secondary structure, solvent accessibility, and backbone torsion angles.14, 17 With independent benchmark tests, SPARKS-X improves over previous SPARKS versions in all levels. Recently, it was also applied to the prediction of RNA binding protein with high-resolution.18
In this article, we apply the SPARKS-X method to predict all TF structures in A. thaliana. Although the accuracy for predicted TF structures varies, they are useful for providing a global analysis for the structures of TF factors. Nearly 3000 structures are predicted with a high confidence score. These structures can be clustered according to template used as well as structural similarity among templates. Results indicate more conserved DNA-binding domains (DBDs), relative to a wide range of transcription regulatory domains. Many TF families previously unconnected are now linked with each other by sharing the same structural template.
Results and Discussion
Large-scale structure prediction of TFs
The total number of TF genes that we collect is 2488 (2182 loci). In these sequences, the number of sequences matched to known templates by SPARKS-X is shown as function of Z-score. Z-score is a measure on the confidence of the sequence–structure matching (95% confidence level for Z-score ≥8, 90% for Z-score ≥6, 77% for Z-score ≥5, and 63% for Z-score ≥4.5). There are 1734 predicted structures with Z-score ≥6 (Fig. 1). Although it is known that SPARKS-X is more sensitive than BLAST in detecting remote homologs,14 we confirm it by employing Blastp19 to match TFs to known PDB structural templates. Blast aligned 1438 TF sequences to the structural templates with the significant E-value cutoff of 10−3. This is 17% less than the high conference matches obtained from SPARKS-X.
Figure 1.
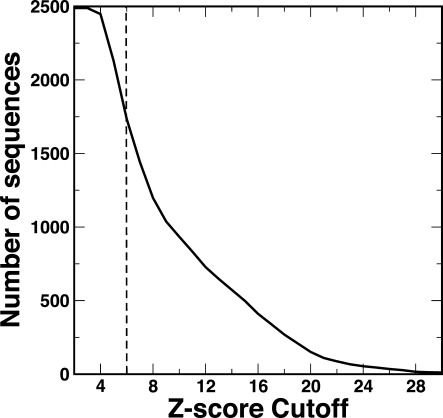
The number of predicted structures is shown as a function of the sequence-to-structure matching Z-score. The higher Z-score, the higher confidence about the structure predicted.
For Z-score ≥6, the average length of TFs is 436 amino acid residues (AA) while the average template length is 181 AA (only 42% of the TF length). The average length of templates is significantly shorter because most TFs are multidomain proteins whereas most structures in PDB are single-domain proteins.
Since SPARKS-X does not yet support multidomain prediction and most matching templates are in terminal regions, we further divide each target sequence by half and perform SPARKS-X on each sequence segment if the target sequence is longer than 240 AA. This leads to 4892 modeled structures (belong to 99 families) based on 1008 templates for Z-score ≥4.5. For Z-score ≥6, there are 2918 modeled structures based on 446 templates. Here and below we will limit our analysis to high-quality predicted structures with Z-score ≥6 (90% confidence level). We assume that majority of TFs have only two domains: one DBD and one transcription regulatory domain (TRD). This assumption is supported by almost 100% coverage of the target sequence in predicted structures.
Global analysis of TF structures
In general, one TF contains two types of domains: DBD and TRD. DBDs bind to specific DNA sequences adjacent to the genes that they regulate, while TRDs play crucial roles in regulation. Some TFs without a DBD can interact with other TFs and form DNA-binding complexes.20 Our modeled structures are considered as DBDs if their templates are DNA-binding proteins, or TRDs if otherwise.
Figure 2 compares the distribution of number of TFs for a given template for DBDs and TRDs. It is clear that some DBDs are employed multiple times (>200 for some templates) while TRDs are significantly more diverse with the majority has only one appearance (i.e., 178 TFs). This means that DBD templates are more conserved than those of TRD; the number of DNA-binding templates is smaller than that of non-DNA-binding templates and one DNA-binding template has more aligned TFs. This is somewhat expected because TFs can employ the same DBDs to bind DNA but need different TRDs to regulate gene expressions from different aspects. We further found that DBDs prefer the N-terminus of TFs. The 68% of DBDs are located on N-terminus while 45% of all TRDs are located in N-terminal regions.
Figure 2.
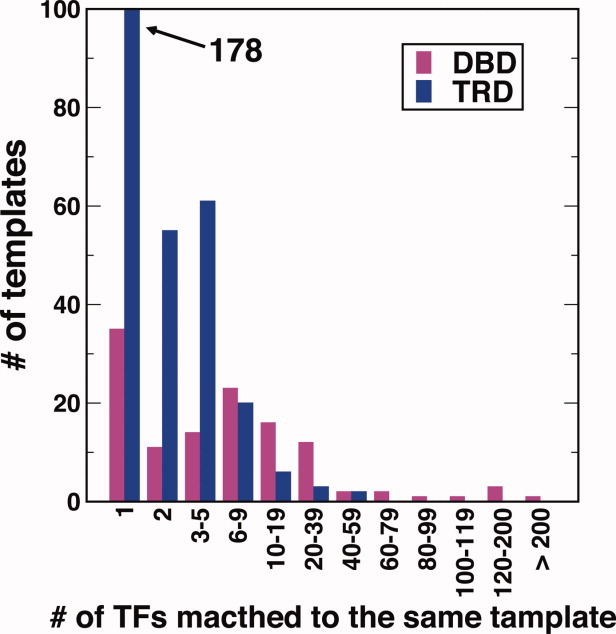
The distribution of DBD and TRD in templates. [Color figure can be viewed in the online issue, which is available at wileyonlinelibrary.com.]
Analysis of DBDs
For Z-score ≥6, there are 2002 model DBDs matching to 121 DNA-binding templates. Thus, many DBDs employ the same template structures. Typically, one TF family has one template because all TF are grouped into families based on their DBDs.21 The top 10 most popular templates are listed in Table I. They are popular because they belong to large TF families. Sometimes, one TF family has more than one template, because there are more than one structure in PDB for the same DNA-binding motif. For example, in bZIP family, 2H7H and 1T2K are used as templates. Both are basic leucine zipper DBD, but from virus and human, respectively. The root mean square deviation (rmsd) between two structures is 2.38 Å and their sequence identity is only around 40%. This suggests the different evolution origins for different TFs within the same TF family. Based on the different sequences, SPARKS-X can align TFs to the optimal structure templates though they are in the same DBD family. Some templates are also used by more than one family because many TFs have more than one DBDs (also see below). Most popular templates are mainly used by one family except 3K7A chain M and 2GHO chain D, which is employed by TFs from 32 and 10 families out of a total of 100 families, respectively. 3K7A chain M is transcription initiation factor IIB in yeast and 2GHO chain D is DNA-directed RNA polymerase β′ chain in Thermus aquaticus. Obviously, many TF families need such domains for transcription initiation.
Table I.
Top 10 Popular Structure Templates for DBD
| Template | Gene name | Protein description | No. of TF DBDs | Enriched family |
|---|---|---|---|---|
| 3K7A chain M | SUA7 | TFIIB | 256 | 32 families |
| 1GCC chain A | ERF1A in Arabidopsis | GCC-box binding domain | 180 | AP2-EREBP |
| 1H89 chain C | Myb | DNA-binding domain | 162 | MYB |
| 1UT7 chain B | ANAC | NAC domain | 132 | NAC |
| 1N6J chain A | Myocyte-specific enhancer factor 2B | MADS-box/MEF2S domain | 105 | MADS |
| 2AYD chain A | WRKY1 | C-terminal domain | 96 | WRKY |
| 1AM9 chain C | SREBP | Helix-loop-helix DNA-binding domain | 75 | bHLH |
| 1YEL chain A | AT1G16640 | B3 domain | 63 | ABI3VP1 |
| 1IRZ chain A | ARR10 | MyB-related DNA-binding motifs | 48 | MyB-related |
| 2I13 chain A | Zscan2 | Zinc finger domain | 40 | C2H2 |
| 1WID chain A | RAV1 | B3 domain | 38 | ABI3VP1, ARF |
While most TFs have only one DBD, but some TFs have more than one DBD. It remains unclear why more than one DBD are present in one TF. For some cases, multiple DBDs may bind a long control region and enhance binding affinity,22 and tandem DBDs were also reported to bend DNA.23 In A. thaliana, 377 TF genes have two DBDs, and 119 of them have the same type of DBDs. The DBDs that appear twice in the same TFs are dominated by templates 1YEL chain A, 1GCC chain A, 2AYD chain A, and 1RGO chain A, which correspond to B3 domain, GCC-box binding domain, WRKY domain, and zinc finger domain, respectively. For example, AT5G18000 has two identical B3 DBDs.24 There are 258 TFs having two different types of DBDs. For example, AT3G30530 (ATBZIP42), a member of the bZIP family, has one basic leucine zipper domain on its N-terminus, and a WRKY DBD on the C-terminus. For two different types of DBDs, templates 3K7A chain M, 2CU7 chain A, 1GCC chain A, and 3DRP chain A have frequent appearance while 1N6J chain A and 2FZT chain B occurs together in the highest frequency (in 22 TFs). 1N6J chain A is MADs-box and 2FZT chain B is a helix-bundle DBD whose function is unknown. Though some TFs have two different DBDs, like AT3G30530, they are assigned into one specific family as per one of them. The existence of the other DBD of those TFs indicates their relationship with the other corresponding family.
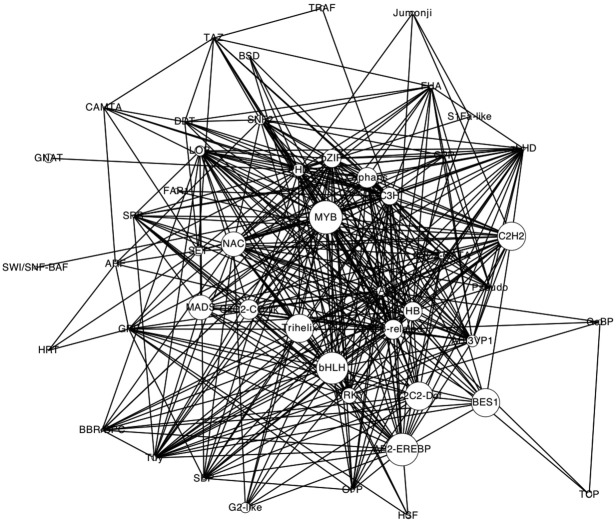
We employ a network graph to classify TFs, instead of a linear set of family bins. The network is shown in Figure 3. In this network, a TF family is a node and any two TF families are connected by an edge if they share at least one DNA-binding structure template. The nonspecific templates 3K7A and 2GHO are not considered in this graph, TF families not sharing any templates with other ones are not shown in this network. This graph, like other biological networks, is also a scale-free network.25 That is, there are some nodes that have many neighbors (large degrees), such as AP2-EREBP, MYB-related, and G2-like. TFs in these hub families have either nonconserved DBD or multiple DBDs. Interestingly, this network graph suggests two larger family clusters: one is centered around AP2-EREBP and the other is a fully-connected clique made of SNF2, HB, PHD, and SET that is loosely linked to NAC, Orphana, and C2C2-CO-like families. In addition, there are 69 island families (e.g., E2F-DP, EIL, PBF-2-like, Trihelix, BSD, LFY, C2C2-Dof, HMG, SBP, Sigma70-like, and C2C2-YABBY) that do not share any common templates with other families except RNA polymerase subunits (3K7A chain M and 2GHO chain D). There is a weak correlation between degrees and the size of families with a correlation coefficient of 0.54 (Fig. 4). This suggests that the size of a TF family is determined by other factors. There are about 25 families that use neither 3K7A nor 2GHO template. Most of them are small families, in which the numbers of TFs are less than 10. Some medium size families have several different reasons. Some of them are not nuclear TFs, such as family mTERF that has 36 mitochondria TFs. Some of them have very short TFs, such as TRAF. Some of them either have no conserved DBDs (e.g., FAR1 and FHA) or have very conserved sequences (e.g., Trixhelix).
Figure 3.
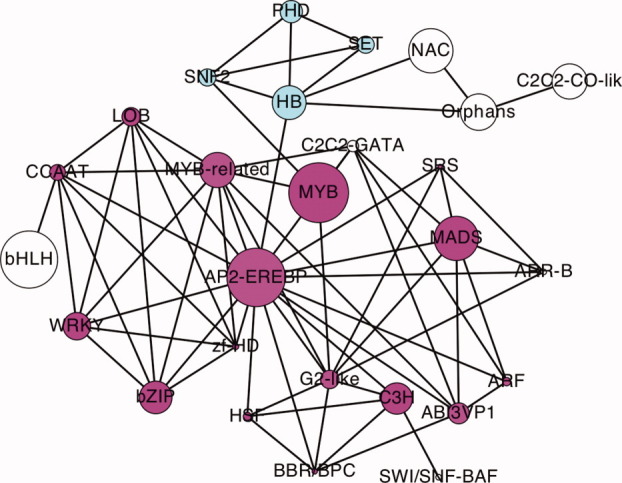
The DBD network of TF families. The size of each node scaled according to the size of families. Two family clusters are highlighted with two different colors. [Color figure can be viewed in the online issue, which is available at wileyonlinelibrary.com.]
Figure 4.
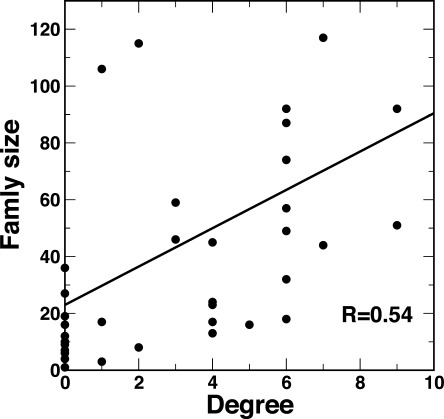
The correlation between degrees and the size of families.
Analysis of TRDs
For Z-Score ≥6, there are 915 modeled TRDs matched to 325 non-DNA-binding templates. Unlike DBDs, one TF family often has many different templates of TRDs with diverse range of functions. There is a high correlation between the number of TRD templates and the size of TF family (Pearson correlation coefficient = 0.74, Fig. 5). The correlation coefficient increases to 0.91 if the number of sequences with no matching templates from SPARKS-X is excluded. This strongly suggests that a larger family corresponds to complex regulation of more protein functions. The top 10 popular templates for TRDs are listed in Table II. Four of these top ten templates, 3K29, 3I4R, 3DL8, and 2PNE, corresponding to a total of 109 TRD sequences, involve in protein–protein interactions. Interestingly, some of the templates shown in Table II such as the snow flea antifreeze protein do not appear to relate to transcriptional function directly. On the other hand, the structure of the snow flea antifreeze protein (2PNE) has six antiparallel left-handed polyproline Type II (PP II) helixes. A polyproline sequence, which tends to adopt the PPII helix, is a common binding motif existing in many TFs for protein–protein interactions.26 Thus, the employment of snow flea antifreeze protein is consistent with the fact that TRDs usually have binding sites for other proteins such as other TFs27, 28 or transcription coregulators.29 The other templates are enzymes. A TF may have a ATPase domain, for example, transcriptional activator NtrC1 in Aquifex aeolicus30 or be a metabolic enzyme too, such as Arg5,6 in yeast.31 Moreover, those templates also can define the scaffolds of TRDs for protein–protein interactions and protein–ligand binding.
Figure 5.
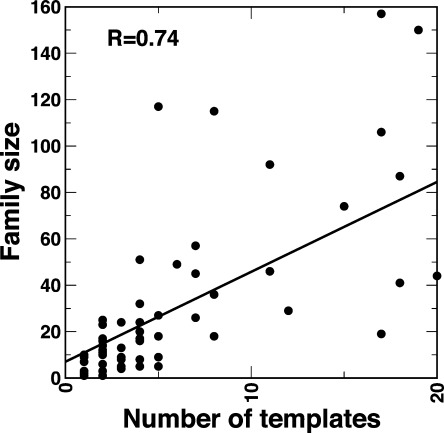
The correlation between the number of templates used and the size of families.
Table II.
The Top 10 Popular Structure Templates for TRD
| PDB ID | Gene name | Protein description | No of TF TRDs | No. of families |
|---|---|---|---|---|
| 3K29 chain A | CT670 | For protein–protein interactions | 54 | 11 |
| 2QP2 chain A | Plu1415 | MACPF/perforin-like protein | 40 | 13 |
| 3LG8 chain A | atpE | V-type ATP synthase subunit E | 35 | 16 |
| 3I4R chain B | NUP107 | subunit in the nuclear pore complex | 29 | 12 |
| 1BEF chain A | Virus NS3 serine protease | 23 | 9 | |
| 2QYU chain A | SopA | E3 ligase | 17 | 8 |
| 3DL8 chain A | secA | Protein translocase subunit | 15 | 8 |
| 2OB0 chain C | NAA50 | NatE catalytic subunit | 15 | 1 |
| 3H6L chain A | SETD2 | Histone-lysine N-methyltransferase | 14 | 2 |
| 2PNE chain A | Snow Flea Antifreeze Protein | 11 | 6 |
One can also draw a network for all TF families based on shared templates in TRD as Figure 3 for the DBD-template network graph. As shown in Figure 6, such network graph is significantly more connected than the DBD-template network. This suggests that many TFs in different families shared similar functions. There are 33 island families (e.g., ARID, LIM, SAP, MBF1, and LUG) that do not share any templates with others. Those families have several members and those members are conserved, which suggests their unique functions for plant. This network graph reveals the overlap in function similarity and evolution between different TF families based on shared TRD templates.
Figure 6.
The TRD network of TF families. Any two TF families are connected by an edge if they share at least one non-DNA-binding structure template.
Genome-scale analysis of threading
To explore possible existence of unannotated TFs, we employ SPARKS-X to predict the structures for all genes using the precollected 250 DNA-binding structures as templates.32 We obtain 270 genes (268 loci) that do not appear in the list of 2488 TFs but match to DNA-binding templates. Based on the gene ontology (GO) annotation, 92 loci are involved in DNA metabolic process, DNA repair, DNA methylation, and chromosome organization, and so forth and 43 loci are involved in helicase activities. Those are DNA-binding genes, but not TFs. In addition, 8 loci are TF or TF-like proteins according TAIR annotation. The rest 115 loci are unannotated genes. For full-length sequences, SPARKS-X returned 111 structures based on 50 templates with Z-score ≥6 and 197 structures with 78 templates were returned for half-split sequences. In 78 templates, there are 48 DNA-binding proteins, in which 21 are involved in helicase activities, 16 are related to DNA metabolism/modification, and 3 for nucleosome organization. The rest 8 structure templates are TF proteins, and 17 genes were aligned to these 8 templates. For example, the unknown gene, AT5G41614, has a template, 1A5J chain A (Z-score = 6.68), which is a B-Myb DBD, and AT2G47090 has a zinc finger protein template, 2GLI chain A, with Z-score = 13.10. The most common template, 3K7A chain M, also has been used as template by nine unknown genes.
Structural similarity of templates
A potential hierarchy structure to classify TFs is the 3D structural similiarity among DBDs.33 DBD structure templates are pairwisely compared with TMalign,34 which returns TM-scores to evaluate the structure simlairty. We use one minus TM-score as the distance between two DBD structure templates to cluster all 121 structures with a hirachical clustering algorithm. The dendrogram is shown in Figure 7. The tree of DBD templates provides a hierarchy structure to classify TFs, which can reveal more details of relationship between different TFs. If we take a cutoff of the distance (e.g., 0.5), the tree can be converted to a forest. A large subtree that has many leaves (structurally similar templates) does not correspond to a family that has large number of TFs. Especially, the most popular families, AP2, MYB, MADS, and so forth, have only one or two templates. The DBDs for these families are conserved. The members of these families are house-keeping genes that exist in every cell type. The top 10 structure templates employed for DBDs scatter in different locations of the tree. This means that those templates do not have structure similarities. That is, structurally similar templates often appear in different families as a result of diverging evolutions.
Figure 7.
The dendrogram of DBD structure templates based on their structural similarity evaluated by the TM-score.34
If we use the enriched DBD template as the representation for a TF family, Figure 7 can be used to reclassify TF families according to structural similarities between the representative DBD templates. If TM-Score = 0.65 is employed as a cutoff for family clusters, we can divide TF families into 56 family clusters. Results are shown in Figure 8. All DBD structure templates are grouped into 56 structural clusters according to their structural similarity. Each structural cluster (shown as the inner circle) has 1–17 structure templates (the outer circle). In general, one TF family has one DBD structure template. Since it has one or more structure templates, one structural cluster corresponds to one or more TF families. If a structural cluster has one structure template that corresponds to one TF family, this structural cluster is named as the family name (mostly actually the DBD name). Otherwise, the structural cluster is named as their common structure feature. For example, homeodomain and myb domain, and so forth, have a helix-turn-helix structure, and the structure cluster having them is called 3Helix for short.
Figure 8.
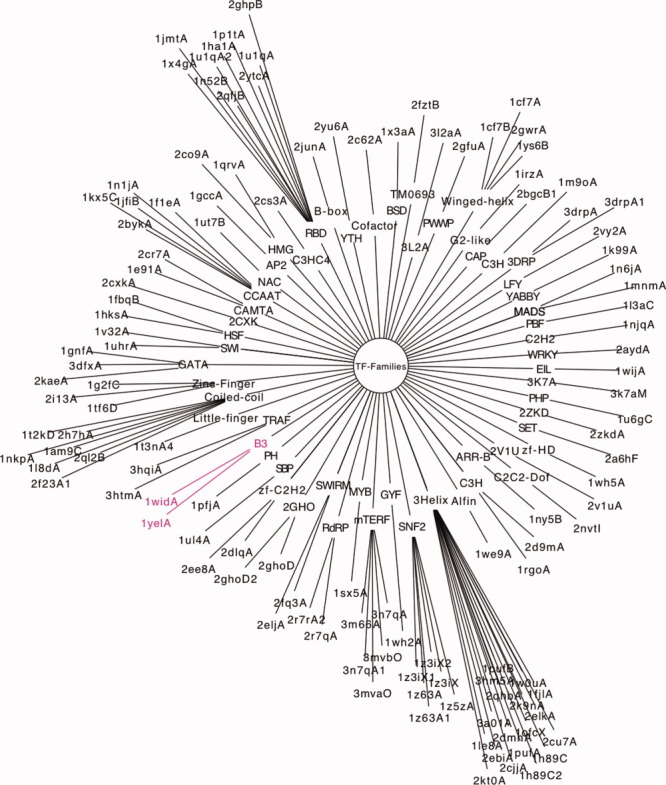
All DBD structure templates are grouped into 56 structural clusters according to their structural similarity. [Color figure can be viewed in the online issue, which is available at wileyonlinelibrary.com.]
Structural similarity can refine classification within a family as well. As shown in Figure 8, TFs in bHLH family have three different structure templates: 2QL2 chain B, 1NKP chain A, and 1AM9 chain C. Although they have similar helix-loop-helix structures, the structural details are not same. Therefore, the TFs using these three different templates may be grouped into three different branches, where 2QL2 chain B, 1NKP chain A have more similarity than with 1AM9 chain C. According to the dendrogram, 1K99, 2CO9, and 1QRV have the same ancestor node, and they are all HMG-box in human, mice, and fruit flies. Most members of family C2C2-YABBY use 1K99 and 1QRV as their template, while members of HMG family use 2CO9 as their template. This means C2C2-YABBY family and HMG family have more similar DBD structures than other families.
Specific TF families
ABI3-VP1 TF families
TFs in family ABI3-VP1 have a DNA binding domain B3 of PvAlf, a Phaseolus vulgaris ABI3 like factor, which can bind the DNA sequences of TGTCTC, CATGCA and CACCTG.24 Two templates, 1YEL chain A and 1WID chain A, are used to model TFs in this family. Both templates have a B3 domain with a similar size (92 amino acid residues in 1YEL and 105 in 1WID). Their rmsd is 2.42 Å and sequence identity is only 30%. Interestingly, more than 35 genes in ABI3-VP1 family have the 1YEL template on both N- and C-termini, while other 14 TFs used the 1WID template, and most of them have it on N-termini. As shown in Figure 8 (in red color), members in family ABI3-VP1 can be further grouped into two subfamilies: one has tandem B3 boxes and the other has a single B3 box on the N-terminus.
NAC family
NAC family, named from NAM (No Apical Meristem) in Petunia, ATAF1,2 and CUC2 in A. thaliana, is one of the largest plant specific TF families. TFs in NAC family have a conserved family-defining domain on N-terminal regions.35, 36 According to the modeled structures, all N-termini of TFs in this family are aligned to 1UT7, a member of NAC family in A. thaliana, except AT1G64100.2. Interestingly, eight NAC TFs have the same structural template, 1UT7, on both N- and C-termini. It was suggested that the C-terminal regions of TFs in NAC family are highly diverse.36 However, our structure prediction indicates that the C-terminal regions of NAC TFs can be grouped into two structural categories only. One is a DNA binding structure with a template structure of 3K7A chain M, and the other is a helical structure with 2QP2 chain A as template. AT1G64100.2, on the other hand, has been aligned to 1W3B chain A on both N- and C-termini (Z-score: 9.03 and 8.01, respectively). 1W3B is the superhelical TPR domain of O-linked GlcNAc transferase. This result suggests that this gene might not be a member of this family or a TF.
C2C2-CO-like family
C2C2-CO-like family has been identified as a family of CONSTANS-LIKE genes (COLs) in A. thaliana and other plants. CONSTANS is a putative zinc finger TF, which is the first isolated transcription factor that promotes the induction of flowering in A. thaliana in long photoperiods.37, 38 The members in C2C2-CO-like family have CCT and zf-B_box domains. The CCT domain, about 45 AA long, contains a putative nuclear localization signal and Toc1 mutants have been identified in this region.35 The zf-B_box domain is a B-box-type zinc finger domain, whose length is around 40 AA.39 These two domains are short, and the total length of these two domains (about 85AA) is only 21–28% of the length of TFs in the C2C2-CO-like family (about 300–400 AA). Most N-terminal tails of TFs in C2C2-CO-like family, 15 out of 22 TFs, have the same structural template of tandem B-boxes, 2JUN chain A. Most C-termini of TFs in this family, 18 out of 21 TFs (on 17 loci), employ the structural template of 3K7A chain M, which is a general transcription factor TFIIB. Nag et al.40 suggested that the C-terminal regions of TFs in the C2C2-CO-like family have the function of nuclear localization. Our result indicates that TFs in this family also use the C-terminus for TF interactions and DNA binding.
Examples of predicted structures
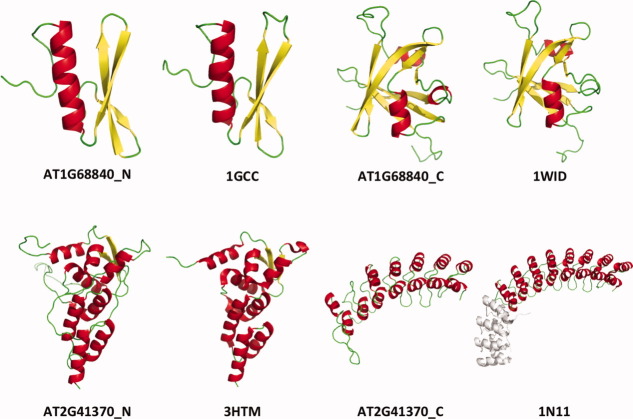
Only a small number of TFs of A. thaliana has solved crystal structures in Protein Data Bank (16 structures by the end of 2010), and most of them are only a short TF fragment. In 1998, a GCC-box binding protein in A. thaliana was solved (1GCC), but the structure only has 60 residues.41 It has been claimed that AT1G68840 is RAV2 gene in RAVE subfamily of AP2-EREBP family and RAVE genes play an important role in flower development.42, 43 Some studies suggested that the C-terminal region of AT1G68840 has a conserved B3 domain,44 but the three-dimensional structure is not known. Here, we find that the N-terminal fragment of AT1G68840 has the structural template of GCC-box binding domain (1GCC) and the GCC-box binding domain is the character structure of the AP-EREBP family.3 We further find that the C-terminal fragment has a structural template of 1WID chain A, a B3 domain in RAV1 (Fig. 9 upper panel).
Figure 9.
Upper panel: The N-terminal model of AT1G68840 and its template 1GCC (Z-score = 16.42); the C-terminal model of AT1G68840 and its template 1WID (Z-score = 13.09). Lower panel: the N-terminal model of AT2G41370 and its template 3HTM (Z-score = 12.27); the C-terminal model of AT2G41370 and its template 1N11 (Z-score = 15.88). [Color figure can be viewed in the online issue, which is available at wileyonlinelibrary.com.]
The TFs in TRAF family have a BTB domain, which is also known as the POZ domain and is a versatile domain motif that participates in a wide range of cellular functions.45 Several BTB domain structures have been experimentally determined, revealing a highly conserved core structure, for example, 3HTM for the speckle-type POZ protein in human.46 As a member of TRAF family, AT2G41370 (BOP2) uses 3HTM as a structural template for its N-terminus. The C-terminus of AT2G41370 has another template, 1N11 chain A. The C-terminal model of AT2G41370 shows that the structure of this TF has 7 ankyrin repeats (Fig. 9 lower panel). The ankyrin repeat is a very common protein–protein interaction motif in nature and occurs in a large number of functionally diverse proteins. The results agree with previous studies that showed this gene interacts with other genes to control leaf and/or flower development.47–49
Online database
We deposit all modeled structures of TFs in an online database, and it is available at http:// sysbio.unl.edu/AthTF. All TFs are categorized in families for browsing convenience, and the server provides a query function to search a specific TF with its gene ID and a query to search all TFs that share the same structure template with the PDB ID of the template. The structures of our predicted DNA-binding proteins are also modeled and included in the database. The modeled structures of all proteins, including both TFs and predicted DNA-binding proteins, are free for downloading.
Materials and Methods
We collect TF sequences in A. thaliana from several different databases. They are PlnTFDB v3.0 (http://plntfdb.bio.uni-potsdam.de/v3.0/),21 DATF (http://datf.cbi.pku.edu.cn/),50 and AtTFDB (http://arabidopsis. med.ohio-state.edu/AtTFDB/).51 The total number of TF genes is 2488 (2182 loci) in 100 families (family names from PlnTFDB and DATF). Besides those TFs, we also use SPARKS-X to predict DNA-binding proteins in A. thaliana. A total of 646 predicted DNA-binding proteins are returned, and 270 (268 loci) of them do not appear in the list of 2488 TFs. The structures of those proteins are also modeled and deposited them into the database as well. Since DNA-binding proteins are not necessary to be TFs, we list those predicted DNA-binding proteins as an independent category. Some of those proteins whose structure templates are TFs are also included in the analysis.
Acknowledgments
Some of this work was completed utilizing the Holland Computing Center of the University of Nebraska. T.L. and Y.Y. designed the study, conducted calculation and data analysis. B.Y. and C.Z. built the web servers. Y.Z., C.Z., and S.L. drafted the manuscript. Y.Z. and C.Z. supervised the study. All authors read and approved the final manuscript.
References
- 1.The Arabidopsis Genome Initiative. Analysis of the genome sequence of the flowering plant Arabidopsis thaliana. Nature. 2000;408:796–815. doi: 10.1038/35048692. [DOI] [PubMed] [Google Scholar]
- 2.Riechmann JL, Heard J, Martin G, Reuber L, Jiang C, Keddie J, Adam L, Pineda O, Ratcliffe OJ, Samaha RR, Creelman R, Pilgrim M, Broun P, Zhang JZ, Ghandehari D, Sherman BK, Yu G. Arabidopsis transcription factors: genome-wide comparative analysis among eukaryotes. Science. 2000;290:2105–2110. doi: 10.1126/science.290.5499.2105. [DOI] [PubMed] [Google Scholar]
- 3.Mitsuda N, Ohme-Takagi M. Functional analysis of transcription factors in Arabidopsis. Plant Cell Physiol. 2009;50:1232–1248. doi: 10.1093/pcp/pcp075. [DOI] [PMC free article] [PubMed] [Google Scholar]
- 4.Berman H, Henrick K, Nakamura H. Announcing the worldwide Protein Data Bank. Nat Struct Biol. 2003;10:980. doi: 10.1038/nsb1203-980. [DOI] [PubMed] [Google Scholar]
- 5.Kihara D, Skolnick J. The PDB is a covering set of small protein structures. J Mol Biol. 2003;334:793–802. doi: 10.1016/j.jmb.2003.10.027. [DOI] [PubMed] [Google Scholar]
- 6.Moult J. A decade of CASP: progress, bottlenecks and prognosis in protein structure prediction. Curr Opin Struct Biol. 2005;15:285–289. doi: 10.1016/j.sbi.2005.05.011. [DOI] [PubMed] [Google Scholar]
- 7.Zhang Y, Hubner IA, Arakaki AK, Shakhnovich E, Skolnick J. On the origin and highly likely completeness of single-domain protein structures. Proc Natl Acad Sci USA. 2006;103:2605–2610. doi: 10.1073/pnas.0509379103. [DOI] [PMC free article] [PubMed] [Google Scholar]
- 8.Dai L, Zhou Y. Characterizing the existing and potential structural space of proteins by large-scale multiple loop permutations. J Mol Biol. 2011;408:585–595. doi: 10.1016/j.jmb.2011.02.056. [DOI] [PMC free article] [PubMed] [Google Scholar]
- 9.Zhang Y, Thiele I, Weekes D, Li Z, Jaroszewski L, Ginalski K, Deacon AM, Wooley J, Lesley SA, Wilson IA, Palsson B, Osterman A, Godzik A. Three-dimensional structural view of the central metabolic network of Thermotoga maritima. Science. 2009;325:1544–1549. doi: 10.1126/science.1174671. [DOI] [PMC free article] [PubMed] [Google Scholar]
- 10.Zhou H, Zhou Y. Single-body residue-level knowledge-based energy score combined with sequence-profile and secondary structure information for fold recognition. Proteins. 2004;55:1005–1013. doi: 10.1002/prot.20007. [DOI] [PubMed] [Google Scholar]
- 11.Zhou H, Zhou Y. Fold recognition by combining sequence profiles derived from evolution and from depth-dependent structural alignment of fragments. Proteins. 2005;58:321–328. doi: 10.1002/prot.20308. [DOI] [PMC free article] [PubMed] [Google Scholar]
- 12.Liu S, Zhang C, Liang S, Zhou Y. Fold recognition by concurrent use of solvent accessibility and residue depth. Proteins. 2007;68:636–645. doi: 10.1002/prot.21459. [DOI] [PubMed] [Google Scholar]
- 13.Zhang W, Liu S, Zhou Y. SP5: improving protein fold recognition by using torsion angle profiles and profile-based gap penalty model. PLoS One. 2008;3:e2325. doi: 10.1371/journal.pone.0002325. [DOI] [PMC free article] [PubMed] [Google Scholar]
- 14.Yang Y, Faraggi E, Zhao H, Zhou Y. Improving protein fold recognition and template-based modeling by employing probabilistic-based matching between predicted one-dimensional structural properties of the query and corresponding native properties of templates. Bioinformatics. 2011;27:2076–2082. doi: 10.1093/bioinformatics/btr350. [DOI] [PMC free article] [PubMed] [Google Scholar]
- 15.Moult J, Pedersen JT, Judson R, Fidelis K. A large-scale experiment to assess protein structure prediction methods. Proteins. 1995;23:ii–v. doi: 10.1002/prot.340230303. [DOI] [PubMed] [Google Scholar]
- 16.Zhou H, Zhou Y. SPARKS 2 and SP3 servers in CASP6. Proteins. 2005;61(Suppl 7):152–156. doi: 10.1002/prot.20732. [DOI] [PubMed] [Google Scholar]
- 17.Faraggi E, Xue B, Zhou Y. Improving the prediction accuracy of residue solvent accessibility and real-value backbone torsion angles of proteins by guided-learning through a two-layer neural network. Proteins. 2009;74:847–856. doi: 10.1002/prot.22193. [DOI] [PMC free article] [PubMed] [Google Scholar]
- 18.Zhao H, Yang Y, Zhou Y. Highly accurate and high-resolution function prediction of RNA binding proteins by fold recognition and binding affinity prediction. RNA Biol. 2011;8:988–996. doi: 10.4161/rna.8.6.17813. [DOI] [PMC free article] [PubMed] [Google Scholar]
- 19.Altschul SF, Madden TL, Schaffer AA, Zhang J, Zhang Z, Miller W, Lipman DJ. Gapped BLAST and PSI-BLAST: a new generation of protein database search programs. Nucleic Acids Res. 1997;25:3389–3402. doi: 10.1093/nar/25.17.3389. [DOI] [PMC free article] [PubMed] [Google Scholar]
- 20.Luscombe NM, Austin SE, Berman HM, Thornton JM. An overview of the structures of protein-DNA complexes. Genome Biol. 2000;1:Reviews001. doi: 10.1186/gb-2000-1-1-reviews001. [DOI] [PMC free article] [PubMed] [Google Scholar]
- 21.Perez-Rodriguez P, Riano-Pachon DM, Correa LG, Rensing SA, Kersten B, Mueller-Roeber B. PlnTFDB: updated content and new features of the plant transcription factor database. Nucleic Acids Res. 2010;38:D822–D827. doi: 10.1093/nar/gkp805. [DOI] [PMC free article] [PubMed] [Google Scholar]
- 22.Miller J, McLachlan AD, Klug A. Repetitive zinc-binding domains in the protein transcription factor IIIA from Xenopus oocytes. EMBO J. 1985;4:1609–1614. doi: 10.1002/j.1460-2075.1985.tb03825.x. [DOI] [PMC free article] [PubMed] [Google Scholar]
- 23.Thomas JO, Travers AA. HMG1 and 2, and related ‘architectural’ DNA-binding proteins. Trends Biochem Sci. 2001;26:167–174. doi: 10.1016/s0968-0004(01)01801-1. [DOI] [PubMed] [Google Scholar]
- 24.Suzuki M, Kao CY, McCarty DR. The conserved B3 domain of VIVIPAROUS1 has a cooperative DNA binding activity. Plant Cell. 1997;9:799–807. doi: 10.1105/tpc.9.5.799. [DOI] [PMC free article] [PubMed] [Google Scholar]
- 25.Barabasi AL, Oltvai ZN. Network biology: understanding the cell's functional organization. Nat Rev Genet. 2004;5:101–113. doi: 10.1038/nrg1272. [DOI] [PubMed] [Google Scholar]
- 26.Kay BK, Williamson MP, Sudol M. The importance of being proline: the interaction of proline-rich motifs in signaling proteins with their cognate domains. FASEB J. 2000;14:231–241. [PubMed] [Google Scholar]
- 27.Johnston SA, Zavortink MJ, Debouck C, Hopper JE. Functional domains of the yeast regulatory protein GAL4. Proc Natl Acad Sci USA. 1986;83:6553–6557. doi: 10.1073/pnas.83.17.6553. [DOI] [PMC free article] [PubMed] [Google Scholar]
- 28.Jensen MK, Kjaersgaard T, Nielsen MM, Galberg P, Petersen K, O'Shea C, Skriver K. The Arabidopsis thaliana NAC transcription factor family: structure–function relationships and determinants of ANAC019 stress signalling. Biochem J. 2010;426:183–196. doi: 10.1042/BJ20091234. [DOI] [PubMed] [Google Scholar]
- 29.Warnmark A, Treuter E, Wright AP, Gustafsson JA. Activation functions 1 and 2 of nuclear receptors: molecular strategies for transcriptional activation. Mol Endocrinol. 2003;17:1901–1909. doi: 10.1210/me.2002-0384. [DOI] [PubMed] [Google Scholar]
- 30.Lee SY, De La Torre A, Yan D, Kustu S, Nixon BT, Wemmer DE. Regulation of the transcriptional activator NtrC1: structural studies of the regulatory and AAA+ ATPase domains. Genes Dev. 2003;17:2552–2563. doi: 10.1101/gad.1125603. [DOI] [PMC free article] [PubMed] [Google Scholar]
- 31.Hall DA, Zhu H, Zhu X, Royce T, Gerstein M, Snyder M. Regulation of gene expression by a metabolic enzyme. Science. 2004;306:482–484. doi: 10.1126/science.1096773. [DOI] [PubMed] [Google Scholar]
- 32.Zhao H, Yang Y, Zhou Y. Structure-based prediction of DNA-binding proteins by structural alignment and a volume-fraction corrected DFIRE-based energy function. Bioinformatics. 2010;26:1857–1863. doi: 10.1093/bioinformatics/btq295. [DOI] [PMC free article] [PubMed] [Google Scholar]
- 33.Stegmaier P, Kel AE, Wingender E. Systematic DNA-binding domain classification of transcription factors. Genome Inform. 2004;15:276–286. [PubMed] [Google Scholar]
- 34.Zhang Y, Skolnick J. TM-align: a protein structure alignment algorithm based on the TM-score. Nucleic Acids Res. 2005;33:2302–2309. doi: 10.1093/nar/gki524. [DOI] [PMC free article] [PubMed] [Google Scholar]
- 35.Ooka H, Satoh K, Doi K, Nagata T, Otomo Y, Murakami K, Matsubara K, Osato N, Kawai J, Carninci P, Hayashizaki Y, Suzuki K, Kojima K, Takahara Y, Yamamoto K, Kikuchi S. Comprehensive analysis of NAC family genes in Oryza sativa and Arabidopsis thaliana. DNA Res. 2003;10:239–247. doi: 10.1093/dnares/10.6.239. [DOI] [PubMed] [Google Scholar]
- 36.Olsen AN, Ernst HA, Leggio LL, Skriver K. NAC transcription factors: structurally distinct, functionally diverse. Trends Plant Sci. 2005;10:79–87. doi: 10.1016/j.tplants.2004.12.010. [DOI] [PubMed] [Google Scholar]
- 37.Putterill J, Robson F, Lee K, Simon R, Coupland G. The CONSTANS gene of Arabidopsis promotes flowering and encodes a protein showing similarities to zinc finger transcription factors. Cell. 1995;80:847–857. doi: 10.1016/0092-8674(95)90288-0. [DOI] [PubMed] [Google Scholar]
- 38.Lagercrantz U, Axelsson T. Rapid evolution of the family of CONSTANS LIKE genes in plants. Mol Biol Evol. 2000;17:1499–1507. doi: 10.1093/oxfordjournals.molbev.a026249. [DOI] [PubMed] [Google Scholar]
- 39.Short KM, Cox TC. Subclassification of the RBCC/TRIM superfamily reveals a novel motif necessary for microtubule binding. J Biol Chem. 2006;281:8970–8980. doi: 10.1074/jbc.M512755200. [DOI] [PubMed] [Google Scholar]
- 40.Nag R, Maity MK, Dasgupta M. Dual DNA binding property of ABA insensitive 3 like factors targeted to promoters responsive to ABA and auxin. Plant Mol Biol. 2005;59:821–838. doi: 10.1007/s11103-005-1387-z. [DOI] [PubMed] [Google Scholar]
- 41.Allen MD, Yamasaki K, Ohme-Takagi M, Tateno M, Suzuki M. A novel mode of DNA recognition by a β-sheet revealed by the solution structure of the GCC-box binding domain in complex with DNA. EMBO J. 1998;17:5484–5496. doi: 10.1093/emboj/17.18.5484. [DOI] [PMC free article] [PubMed] [Google Scholar]
- 42.Seol JH, Shevchenko A, Deshaies RJ. Skp1 forms multiple protein complexes, including RAVE, a regulator of V-ATPase assembly. Nat Cell Biol. 2001;3:384–391. doi: 10.1038/35070067. [DOI] [PubMed] [Google Scholar]
- 43.Kagaya Y, Hattori T. Arabidopsis transcription factors, RAV1 and RAV2, are regulated by touch-related stimuli in a dose-dependent and biphasic manner. Genes Genet Syst. 2009;84:95–99. doi: 10.1266/ggs.84.95. [DOI] [PubMed] [Google Scholar]
- 44.Kagaya Y, Ohmiya K, Hattori T. RAV1, a novel DNA-binding protein, binds to bipartite recognition sequence through two distinct DNA-binding domains uniquely found in higher plants. Nucleic Acids Res. 1999;27:470–478. doi: 10.1093/nar/27.2.470. [DOI] [PMC free article] [PubMed] [Google Scholar]
- 45.Stogios PJ, Downs GS, Jauhal JJ, Nandra SK, Prive GG. Sequence and structural analysis of BTB domain proteins. Genome Biol. 2005;6:R82. doi: 10.1186/gb-2005-6-10-r82. [DOI] [PMC free article] [PubMed] [Google Scholar]
- 46.Zhuang M, Calabrese MF, Liu J, Waddell MB, Nourse A, Hammel M, Miller DJ, Walden H, Duda DM, Seyedin SN, Hoggard T, Harper JW, White KP, Schulman BA. Structures of SPOP-substrate complexes: insights into molecular architectures of BTB-Cul3 ubiquitin ligases. Mol Cell. 2009;36:39–50. doi: 10.1016/j.molcel.2009.09.022. [DOI] [PMC free article] [PubMed] [Google Scholar]
- 47.Ha CM, Jun JH, Nam HG, Fletcher JC. BLADE-ON-PETIOLE 1 and 2 control Arabidopsis lateral organ fate through regulation of LOB domain and adaxial-abaxial polarity genes. The Plant cell. 2007;19:1809–1825. doi: 10.1105/tpc.107.051938. [DOI] [PMC free article] [PubMed] [Google Scholar]
- 48.Ha CM, Jun JH, Fletcher JC. Control of Arabidopsis leaf morphogenesis through regulation of the YABBY and KNOX families of transcription factors. Genetics. 2010;186:197–206. doi: 10.1534/genetics.110.118703. [DOI] [PMC free article] [PubMed] [Google Scholar]
- 49.Jun JH, Ha CM, Fletcher JC. BLADE-ON-PETIOLE1 coordinates organ determinacy and axial polarity in Arabidopsis by directly activating ASYMMETRIC LEAVES2. Plant cell. 2010;22:62–76. doi: 10.1105/tpc.109.070763. [DOI] [PMC free article] [PubMed] [Google Scholar]
- 50.Guo A, He K, Liu D, Bai S, Gu X, Wei L, Luo J. DATF: a database of Arabidopsis transcription factors. Bioinformatics. 2005;21:2568–2569. doi: 10.1093/bioinformatics/bti334. [DOI] [PubMed] [Google Scholar]
- 51.Palaniswamy SK, James S, Sun H, Lamb RS, Davuluri RV, Grotewold E. AGRIS and AtRegNet. a platform to link cis-regulatory elements and transcription factors into regulatory networks. Plant Physiol. 2006;140:818–829. doi: 10.1104/pp.105.072280. [DOI] [PMC free article] [PubMed] [Google Scholar]


