

Abstract
The high-resolution NMR structure of the N-domain of human eRF1, responsible for stop codon recognition, has been determined in solution. The overall fold of the protein is the same as that found in the crystal structure. However, the structures of several loops, including those participating in stop codon decoding, are different. Analysis of the NMR relaxation data reveals that most of the regions with the highest structural discrepancy between the solution and solid states undergo internal motions on the ps–ns and ms time scales. The NMR data show that the N-domain of human eRF1 exists in two conformational states. The distribution of the residues having the largest chemical shift differences between the two forms indicates that helices α2 and α3, with the NIKS loop between them, can switch their orientation relative to the β-core of the protein. Such structural plasticity may be essential for stop codon recognition by human eRF1.
Keywords: termination of protein synthesis, human polypeptide release factor eRF1, N-domain, NMR structure and dynamics, stop codon recognition
Introduction
The molecular mechanism of translation is the focus of intensive studies. While most aspects of this complex process have been explored in detail, the mechanism of termination still has several unanswered questions. The mechanism of stop codon recognition by the class 1 eukaryotic release factor eRF1 is one of such issues (reviewed in Refs.1 and2). It has been determined that the prokaryotic release factors, RF1 and RF2, recognize pairs of stop codons (UAG/UAA and UGA/UAA, respectively) through interactions with the so-called tripeptide “anticodon” regions of mRNA.3–6 In contrast to their prokaryotic analogues, the eukaryotic termination factor, eRF1, from organisms using the universal genetic code is equally able to recognize all three stop codons (reviewed in Ref.7).
The crystal structure of eRF18, 9 shows that the protein contains three spatially separated domains (the N-, M-, and C- domains). Functional analysis of eRF110 has suggested that the N-terminal domain is involved in stop codon recognition. More recently, the role of the N-domain has been confirmed unambiguously: chimeric eRF1s, in which the N- and MC-domains were derived from variant-code ciliate organisms11, 12 and human/yeast eRF1, respectively, exhibit ciliate stop codon decoding specificity in vitro.13–16 Several hypotheses for the molecular mechanism of stop codon recognition by eRF1 have been suggested,9, 17–23 but none satisfactorily explain the available experimental data which are somewhat contradictory.
High-quality structural information is essential for understanding the nature of the mRNA–eRF1 interaction. However, atomic resolution data for eukaryotic termination complexes are unavailable; and the quality of the eRF1 crystal structures8, 9 also leaves something to be desired, as several regions of the protein are ill-defined. Previously we determined the structure of the middle (M) and C-terminal domains of human eRF1 in solution.24, 25 Clear distinctions between the protein conformations in solution and in crystals were found for both the M- and the C-domains, especially for their functionally important regions. Some chemical shift assignments for a limited set of the signals (Cα, Cβ, 1HN, and 15N) of the N-domain of human eRF1 have been reported26 but the structure of the N-domain in solution was not determined. Here we report the high-resolution solution NMR structure of the N-terminal domain of human eRF1, responsible for stop codon decoding, and present data on its dynamics.
Results
Resonance assignment
1H, 13C, and 15N chemical shifts were assigned for more ∼ 99% of the protein backbone resonances of the isolated N-domain. More than 85% of all the side chain 1H, 13C, and 15N chemical shifts were also assigned. The amide HN and 15N signals of the residue Asn86 could not be observed in the 15N–1H HSQC spectra and the signals of residues Arg65, Glu103, and Thr133 had reduced intensities, probably due to fast exchange with water. Several residues had duplicate sets of signals with a ratio of intensities of ∼5:1 (Supporting Information Fig. S1). This indicates the presence of at least two conformational states of the protein.
Structure determination
A family of 20 NMR structures was determined on the basis of 3092 experimental restraints measured at 298 K (see Table I and Supporting Information Fig. S2). The statistics of the final ensemble are given in Table I and the superposition of the final calculated family is presented in Figure 1(A) (the backbone atoms of the N-domain of the human eRF1 crystal structure8 are also shown in red for comparison). The RMSD of the calculated family from the representative structure is less than 0.5 Å for the backbone heavy atoms of the residues 6–142. In the Ramachandran plot analysis (Supporting Information Fig. S3), 93.3% of the residues in the whole NMR family were found in the most favored regions and none in the disallowed regions.
Table I.
NMR Restraints and Structural Statistics for the N-Terminal Domain of Homo sapiens Polypeptide Chain Release Factor eRF1
| A. Restraints used in the structure calculation | |||
|---|---|---|---|
| Total NOEs | 2631 | Total dihedral angles | 316 |
| Long range (|i − j| > 4 ) | 519 | Phi (ϕ) | 126 |
| Medium (1 < |i − j| ≤ 4 ) | 494 | Psi (ψ) | 126 |
| Sequential (|i − j| = 1 ) | 638 | Chi1 (χ1) | 64 |
| Intraresidue | 975 | ||
| Ambiguous | 5 | ||
| H-bonds | 76 | Residual dipolar couplings | 69 |
| B. Restraint violations and structural statistics (for 20 structures) | |||
|---|---|---|---|
| No NOE or dihedral angle violations are above 0.1 Å and 2°, respectively. | |||
| No residues are in disallowed regions of the Ramachandran plot. | |||
| CNS energies (kcal mol−1)a | <S>b | Srep | |
| ENOE | 6.46 ± 0.87 | 6.83 | |
| ECDIH | 0.84 ± 0.24 | 1.08 | |
| ESANI | 1.84 ± 0.14 | 1.54 | |
| Average RMSD | |||
| From experimental restraints | |||
| Distance (Å) | 0.0059 ± 0.0005 | 0.0060 | |
| Dihedral (°) | 0.1459 ± 0.0206 | 0.1680 | |
| From idealised covalent geometry | |||
| Bonds (Å) | 0.0012 ± 0.0001 | 0.0013 | |
| Angles (°) | 0.3312 ± 0.0053 | 0.3320 | |
| Impropers (°) | 0.1915 ± 0.0118 | 0.1880 | |
| % residues in the most favorable regions of Ramachandran plot | 93.3 | 93.7 | |
| % residues in additional allowed regions of Ramachandran plot | 6.2 | 4.8 | |
| C. Superimposition on the representative structure (Å) | |
|---|---|
| Backbone (C, Cα, N) RMSD of the residues 6–142 | 0.510 ± 0.087 |
| Heavy-atom RMSD of residues 6–142 | 1.031 ± 0.076 |
ENOE, ECDIH, and ESANI are the values of NOE, dihedral angle, and residual dipolar coupling energy target functions. The final force constants used for their calculation in the simulated annealing protocol were 50 kcal mol−1 Å2 for NOE and 50 kcal mol−1 grad2 for dihedral angles.
<S> is the ensemble of 20 final structures; Srep is the representative structure, selected from the final family on the criteria of having the lowest sum of pairwise RMSD relative to the remaining structures in the family.
Figure 1.
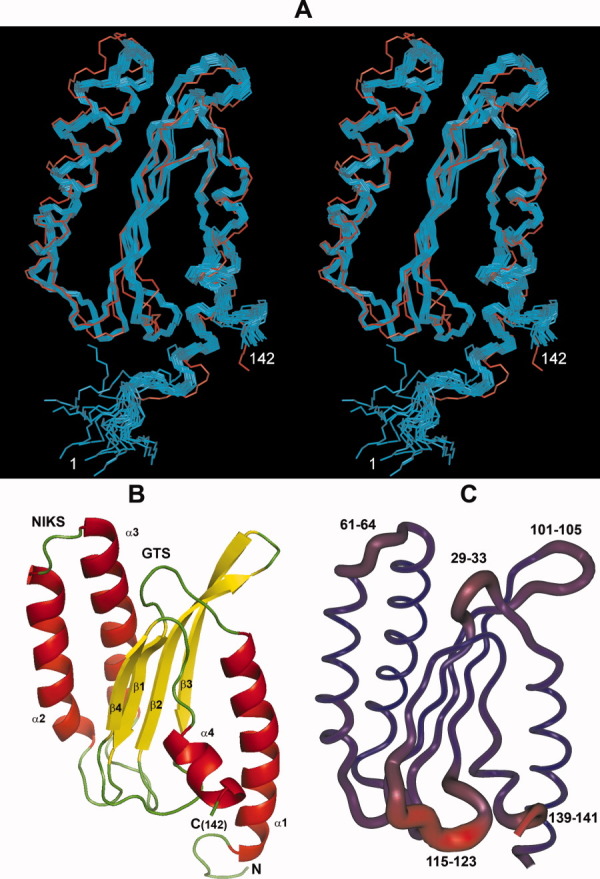
NMR solution structure of the N-domain of the human polypeptide chain release factor eRF1. (A). The stereo view of the ensemble of the final 20 calculated NMR structures superimposed on the heavy backbone atoms (Cα, N, and C) of the residues 6–142 of the representative structure. The crystal structure of the N-domain of the human eRF18 is superimposed on the same set of atoms and is shown in red. (B). The topology of the N-domain of human eRF1 and the secondary structure elements displayed using PyMol. (C). Ribbon representation of the backbone of the N-domain of human eRF1. The thickness of the ribbon is proportional to the RMSD values for the heavy atoms of each residue i after superposition of the family of 20 NMR structures onto the crystal structure using the set of backbone atoms of the four adjacent residues (i–2, i–1, i+1, and i+2).
Backbone dynamics
Supporting Information Figure S4 presents the experimentally obtained relaxation rates R1 and R2 and NOE values for the amide 15N nuclei measured at 298 K, the calculated values of the order parameter S2 and the conformational exchange contributions to the transverse relaxation rates Rex. The relaxation parameters were obtained using a model with an axially symmetric diffusion tensor. The order parameter is smallest for the N- and C-terminal residues and also for the residues in several loops (30–33, 64, 106–108, 122–123). This indicates the regions in the structure where there is the highest amplitude of internal motions. The average correlation time (1/(2D∥ + 4D⟂) was 11.04 ± 0.16 ns and the ratio of the principal axis of the tensor (D∥/D⟂) was 1.6 ± 0.1. The best model that allows the most successful fit of the experimental data is that based on two internal motions with correlation times of 1.05 ± 0.05 ns and <50 ps (Supporting Information Fig. S5).
Comparison of the crystal and solution structures
The topology of the N-domain of human eRF1 can be described as a β-sheet core formed from four anti-parallel β-strands, surrounded by four helices, α1–α4 [Fig. 1(B)]. There are also a number of loops of differing lengths, some of which are reported to be involved in stop codon recognition. For example, the loop between helices α2 and α3 contains conserved NIKS tetrapeptide. The overall fold of the N-domain of human eRF1 is the same in the crystal and solution structures but the detailed structures are far from identical [Fig. 1(A)]. The RMSD of the superposition of the heavy backbone atoms (Cα, N, O, and C′) of the family of 20 NMR structures onto the crystal structure of the N-domain is 1.8 ± 0.1 Å.
To identify the goodness of fit of the solution and crystal structures and the regions of the maximum displacement, local RMSD values ρi27 were calculated for local pairwise superposition of the two structures (Supporting Information Fig. S6). The thickness of the ribbon [shown in Fig. 1(C)] is proportional to the ρi values, which reflects the degree of divergence of the local protein backbone geometry in the two structures.
Minor protein conformer
Signals from several amino acids of the N-domain of human eRF1 are observed in NMR spectra as double peaks, representing major (80–90%) and minor (10–20%) components. The assignment of the minor conformer peaks is based on the characteristic cross peaks in the 3D heteronuclear spectra, including the NOESY spectra. Supporting Information Fig S1 illustrates the two sets of signals in the 15N–1H HSQC spectrum of the protein backbone and side chain amide groups.
Discussion
A comparison of the structure of the N-domain in solution and in the crystal showed that its N- and C-termini and most of the protein loops show clear differences in their backbone conformations. This can either be due to real structural differences between the protein in the crystal and in solution or to the absence of the neighboring M- and C-domains in the structure solved by NMR. It is likely that the differences in the protein conformation of loop 115–123 (having the largest RMSD values, Fig. 1(C), Supporting Information Fig S4B) and the C terminus originate from the absence of the neighboring M- and C-domains in the solution structure. The changes in residues 41–42 and 89–91 are likely to be secondary effects caused by the conformational change of loop 115–123. However, loops 29–33, 61–64, and 101–105 [Fig. 1(C)] are all far from both M- and C-domains and therefore their large structural displacement is very likely to reflect real conformational differences between the crystal and solution states. It should be noted that loop 61–64 contains the conserved NIKS tetrapeptide sequence which is thought to be involved in the recognition of the first uridine of the stop codons20, 21 and the strictly conserved GTS loop sequence (position 31–33) which is implicated in the decoding of the stop codons.18, 20, 28, 29
The ability of human eRF1 to recognize each of the three stop codons UAA, UAG, and UGA and to distinguish them from the UGG tryptophan codon cannot be explained in terms of a simple static interaction.30 It is obvious that the N-domain of human eRF1 should be able to undergo conformational rearrangements – not only in solution but also inside the ribosome. Therefore the elucidation of the dynamic properties of this protein is crucial for understanding the mechanism of stop codon recognition. Model-free analysis of the relaxation data shows that there are several protein regions that undergo backbone motions with a correlation time of about 1 ns. Among these are residues 30–31, 64, and 122–123. Several other residues (45, 54–57, 63, 67, 134–135) were found to undergo conformational rearrangements on the ms time scale. These results are summarized in Figure 2(A), where residues undergoing fast (ns) motions are shown as yellow and those involved in slower (ms) motions are shown in red. It can be seen that two helices (α2 and α3), with NIKS loop between them, and two other loops (29–33 and 101–105) have high conformational plasticity. These protein regions are likely to be involved in stop codon recognition, either by their direct interaction with mRNA or by induced conformational rearrangements from the recognition sites.
Figure 2.
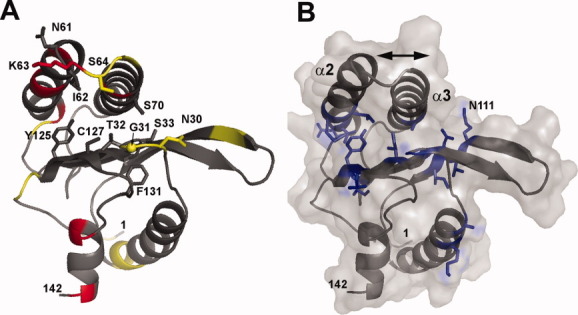
Dynamic and conformational behavior of the N-domain of human eRF1. (A). Representative structure of the N-domain colored in accordance with protein mobility on the ps–ns and ms time scale. Residues which have order parameters S2 less than 0.75 are colored yellow, and those which have substantial chemical exchange Rex contributions to the transverse relaxation rate are colored red. The side chains of the functionally important residues are shown. Cα of residue G31 is also shown by a sphere. (B). A representative structure and molecular surface of the N-domain. Side chains of residues which have large chemical shift differences between the major and minor conformers are shown in blue. The arrow represents the hypothetical movement of the helices, α2 and α3, which can explain special features of the two protein conformers.
Interesting information can also be obtained from an analysis of the residues which have duplicated signals in the NMR spectra and their distribution within the structure [Fig. 2(B)]. The duplication indicates that the protein exists in two conformational states with a ratio of the major to minor forms of about 5:1. Those residues which have large chemical shift differences between the two forms should be close to the center of the conformational rearrangement. Most of these residues are located at the interface between the β-sheet core of the protein and helices α2 and α3. Their distribution [Fig. 2(B)] hints at a possible conformational rearrangement. This could be due to a change of helix orientation against the bundle of β-strands. For example, the chemical shifts of the side chain of Asn111 are substantially different between the major and minor protein conformations. It is very likely that residue Asn111, which is isolated in the major form, becomes close to the helix α3 in the minor form.
It is of interest and possible mechanistic importance that the location of the highest amplitude internal motions, the residues from the GTS and NIKS loops of eRF1, coincide with the published experimental data suggesting that amino acids in these regions of the N-domain of eRF1 are essential for stop codon decoding.
Materials and Methods
Sample preparation
The DNA fragment encoding the N-domain of human eRF1 (residues 1–142) with a C-terminal His6-tag fusion was cloned into the pET23b(+) vector (Novagen) under the phage T7 RNA polymerase promoter. N-eRF1 was overproduced in E. coli, strain BL21(DE3), in M9 minimal medium and isolated using Ni-NTA resin (Qiagen). The protein was further purified by cation exchange chromatography using HiTrap SP columns (GE Healthcare). For 13C- and/or 15N-isotope labeling, [13C6]-d-glucose and/or 15NH4Cl (Cambridge Isotope Laboratories Inc.) were used as the isotope sources in M9 minimal medium. The samples for NMR (protein concentration ∼1 mM) were prepared in either 90% H2O/10% D2O or in 100% D2O and 10 mM sodium phosphate, 25 mM NaCl, pH 6.8. β-mercaptoethanol (∼2 mM) was added to the final solution to prevent oxidation of the free cysteine residues Cys97 and Cys127. Shigemi microcell NMR tubes, containing 330–380 μL, were used for collection of the NMR spectra.
NMR spectroscopy
All spectra were acquired on Varian INOVA 600 and 800 MHz and Bruker AVANCE 600 MHz spectrometers equipped with triple resonance z-gradient probes. The 800 MHz spectrometer was equipped with a cryoprobe. Spectra were processed by NMRPipe31 and analyzed using SPARKY.32 Sequential backbone assignments and side chains assignments were obtained using the following 2D and 3D spectra: DQF-COSY, [13C,1H] HSQC, [15N,1H] HSQC, HNCO, HNCACB, CBCA (CO)NH, HBHA(CO)NH, HNHA, HNHB, HCC(CO)NH, and HCCH-TOCSY33 measured at 298 K. Assignments were obtained for ∼99% of the 1H, 13C, and 15N atoms of the protein backbone and for more than 90% of the side chains atoms. Backbone ϕ and ψ dihedral angle restraints were determined from the chemical shift values of the backbone atoms 13Cα, 13Cβ, 13C′, 1Hα, 1HN, and 15N using TALOS+ software.34, 35 Side chain dihedral angles χ1 were obtained by the AngleSearch program.36 Residual dipolar coupling constants were measured using a partially oriented diluted liquid crystalline media composed of ∼5% v/w C12E5/hexanol.37 The RDC values were calculated from the 1DNH and 1JNH constants, extracted from the IPAP-HSQC spectrum38 acquired under anisotropic conditions, and the J-modulated HSQC experiment,39 acquired under isotropic conditions, respectively.
Structure calculation and refinement
NOE distance restraints were determined from the [1H, 13C] NOESY and [1H, 15N] NOESY spectra measured at 298 K with a 100 ms mixing time. NOE peak volumes were calculated using the Sparky software.32 The structure calculations and refinement were made by a simulated annealing protocol carried out in Cartesian coordinate space using CNS.40 The restraint violations were monitored after each cycle of refinement by the NMRest program.24 2631 NOE-derived distance restraints, 316 dihedral angles, and 69 RDCs were used in the calculation of the final ensemble (see Supporting Information Table S1). The structure quality has been analyzed with the AQUA and Procheck-NMR software41 (Supporting Information Fig. S3). The best 20 structures out of 50 (with respect to the minimum restraints violation value criterion) were accepted as the final ensemble for each protein conformer. Structure visualization and analysis were carried out using the InsightII software package (Accelrys Software Inc.) and PyMol (DeLano Scientific LLC).
NMR dynamics analysis
R1, R2, and 1H–15N heteronuclear NOE data sets of 15N uniformly labeled N-eRF1 were collected at 298 K on a 600 MHz Varian Inova spectrometer. The analysis of the R1, R2, and 1H,15N-NOE values was carried out with a model-free formalism using the program RelaxFit written in-house.42 All the details of the NMR relaxation data analysis are presented in Supporting Information.
Databank accession numbers
The 1H, 15N, and 13C chemical shifts and the R1, R2, and 15N{1H} NOE values for protein backbone amides have been deposited in the BioMagResBank database (http://www.bmrb.wisc.edu) under the accession number BMRB-18092. The structural data and experimental restraints used in calculations have been submitted to the Protein Data Bank with the accession number 2LLX.
Acknowledgments
The NMR measurements were carried out at the MRC Biomedical NMR Centre, Mill Hill, London, and Center for Magnetic Tomography and Spectroscopy, Moscow State University. This research is supported by the Medical Research Council, UK.
Glossary
Abbreviations
- CBCA(CO)NH
3D experiment correlating the amide NH with the Cα and Cβ signals of the preceding amino acid
- C-eRF1 or C-domain
C-terminal domain (or domain 3) of class-1 polypeptide chain release factor
- eRF1
eukaryotic class-1 polypeptide chain release factor
- eRF3
eukaryotic class-2 polypeptide chain release factor 3
- HNCACB
3D experiment correlating the amide NH with the Cα and Cβ signals
- HNCO
3D experiment correlating the amide NH with the C′ signal of the preceding amino acid
- HSQC
heteronuclear single quantum coherence spectroscopy
- M-eRF1 or M-domain
eRF1 middle domain (or domain 2)
- N-eRF1 or N-domain
N-terminal domain (or domain 1) of class-1 polypeptide chain release factor
- NOE
nuclear Overhauser effect
- NOESY
nuclear Overhauser enhancement spectroscopy
- RDC
residual dipolar coupling
- R1
longitudinal or spin–lattice relaxation rate
- R2
transverse or spin–spin relaxation rate
- Rex
conformational exchange contribution to R2
- RF
release factor
- RMSD
root-mean-square deviation
- S2
order parameter reflecting the amplitude of ps–ns bond vector dynamics
Supplementary material
Additional Supporting Information may be found in the online version of this article.
References
- 1.Kisselev L, Ehrenberg M, Frolova L. Termination of translation: interplay of mRNA, rRNAs and release factors? EMBO J. 2003;22:175–182. doi: 10.1093/emboj/cdg017. [DOI] [PMC free article] [PubMed] [Google Scholar]
- 2.Klaholz BP. Molecular recognition and catalysis in translation termination complexes. Trends Biochem Sci. 2011;36:282–292. doi: 10.1016/j.tibs.2011.02.001. [DOI] [PubMed] [Google Scholar]
- 3.Laurberg M, Asahara H, Korostelev A, Zhu J, Trakhanov S, Noller HF. Structural basis for translation termination on the 70S ribosome. Nature. 2008;454:852–857. doi: 10.1038/nature07115. [DOI] [PubMed] [Google Scholar]
- 4.Weixlbaumer A, Jin H, Neubauer C, Voorhees RM, Petry S, Kelley AC, Ramakrishnan V. Insights into translational termination from the structure of RF2 bound to the ribosome. Science. 2008;322:953–956. doi: 10.1126/science.1164840. [DOI] [PMC free article] [PubMed] [Google Scholar]
- 5.Korostelev A, Asahara H, Lancaster L, Laurberg M, Hirschi A, Zhu J, Trakhanov S, Scott WG, Noller HF. Crystal structure of a translation termination complex formed with release factor RF2. Proc Natl Acad Sci U S A. 2008;105:19684–19689. doi: 10.1073/pnas.0810953105. [DOI] [PMC free article] [PubMed] [Google Scholar]
- 6.Ito K, Uno M, Nakamura Y. A tripeptide ‘anticodon’ deciphers stop codons in messenger RNA. Nature. 2000;403:680–684. doi: 10.1038/35001115. [DOI] [PubMed] [Google Scholar]
- 7.Kisselev LL, Buckingham RH. Translational termination comes of age. Trends Biochem Sci. 2000;25:561–566. doi: 10.1016/s0968-0004(00)01669-8. [DOI] [PubMed] [Google Scholar]
- 8.Song H, Mugnier P, Das AK, Webb HM, Evans DR, Tuite MF, Hemmings BA, Barford D. The crystal structure of human eukaryotic release factor eRF1–mechanism of stop codon recognition and peptidyl-tRNA hydrolysis. Cell. 2000;100:311–321. doi: 10.1016/s0092-8674(00)80667-4. [DOI] [PubMed] [Google Scholar]
- 9.Cheng Z, Saito K, Pisarev AV, Wada M, Pisareva VP, Pestova TV, Gajda M, Round A, Kong C, Lim M, Nakamura Y, Svergun DI, Ito K, Song H. Structural insights into eRF3 and stop codon recognition by eRF1. Genes Dev. 2009;23:1106–1118. doi: 10.1101/gad.1770109. [DOI] [PMC free article] [PubMed] [Google Scholar]
- 10.Frolova L, Seit-Nebi A, Kisselev L. Highly conserved NIKS tetrapeptide is functionally essential in eukaryotic translation termination factor eRF1. RNA. 2002;8:129–136. doi: 10.1017/s1355838202013262. [DOI] [PMC free article] [PubMed] [Google Scholar]
- 11.Inagaki Y, Doolittle WF. Class I release factors in ciliates with variant genetic codes. Nucleic Acids Res. 2001;29:921–927. doi: 10.1093/nar/29.4.921. [DOI] [PMC free article] [PubMed] [Google Scholar]
- 12.Lozupone CA, Knight RD, Landweber LF. The molecular basis of nuclear genetic code change in ciliates. Curr Biol. 2001;11:65–74. doi: 10.1016/s0960-9822(01)00028-8. [DOI] [PubMed] [Google Scholar]
- 13.Lekomtsev S, Kolosov P, Bidou L, Frolova L, Rousset JP, Kisselev L. Different modes of stop codon restriction by the Stylonychia and Paramecium eRF1 translation termination factors. Proc Natl Acad Sci U S A. 2007;104:10824–10829. doi: 10.1073/pnas.0703887104. [DOI] [PMC free article] [PubMed] [Google Scholar]
- 14.Eliseev B, Kryuchkova P, Alkalaeva E, Frolova L. A single amino acid change of translation termination factor eRF1 switches between bipotent and omnipotent stop-codon specificity. Nucleic Acids Res. 2011;39:599–608. doi: 10.1093/nar/gkq759. [DOI] [PMC free article] [PubMed] [Google Scholar]
- 15.Salas-Marco J, Fan-Minogue H, Kallmeyer AK, Klobutcher LA, Farabaugh PJ, Bedwell DM. Distinct paths to stop codon reassignment by the variant-code organisms Tetrahymena and Euplotes. Mol Cell Biol. 2006;26:438–447. doi: 10.1128/MCB.26.2.438-447.2006. [DOI] [PMC free article] [PubMed] [Google Scholar]
- 16.Ito K, Frolova L, Seit-Nebi A, Karamyshev A, Kisselev L, Nakamura Y. Omnipotent decoding potential resides in eukaryotic translation termination factor eRF1 of variant-code organisms and is modulated by the interactions of amino acid sequences within domain 1. Proc Natl Acad Sci U S A. 2002;99:8494–8499. doi: 10.1073/pnas.142690099. [DOI] [PMC free article] [PubMed] [Google Scholar]
- 17.Muramatsu T, Heckmann K, Kitanaka C, Kuchino Y. Molecular mechanism of stop codon recognition by eRF1: a wobble hypothesis for peptide anticodons. FEBS Lett. 2001;488:105–109. doi: 10.1016/s0014-5793(00)02391-7. [DOI] [PubMed] [Google Scholar]
- 18.Bertram G, Bell HA, Ritchie DW, Fullerton G, Stansfield I. Terminating eukaryote translation: domain 1 of release factor eRF1 functions in stop codon recognition. RNA. 2000;6:1236–1247. doi: 10.1017/s1355838200000777. [DOI] [PMC free article] [PubMed] [Google Scholar]
- 19.Inagaki Y, Blouin C, Doolittle WF, Roger AJ. Convergence and constraint in eukaryotic release factor 1 (eRF1) domain 1: the evolution of stop codon specificity. Nucleic Acids Res. 2002;30:532–544. doi: 10.1093/nar/30.2.532. [DOI] [PMC free article] [PubMed] [Google Scholar]
- 20.Bulygin KN, Khairulina YS, Kolosov PM, Ven'yaminova AG, Graifer DM, Vorobjev YN, Frolova LY, Kisselev LL, Karpova GG. Three distinct peptides from the N domain of translation termination factor eRF1 surround stop codon in the ribosome. RNA. 2010;16:1902–1914. doi: 10.1261/rna.2066910. [DOI] [PMC free article] [PubMed] [Google Scholar]
- 21.Chavatte L, Seit-Nebi A, Dubovaya V, Favre A. The invariant uridine of stop codons contacts the conserved NIKSR loop of human eRF1 in the ribosome. EMBO J. 2002;21:5302–5311. doi: 10.1093/emboj/cdf484. [DOI] [PMC free article] [PubMed] [Google Scholar]
- 22.Kolosov P, Frolova L, Seit-Nebi A, Dubovaya V, Kononenko A, Oparina N, Justesen J, Efimov A, Kisselev L. Invariant amino acids essential for decoding function of polypeptide release factor eRF1. Nucleic Acids Res. 2005;33:6418–6425. doi: 10.1093/nar/gki927. [DOI] [PMC free article] [PubMed] [Google Scholar]
- 23.Seit-Nebi A, Frolova L, Kisselev L. Conversion of omnipotent translation termination factor eRF1 into ciliate-like UGA-only unipotent eRF1. EMBO Rep. 2002;3:881–886. doi: 10.1093/embo-reports/kvf178. [DOI] [PMC free article] [PubMed] [Google Scholar]
- 24.Ivanova EV, Kolosov PM, Birdsall B, Kelly G, Pastore A, Kisselev LL, Polshakov VI. Eukaryotic class 1 translation termination factor eRF1 – the NMR structure and dynamics of the middle domain involved in triggering ribosome-dependent peptidyl-tRNA hydrolysis. FEBS J. 2007;274:4223–4237. doi: 10.1111/j.1742-4658.2007.05949.x. [DOI] [PubMed] [Google Scholar]
- 25.Mantsyzov AB, Ivanova EV, Birdsall B, Alkalaeva EZ, Kryuchkova PN, Kelly G, Frolova LY, Polshakov VI. NMR solution structure and function of the C-terminal domain of eukaryotic class 1 polypeptide chain release factor. FEBS J. 2010;277:2611–2627. doi: 10.1111/j.1742-4658.2010.07672.x. [DOI] [PMC free article] [PubMed] [Google Scholar]
- 26.Oda Y, Muramatsu T, Yumoto F, Ito M, Tanokura M. Backbone 1H, 13C and 15N resonance assignment of the N-terminal domain of human eRF1. J Biomol NMR. 2004;30:109–110. doi: 10.1023/B:JNMR.0000042944.14441.d6. [DOI] [PubMed] [Google Scholar]
- 27.Polshakov VI, Morgan WD, Birdsall B, Feeney J. Validation of a new restraint docking method for solution structure determinations of protein-ligand complexes. J Biomol NMR. 1999;14:115–122. doi: 10.1023/a:1008379225053. [DOI] [PubMed] [Google Scholar]
- 28.Bulygin KN, Khairulina YS, Kolosov PM, Ven'yaminova AG, Graifer DM, Vorobjev YN, Frolova LY, Karpova GG. Adenine and guanine recognition of stop codon is mediated by different N domain conformations of translation termination factor eRF1. Nucleic Acids Res. 2011;39:7134–7146. doi: 10.1093/nar/gkr376. [DOI] [PMC free article] [PubMed] [Google Scholar]
- 29.Wang Y, Chai B, Wang W, Liang A. Functional characterization of polypeptide release factor 1b in the ciliate Euplotes. Biosci Rep. 2010;30:425–431. doi: 10.1042/BSR20090154. [DOI] [PubMed] [Google Scholar]
- 30.Chavatte L, Frolova L, Laugaa P, Kisselev L, Favre A. Stop codons and UGG promote efficient binding of the polypeptide release factor eRF1 to the ribosomal A site. J Mol Biol. 2003;331:745–758. doi: 10.1016/s0022-2836(03)00813-1. [DOI] [PubMed] [Google Scholar]
- 31.Delaglio F, Grzesiek S, Vuister GW, Zhu G, Pfeifer J, Bax A. NMRPipe: a multidimensional spectral processing system based on UNIX pipes. J Biomol NMR. 1995;6:277–293. doi: 10.1007/BF00197809. [DOI] [PubMed] [Google Scholar]
- 32.Goddard TD, Kneller DG. http://www.cgl.ucsf.edu/home/sparky.
- 33.Bax A, Grzesiek S. Methodological advances in protein NMR. Acc Chem Res. 1993;26:131–138. [Google Scholar]
- 34.Cornilescu G, Delaglio F, Bax A. Protein backbone angle restraints from searching a database for chemical shift and sequence homology. J Biomol NMR. 1999;13:289–302. doi: 10.1023/a:1008392405740. [DOI] [PubMed] [Google Scholar]
- 35.Shen Y, Delaglio F, Cornilescu G, Bax A. TALOS plus : a hybrid method for predicting protein backbone torsion angles from NMR chemical shifts. J Biomol NMR. 2009;44:213–223. doi: 10.1007/s10858-009-9333-z. [DOI] [PMC free article] [PubMed] [Google Scholar]
- 36.Polshakov VI, Frenkiel TA, Birdsall B, Soteriou A, Feeney J. Determination of stereospecific assignments, torsion-angle constraints, and rotamer populations in proteins using the program AngleSearch. J Magn Reson B. 1995;108:31–43. doi: 10.1006/jmrb.1995.1099. [DOI] [PubMed] [Google Scholar]
- 37.Ruckert M, Otting G. Alignment of biological macromolecules in novel nonionic liquid crystalline media for NMR experiments. J Am Chem Soc. 2000;122:7793–7797. [Google Scholar]
- 38.Ottiger M, Delaglio F, Bax A. Measurement of J and dipolar couplings from simplified two-dimensional NMR spectra. J Magn Reson. 1998;131:373–378. doi: 10.1006/jmre.1998.1361. [DOI] [PubMed] [Google Scholar]
- 39.Tjandra N, Grzesiek S, Bax A. Magnetic field dependence of nitrogen-proton J splittings in N-15-enriched human ubiquitin resulting from relaxation interference and residual dipolar coupling. J Am Chem Soc. 1996;118:6264–6272. [Google Scholar]
- 40.Brunger AT, Adams PD, Clore GM, DeLano WL, Gros P, Grosse-Kunstleve RW, Jiang JS, Kuszewski J, Nilges M, Pannu NS, Read RJ, Rice LM, Simonson T, Warren GL. Crystallography & NMR system: a new software suite for macromolecular structure determination. Acta Crystallogr D Biol Crystallogr. 1998;54:905–921. doi: 10.1107/s0907444998003254. [DOI] [PubMed] [Google Scholar]
- 41.Laskowski RA, Rullmannn JA, MacArthur MW, Kaptein R, Thornton JM. AQUA and PROCHECK-NMR: programs for checking the quality of protein structures solved by NMR. J Biomol NMR. 1996;8:477–486. doi: 10.1007/BF00228148. [DOI] [PubMed] [Google Scholar]
- 42.Polshakov VI, Birdsall B, Frenkiel TA, Gargaro AR, Feeney J. Structure and dynamics in solution of the complex of Lactobacillus casei dihydrofolate reductase with the new lipophilic antifolate drug trimetrexate. Protein Sci. 1999;8:467–481. doi: 10.1110/ps.8.3.467. [DOI] [PMC free article] [PubMed] [Google Scholar]
Associated Data
This section collects any data citations, data availability statements, or supplementary materials included in this article.