

Abstract
Insulin-like growth factor binding proteins (IGFBPs) are associated with insulin resistance and accelerated micro- and macro-vascular complications of diabetes. We investigated the relationship between serum levels of IGFBP6 in type-1 diabetes (T1D) patients and diabetic complications. In this study, IGFBP6 was measured in the sera from 697 T1D patients and 681 healthy controls using a Luminex assay. Mean serum levels of IGFBP6 were higher in T1D patients than controls matched for sex and age (119.7 vs 130.6 ng/ml, p < 10-4). Subject age, sex and duration of disease have a significant impact on serum IGFBP6 levels in both T1D patients and healthy controls. Patients with complications have significantly higher mean serum IGFBP6 than patients without any complication (p = 3.5x10⁻⁶). More importantly, conditional logistic regression analysis suggested that T1D patients are more likely to have very high levels of serum IGFBP6 (in the 4th quartile) (OR = 1.7) than healthy controls. Furthermore, T1D patients with various complications are more likely to have very high levels of serum IGFBP6 (in the 4th quartile) than patients without any complication (OR = 1.7 - 22.9). These results indicate the clinical importance of measuring IGFBP6 to the better management of T1D patients.
Keywords: Insulin-like growth factor binding proteins (IGFBPs), insulin resistance, diabetes, complications
Introduction
Insulin and Insulin-like growth factors (IGFs) are central hormones in regulating metabolism, glucose uptake, glycogen synthesis, lipogenesis and prevention of proteolysis [1]. The IGF axis is a complex system composed of two mitogenic ligands, IGF-I and IGF-II, two receptors, IGF-IR and IGF-IIR and binding proteins [2]. Insulin-like growth factors, IGF-I and IGF-II are single chain peptides with significant homology to insulin. IGF-II has been implicated in mitosis, growth, and organ development by paracrine and endocrine pathways in cell culture studies and animal models [3,4]. IGF-II also has insulin-like metabolic effects and overproduction of IGF-II in certain pancreatic and non-pancreatic cancers has been linked to severe refractory hypoglycemia [5,6]. The actions of IGFs may be mediated through binding to the IGF-I/II receptor (a homologue of insulin receptor) and/or to the insulin receptor itself [1,7].
The bioavailability of the IGFs to its receptors is controlled by IGF binding proteins (IGFBPs), which represent an important link between the insulin and IGF system. IGFBPs belong to a superfamily of 15 homologous proteins, present in serum, other biological fluids and tissue extracts [4]. Although IGFBPs are globally distributed in all tissues and cells, the majority of circulating levels of IGFBPs are produced by liver under regulation of IGFs and insulin [8]. IGFBP3 is the most abundant protein of the family followed by IGFBP2 and IGFBP1. IGFBP4 and IGFBP5 represent a smaller portion of the IGFBP family in the circulation [8]. IGFBP6 is the sixth member of the IGFBP family and has a preference towards binding to IGF-II in a specific manner than IGFBP1 [9]. Four of the IGFBPs, (IGFBP1, IGFBP2, IGFBP3 and IGFBP5) have been implicated in T1D, prevention of obesity and induction of insulin resistance in both animal models and human subjects [10-13]. These IGFBPs are identified as surrogate markers for metabolic syndrome, cardiovascular disease and cancers in several studies. IGFBPs are also known to be involved in augmentation of micro- and macro- vascular complications of diabetes [3,7,10-15].
No data has been reported on IGFBP6 in T1D, an autoimmune disease characterized by lymphocyte infiltration into the pancreatic islets and destruction of the insulin-producing islet β-cells in children and young adults. This study with 697 T1D patients and 681 controls was designed to identify differences in systemic levels of IGFBP6 in T1D subjects and in T1D subjects with complications.
Methods
Serum samples
This study was approved by the Georgia Health Sciences University Institutional Review Board. Blood samples were collected from participants of Prospective Assessment in Newborns of Diabetes Autoimmunity (PANDA) [16] study, after informed consent. The blood was allowed to clot at room temperature for 30 minutes and then centrifuged at 2000xg for 10 minutes in serum separator tubes. Serum was harvested, aliquoted and stored at -80°C for future use. All subjects were recruited in Georgia, USA, mainly in the Atlanta and Augusta areas.
Serum samples from 697 T1D patients and 681 healthy controls were aliquoted randomly into wells of 96 well v-bottom plates and each plate contained similar numbers of samples from T1D patients and controls. From blood collection to the assay, none of the samples had more than three freeze/thaw cycles and each sample usually had only one freeze/thaw cycle.
Luminex assay for IGFBP6
IGFBP6 in serum was measured using a Luminex bead array kit from Millipore (Millipore Inc, Billerica MA, USA) according to manufacturer’s protocol. The kit is based on sandwich immuno-assay, which consists of dyed microspheres conjugated with a specific monoclonal capture antibody. Briefly serum samples were incubated with the antibody-coupled microspheres, and later on with biotinylated detection antibody before the addition of streptavidinphycoerythrin. The captured bead-complexes were then read by a FLEXMAP3D (Luminex, TX, USA) with the following instrument settings: events/bead: 50, minimum events: 0, Flow rate: 60ul/min, Sample size: 50ul, discriminator gate: 8000-13500.
Statistical analysis
Median fluorescence intensities were converted to concentrations using a 4-parameter logistic regression fit to the standard curve with known concentration included on each plate using a serial dilution series, as previously described [17]. All further statistical analyses were performed using log2 transformed concentrations to achieve more normal distributions. Linear regression analysis was used to determine the effect of age, sex and duration of disease on IGFBP6 levels. Since there was a significant effect of age and sex on the IGFBP6 levels, case-control matching was performed with respect to age, and sex using the “matching” R package [18]. Potential differences between T1D patients, healthy controls and subsets based on gender and specific complications were initially examined using a paired t-test. To estimate the relative risk of diabetes at different protein concentrations, we performed conditional logistic regression on matched paired data. The odds ratios (OR) and 95% confidence intervals (CI) were computed. To investigate the association between serum IGFBP6 levels and the diabetic complications, the samples from the T1D patients with a particular complication were compared with the samples from the T1D patients without complications. Matching was performed with respect to age, sex, and duration of diabetes. Conditional logistic regression was performed to estimate the relative risk of a particular complication at different protein concentrations. IGFBP6 protein levels were used as continuous as well as discrete variable (after dividing into 4 quartiles). All statistical analyses were performed using the R language and environment for statistical computing (R version 2.12.1; R Foundation for Statistical Computing; www.rproject.org) [19].
Results
Serum IGFBP6 levels were measured using a Luminex assay for 697 T1D patients and 681 control subjects. The sex and age distributions of the samples before and after matching are presented in Table 1. Regression analyses using IGFBP6 as dependent variable and age as a covariate suggested that IGFBP6 levels were significantly associated with age in both controls (r=0.22, p<10-9, Figure 1A) and patients (r = 0.37, p<10-16, Figure 1E). Further regression analyses after stratification on gender and disease status revealed that age effect on IGFBP6 levels differ slightly according to the sex of the subjects in both the controls (r=0.143 for females and r=0.359 for males, Figure 1A-1D) and T1D patients (r=0.37 for female and r=0.399 for males, Figure 1E-1H). A similar analysis was performed to determine correlation between IGFBP6 levels and duration of diabetes in T1D patients. We found that IGFBP6 levels were significantly correlated with duration of diabetes in both females (r=0.35, p<10-12, Figure 2B) and males (r=0.35, p<10-11, Figure 2C). We did not observe sex-specific differences in the correlation of IGFBP6 levels with duration of diabetes (Figure 2D). Since IGFBP6 levels were significantly associated with age and sex of the study subjects, we matched controls and patients for these two variables to create casecontrol matched dataset for further analyses.
Table 1.
Mean values of age, sex, and T1D duration in cases and controls before and after multivariate matching.
| Group | Before Matching | After Matching | |||
|---|---|---|---|---|---|
|
| |||||
| Controls | Cases | Controls | Cases | ||
| T1D | Age (years) | 22.98 | 29.15 | 28.06 | 29.15 |
| Sex (Female %) | 53.3% | 53.2% | 53.2% | 53.2% | |
| Nephropathy | Age (years) | 22.23 | 49.84 | 49.38 | 49.84 |
| Sex (Female %) | 53.4% | 52.8% | 52.8% | 52.8% | |
| T1D Duration | 9.26 | 31.11 | 29.22 | 31.11 | |
| Photocoagulation | Age (years) | 22.23 | 50.95 | 50.54 | 50.95 |
| Sex (Female %) | 53.4% | 49.1% | 49.1% | 49.1% | |
| T1D Duration | 9.26 | 34.63 | 33.94 | 34.63 | |
| Retinopathy | Age (years) | 22.23 | 51.46 | 50.84 | 51.46 |
| Sex (Female %) | 53.4% | 57.5% | 57.5% | 57.5% | |
| T1D Duration | 9.26 | 32.47 | 31.50 | 32.47 | |
| HTN | Age (years) | 22.23 | 51.41 | 51.15 | 51.41 |
| Sex (Female %) | 53.4% | 52.1% | 52.1% | 52.1% | |
| T1D Duration | 9.26 | 26.94 | 26.18 | 26.94 | |
| Blindness | Age (years) | 22.23 | 48.61 | 50.20 | 48.61 |
| Sex (Female %) | 53.4% | 53.3% | 53.3% | 53.3% | |
| T1D Duration | 9.26 | 33.46 | 32.05 | 33.46 | |
| Foot Ulcer | Age (years) | 22.23 | 52.61 | 51.63 | 52.61 |
| Sex (Female %) | 53.4% | 60.0% | 60.0% | 60.0% | |
| T1D Duration | 9.26 | 37.86 | 34.28 | 37.86 | |
| CAD | Age (years) | 22.23 | 58.22 | 56.87 | 58.22 |
| Sex (Female %) | 53.4% | 48.6% | 48.6% | 48.6% | |
| T1D Duration | 9.26 | 30.68 | 28.95 | 30.68 | |
| Amputation | Age (years) | 22.23 | 51.97 | 52.52 | 51.97 |
| Sex (Female %) | 53.4% | 50.0% | 50.0% | 50.0% | |
| T1D Duration | 9.26 | 30.85 | 31.34 | 30.85 | |
| Neuropathy | Age (years) | 22.23 | 54.96 | 53.82 | 54.96 |
| Sex (Female %) | 0.53 | 0.57 | 0.57 | 0.57 | |
| T1D Duration | 9.26 | 28.24 | 26.87 | 28.24 | |
| Dyslipidemia | Age (years) | 22.23 | 47.56 | 47.66 | 47.56 |
| Sex (Female %) | 53.4% | 55.4% | 55.4% | 55.4% | |
| T1D Duration | 9.26 | 22.81 | 22.31 | 22.81 | |
For T1D group, cases are T1D patients, controls are AbN controls, matching was performed with respect to age, and sex. For Complications, cases are the T1D patients with a particular complication, controls are T1D patients without any complications. Matching was performed with respect to age, sex and T1D duration.
Figure 1.

Regression graphs showing the correlation between serum IGFBP6 levels and age of subjects. Relative levels of IGFBP6 as a function of age in the total control group (a, β=0.013, p=3x10⁻⁹), female controls (b, β=0.009, p=0.006), male controls (c, β=0.02, p= 6.6x10⁻¹¹), and regression lines for control males and females on same plot (d). Relative levels of IGFBP6 as a function of age in the total T1D group (e, β=0.018, p=1x10-16), female T1D (f, β=0.016, p=1x10-13), male T1D (g, β=0.021, p= 8.3x10⁻¹⁴), and regression lines for T1D males and females on same plot (h).
Figure 2.

Regression plots of IGFBP6 levels with the duration of disease for all T1D patients (a; β=0.023, p=1x10-16), female T1D (b, β=0.024, p=3.1x10⁻¹²), male T1D (c, β=0.023, p=1x10-11), and regression lines for both genders on same plot (d).
The mean IGFBP6 levels were slightly but significantly higher in the T1D group (mean = 130.7 ng/ml) compared with the control group (mean = 119.7 ng/ml) (p < 10-5, Figure 3A). When data was stratified by sex, the differences between T1D and control subjects were significant in both male (T1D mean 142.5 vs control mean 128.54 ng/ml, p < 0.05) and female (T1D mean 120.8 vs control mean 112.6 ng/ml, p < 0.05) (Figure 3B). We also observed sex-specific differences in serum levels of IGBP6 in both controls (males=128.5 ng/ml and females= 112.6ng/ml, Figure 3B) and T1D patients (males= 142.5 ng/ml and females=120.9 ng/ ml, Figure 3B). Interestingly, 4.1% (27/657) of patients with T1D had very high IGFBP6 levels (defined as above the 99th percentile value in controls, 321.2 ng/ml) compared to 1% (7/670) of the controls (odds ratio = 3.99, p < 10-4) (Figure 3B).
Figure 3.
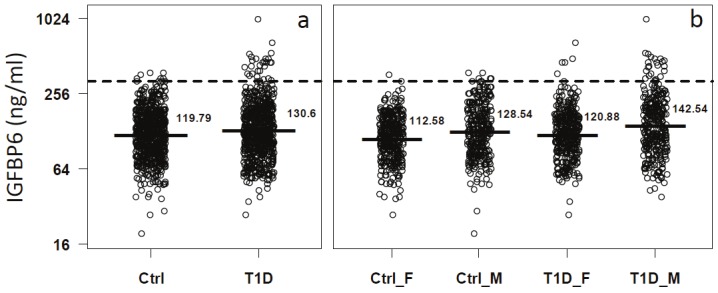
The distribution of serum IGFBP6 levels in T1D and control groups after matching for sex and age. Dash lines mark the 95th percentile value in T1D patients. Solid lines and values on the right side represent the mean values of serum IGFBP6 in the respective groups. IGFBP6 serum levels in total T1D and control subjects (a). After separating both T1D and control groups into female and male subjects (b).
Next we examined the association between IGFBP6 concentrations and diabetes risk using conditional logistic regression. Odds ratio (OR) of diabetes per SD increment of protein levels were computed. First, we treated the serum levels of IGFBP6 as continuous variable and performed regression with disease as a categorical variable. We observed a significant association of IGFBP6 concentration with increased risk of T1D (OR =1.26, p<0.01, Table 2). To assess the relative risk of diabetes across different quartiles of IGFBP6 concentrations, we used the serum levels of IGBP6 from controls at the 25th, 50th and 75th percentile as cutoff values to categorize T1D subjects into four quartiles. There are significantly more T1D subjects in the top quartile than in the 1st quartile (OR=1.69, Table 2).
Table 2.
Relative risk (odds ratios) of T1D and its complications with increase in IGFBP6 levels.
| Groups+ | N | OR | pval | OR2_Q2 | OR3_Q3 | OR4_Q4 | p-trend |
|---|---|---|---|---|---|---|---|
| T1D | 696 | 1.26 (1.1-1.44) | 0.0008 | 1.35 (0.97-1.89) | 0.94 (0.64-1.37) | 1.69 (1.18-2.43) | 0.06 |
| Nephropathy | 36 | 4.03 (1.67 -9.70) | 0.002 | 0.67 (0.13-3.42) | 2.13 (0.52-8.68) | 22.91 (2.44-215.1) | 0.06 |
| Photocoagulation | 55 | 1.94 (1.10 - 3.41) | 0.021 | 0.63 (0.19-2.01) | 1.54 (0.49-4.85) | 3.64 (1.13-11.68) | 0.32 |
| Retinopathy | 73 | 1.66 (1.02-2.70) | 0.042 | 0.84 (0.33-2.11) | 1.76 (0.70-4.42) | 2.32 (0.8 -6.07) | 0.35 |
| Blindness | 15 | 6.93 (0.79-60.74) | 0.081 | ND | ND | ND | ND |
| Foot Ulcer | 10 | 4.32 (0.61-30.78) | 0.144 | ND | ND | ND | ND |
| CAD | 35 | 1.51 (0.75-3.05) | 0.253 | 1.65 (0.52-5.2) | 0.88 (0.25-3.18) | 2.07 (0.51-8.35) | 0.43 |
| HTN | 96 | 1.43 (0.98-2.08) | 0.061 | 1.72 (0.86-3.44) | 2.54 (1.23-5.25) | 1.70 (0.81-3.58) | 0.03 |
| Amputation | 8 | 1.98 (0.41-9.48) | 0.392 | ND | ND | ND | ND |
| Peripheral Neuropathy | 65 | 1.21 (0.72-2.06) | 0.469 | 0.54 (0.21-1.38) | 1.51 (0.59-3.92) | 1.58 (0.58-4.32) | 0.84 |
| N | 112 | 0.96 (0.71-1.30) | 0.812 | 0.8 (0.4 -1.44) | 0.57 (0.31-1.06) | 0.72 (0.37-1.38) | 0.16 |
T1D was compared to controls.
Each category of complications was compared to T1D without any complications. OR: Odds ratio. Values presented are OR and its 95% confidence interval. Q2, Q3 and Q4: 2nd, 3rd and 4th quartiles were compared to 1st quartile (reference). HTN: Hypertension, CAD: Coronary Artery Disease. ND: not done due to low sample size.
We also examined the association of IGFBP6 levels with different diabetic complications in T1D patients. For each complication, a matched pair dataset was created to alleviate the effect of age, sex and duration of disease. Each T1D patient with complication was matched to a T1D patient without any complication to create age, sex, and duration of diabetes matched pairs. The boxplots depicting distribution of IGFBP6 levels in patients with different complications are shown in Figure 4. The mean levels of serum IGFBP6 were significantly increased (p<0.05) in T1D patients with nephropathy (n=36), photocoagulation (n=55), retinopathy (n=73), and blindness (n=15) compared to T1D patients without any complication (Table 3). Conditional regression analysis further revealed a significantly increased risk of nephropathy (OR=4.03, p<0.01), photocoagulation (OR=1.94, p<0.05) and retinopathy (OR=1.66, p<0.05) with per SD increase in IGFBP6 concentrations (Table 2). T1D patients with serum levels of IGFBP6 in 4th quartile had a very high risk of developing nephropathy (OR=22.91), followed by T1D subjects who underwent photocoagulation to stall the diabetic retinopathy (OR=3.64) andretinopathy (OR=2.32) as compared to the 1st quartile (Table 2).
Figure 4.

Boxplots showing serum IGFBP6 differences between T1D without any complications (NoC) and T1D with complications (Comp).
Table 3.
Serum IGFBP6 levels in T1D patients with and without diabetic complications.
| Complication | N | No Comp | Comp | FC* | p-value |
|---|---|---|---|---|---|
| Nephropathy | 36 | 161.1 | 244.4 | 1.52 | 0.00014 |
| Photocoagulation | 55 | 174.9 | 225.6 | 1.27 | 0.01203 |
| Blindness | 15 | 174.9 | 257.3 | 1.47 | 0.02251 |
| Retinopathy | 73 | 174.7 | 203.2 | 1.16 | 0.03315 |
| HTN | 96 | 158.8 | 176.7 | 1.11 | 0.07622 |
| Foot Ulcer | 10 | 160.2 | 227.3 | 1.42 | 0.09269 |
| CAD | 35 | 151.5 | 183.2 | 1.21 | 0.16613 |
| Amputation | 8 | 220.6 | 261.8 | 1.19 | 0.52837 |
| Peripheral Neuropathy | 65 | 173.7 | 180.1 | 1.04 | 0.69107 |
| Dyslipidemia | 112 | 147.1 | 144.9 | 0.99 | 0.77589 |
FC: Fold Change was calculated for each specific category of T1D with complication (Comp) over the T1D patients without any complication (No Comp).
HTN: Hypertension, CAD: Coronary Artery Disease.
Discussion
The results presented here suggest that males in both controls and T1D group had higher levels of IGFBP6 as reported earlier [20]. Furthermore, T1D is associated with increase in serum levels of IGFBP6 similar to the observations previously reported for IGFBP1, 2, 3 and 5 [8,10,13,21]. Several IGFBPs have been measured in T1D patients with or without diabetic complications as well as controls in several previous studies [10,13,21]. These studies have established the role of these IGFBPs as regulators of obesity, insulin resistance, bone mineral density and complications such as retinopathy and nephropathy in T1D and T2D [22]. This study demonstrates for the first time the relationship between T1D and serum levels of IGFBP6, previously demonstrated for other IGFBPs in T1D and pathophysiology of insulin-mediated metabolic dysfunction [10,12,13]. We measured serum IGFP6 levels in 697 T1D patients in different age groups and with/without diabetic complications. This large dataset allowed us to examine the various parameters that may influence serum IGFBP6 levels in T1D patients. Our results suggested that serum IGFBP6 levels differ by sex and increase with age as reported previously for other IGFBPs [23]. We also observed a positive association between duration of T1D and IGFBP6 levels in T1D patients, the slopes of the regression lines suggested that serum levels of IGBP6 were associated with the disease duration for both genders.
Serum levels of IGFBP6 are elevated in diabetic patients. Elevation in serum levels is more prominent in males than females as observed in another disease [23]. These results are in complete agreement regarding serum levels of IGFBP1 levels reported in T1D [22]. The elevation in serum levels of IFBP6 observed in this study may be explained by two ways. Firstly, glucose is reported to be the primary modulator of IGF-II production in pancreatic β-cells [2] and uncontrolled hyperglycemia is known to cause elevation in IGF-II levels in T1D/T2D [21] and in cellular models. Furthermore, IGFs also stimulate hepatic and extra-hepatic production of IGFBPs in liver and regionally in tissues, suggesting that the increase observed in this study may be mediated by IGF-II arising due to hyperglycemia. It has been known that metabolic conditions with decreased insulin levels such as fasting, diabetes and exercise cause increase in systemic levels of IGFBP and insulin is one of the suppressors of IGFBP production in liver [24]. In fact, patients with T1D have reduced levels of IGF in their serum and elevated levels of IGFBP1, especially in subjects with poor glycemic control or micro-vascular complications [11].
Evidence are now emerging that dysregulation of the IGF system is involved in the development of complications of diabetes such as retinopathy, neuropathy, cardiovascular diseases and nephropathy [7,10,11,14,21,22]. IGFs, especially IGF-II have strong anti-apoptotic properties and are involved in proliferation of endothelial cells and several cancer cells lines. It has been argued that regional concentrations of IGFs may be more significant than systemic levels in the pathogenesis of diabetic complications [15]. IGFs, especially IGF-II, are known to exert its anti-apoptotic responses by binding to insulin receptor (IR) in many tissues. The cytoprotective effects of IGF-II are related to mitochondrial protection leading to increase in ATP production and reduction in free radical generation, oxidative damage and apoptosis [25,26]. On the other hand, increased expression of IGF-II has been reported to be one of the contributors of diabetic nephropathy via excessive deposition of extra-cellular matrix components in the glomerular basement membrane [21]. In this study, we found that the mean serum IGFBP6 levels are elevated in T1D patients with diabetic complications including nephropathy, blindness, retinopathy, photocoagulation and coronary artery disease (CAD), suggesting an elevated suppression of IGF actions in these tissues/vascular compartments. Major function of IGFBP6 is to inhibit anti-apoptotic actions of IGF-II [8]. The reduction in IGF-II levels via excessive binding to IGFBP6 suggests an enhancement of apoptosis in the selected organs.
Cell proliferation and differentiation is an important step in wound healing. IGF-II, due to its cell proliferative property, has been implicated in wound healing and/or tissue regeneration [27,28]. Our results on elevated IGFBP6 levels in diabetic foot ulcer suggest that excessive IGFBP6 reduces the bio-availability of IGF-II required for healing at the site of tissue damage. This loss of wound healing may lead to excessive foot ulcers and amputation in T1D individuals.
In summary, we have demonstrated striking relationships between IGFBP6 concentrations and several important components of the insulin deficiency in T1D patients. Although the cross-sectional nature of the study cannot distinguish the underlying cause from effect, the logistic regression data suggests that T1D patients with higher IGFBP6 are at an increased risk of developing complications of kidney, eyes and vascular system. Since IGFBP6 is a modulator of IGF-II action, we infer that IGF-II is abnormally regulated in T1D both systemically and regionally at the tissue levels.
Acknowledgments
This work was supported by grants from the National Institutes of Health (4R33HD050196, 4R33-DK069878 and 2RO1HD37800) and JDRF (1-2004-661) to JXS. Sharad Purohit was supported by a JDRF senior postdoctoral fellowship and career development award from JDRF (10-2006-792 and 2-2011-153). Wenbo Zhi was supported by a postdoctoral fellowship from JDRF (3-2009-275). JXS is an eminent scholar supported by the Georgia Research Alliance. We thank a number of physicians (Bruce Bode, Stephen Anderson, John Chip Reed, R Dennis Steed, Andy Muir, David Brown, N Spencer Welch, Paul Davidson, Joseph Johnson, David Robertson, Constance Baldwin, Melissa Carlucci, Mark Rappaport, Robert Schultz, Vijayasudha Gunna) and staff members (Diane Hopkins, Leigh Steed, Kim English, Katherine Guthrie, Deana McFeely, JoAnn Higdon, Debbie Ellison, Tami Kinnersley and Ann Simmonds) for their contribution in sample collection. We are very grateful to all patients and other volunteers who participated in this study.
References
- 1.Firth SM, Baxter RC. Cellular actions of the insulin-like growth factor binding proteins. Endocr Rev. 2002;23:824–854. doi: 10.1210/er.2001-0033. [DOI] [PubMed] [Google Scholar]
- 2.Le Roith D. The insulin-like growth factor system. Exp Diabesity Res. 2003;4:205–212. doi: 10.1155/EDR.2003.205. [DOI] [PMC free article] [PubMed] [Google Scholar]
- 3.Smith TJ. Insulin-like growth factor-I regulation of immune function: a potential therapeutic target in autoimmune diseases? Pharmacol Rev. 2010;62:199–236. doi: 10.1124/pr.109.002469. [DOI] [PMC free article] [PubMed] [Google Scholar]
- 4.Hwa V, Oh Y, Rosenfeld RG. The insulin-like growth factor-binding protein (IGFBP) superfamily. Endocr Rev. 1999;20:761–787. doi: 10.1210/edrv.20.6.0382. [DOI] [PubMed] [Google Scholar]
- 5.Korevaar TIM, Ragazzoni F, Weaver A, Karavitaki N, Grossman AB. IGF2-induced hypoglycemia unresponsive to everolimus. QJM: Int J Med. 2012 doi: 10.1093/qjmed/hcr249. doi:10.1093/qjmed/hcr249. [DOI] [PubMed] [Google Scholar]
- 6.Barra WF, Castro G, Hoff AO, Siqueira SA, Hoff PM. Symptomatic hypoglycemia related to inappropriately high igf-ii serum levels in a patient with desmoplastic small round cell tumor. Case Report Med. 2010;2010:684045. doi: 10.1155/2010/684045. [DOI] [PMC free article] [PubMed] [Google Scholar]
- 7.Sima AA, Li ZG, Zhang W. The insulin-like growth factor system and neurological complications in diabetes. Exp Diabesity Res. 2003;4:235–256. doi: 10.1155/EDR.2003.235. [DOI] [PMC free article] [PubMed] [Google Scholar]
- 8.Rajaram S, Baylink DJ, Mohan S. Insulin-like growth factor-binding proteins in serum and other biological fluids: regulation and functions. Endocr Rev. 1997;18:801–831. doi: 10.1210/edrv.18.6.0321. [DOI] [PubMed] [Google Scholar]
- 9.Bach LA, Hsieh S, Sakano K, Fujiwara H, Perdue JF, Rechler MM. Binding of mutants of human insulin-like growth factor II to insulin-like growth factor binding proteins 1-6. J Biol Chem. 1993;268:9246–9254. [PubMed] [Google Scholar]
- 10.Mohamed-Ali V, Pinkney JH, Panahloo A, Cwyfan-Hughes S, Holly JM, Yudkin JS. Insulin-like growth factor binding protein-1 in NIDDM: relationship with the insulin resistance syndrome. Clin Endocrinol (Oxf) 1999;50:221–228. doi: 10.1046/j.1365-2265.1999.00647.x. [DOI] [PubMed] [Google Scholar]
- 11.Feldmann B, Jehle PM, Mohan S, Lang GE, Lang GK, Brueckel J, Boehm BO. Diabetic retinopathy is associated with decreased serum levels of free IGF-I and changes of IGF-binding proteins. Growth Horm IGF Res. 2000;10:53–59. doi: 10.1054/ghir.2000.0140. [DOI] [PubMed] [Google Scholar]
- 12.Ruan W, Lai M. Insulin-like growth factor binding protein: a possible marker for the metabolic syndrome? Acta Diabetol. 2010;47:5–14. doi: 10.1007/s00592-009-0142-3. [DOI] [PubMed] [Google Scholar]
- 13.Wheatcroft SB, Kearney MT. IGF-dependent and IGF-independent actions of IGF-binding protein-1 and -2: implications for metabolic homeostasis. Trends Endocrinol Metab. 2009;20:153–162. doi: 10.1016/j.tem.2009.01.002. [DOI] [PubMed] [Google Scholar]
- 14.Bayes-Genis A, Conover CA, Schwartz RS. The insulin-like growth factor axis: A review of atherosclerosis and restenosis. Circ Res. 2000;86:125–130. doi: 10.1161/01.res.86.2.125. [DOI] [PubMed] [Google Scholar]
- 15.Livingstone C, Ferns GA. Insulin-like growth factor-related proteins and diabetic complications. Br J Diabetes Vasc Dis. 2003;3:326–331. [Google Scholar]
- 16.Carmichael SK, Johnson SB, Baughcum A, North K, Hopkins D, Dukes MG, She JX, Schatz DA. Prospective assessment in newborns of diabetes autoimmunity (PANDA): maternal understanding of infant diabetes risk. Genet Med. 2003;5:77–83. doi: 10.1097/01.GIM.0000055196.67008.1B. [DOI] [PubMed] [Google Scholar]
- 17.Zhi W, Sharma A, Purohit S, Miller E, Bode B, Anderson SW, Reed JC, Steed RD, Steed L, Hopkins D, She JX. Discovery and validation of serum protein changes in type 1 diabetes patients using high throughput two dimensional liquid chromatography-mass spectrometry and immunoassays. Mol Cell Proteomics. 2011;10:M111.012203. doi: 10.1074/mcp.M111.012203. [DOI] [PMC free article] [PubMed] [Google Scholar]
- 18.Sekhon JS, Grieve RD. A matching method for improving covariate balance in cost-effectiveness analyses. Health Econ. 2012;21:695–714. doi: 10.1002/hec.1748. [DOI] [PubMed] [Google Scholar]
- 19.R Development Core Team. R: A language and environment for statistical computing. 2010. 3-900051-07-0. [Google Scholar]
- 20.Yu H, Mistry J, Nicar MJ, Khosravi MJ, Diamandis A, van DJ, Juul A. Insulin-like growth factors (IGF-I, free IGF-I and IGF-II) and insulin-like growth factor binding proteins (IGFBP-2, IGFBP-3, IGFBP-6, and ALS) in blood circulation. J Clin Lab Anal. 1999;13:166–172. doi: 10.1002/(SICI)1098-2825(1999)13:4<166::AID-JCLA5>3.0.CO;2-X. [DOI] [PMC free article] [PubMed] [Google Scholar]
- 21.Sireesha M, Sambasivan V, Kumar VK, Radha S, Raj AY, Qurratulain H. Relevance of insulin-like growth factor 2 in the etiopathophysiology of diabetic nephropathy: possible roles of phosphatase and tensin homolog on chromosome 10 and secreted protein acidic and rich in cysteine as regulators of repair. J Diabetes. 2009;1:118–124. doi: 10.1111/j.1753-0407.2009.00025.x. [DOI] [PubMed] [Google Scholar]
- 22.Jehle PM, Schulten K, Schulz W, Jehle DR, Stracke S, Manfras B, Boehm BO, Baylink DJ, Mohan S. Serum levels of insulin-like growth factor (IGF)-I and IGF binding protein (IGFBP)-1 to -6 and their relationship to bone metabolism in osteoporosis patients. Eur J Intern Med. 2003;14:32–38. doi: 10.1016/s0953-6205(02)00183-8. [DOI] [PMC free article] [PubMed] [Google Scholar]
- 23.van DJ, Ringeling AM, Shmueli SS, Kuijpers MC, Hokken-Koelega AC, van Buul-Offers SC, Jansen M. Circulating levels of human insulin-like growth factor binding protein-6 (IGFBP-6) in health and disease as determined by radioimmunoassay. Clin Endocrinol (Oxf) 1999;50:601–609. doi: 10.1046/j.1365-2265.1999.00694.x. [DOI] [PubMed] [Google Scholar]
- 24.Rosenfel RG, Roberts CT. The IGF system: molecular biology, physiology, and clinical applications. 1999. [Google Scholar]
- 25.Garcia-Fernandez M, Sierra I, Puche JE, Guerra L, Castilla-Cortazar I. Liver mitochondrial dysfunction is reverted by insulin-like growth factor II (IGF-II) in aging rats. J Transl Med. 2011;9:123. doi: 10.1186/1479-5876-9-123. [DOI] [PMC free article] [PubMed] [Google Scholar]
- 26.Castilla-Cortazar I, Garcia-Fernandez M, Delgado G, Puche JE, Sierra I, Barhoum R, Gonzalez-Baron S. Hepatoprotection and neuroprotection induced by low doses of IGF-II in aging rats. J Transl Med. 2011;9:103. doi: 10.1186/1479-5876-9-103. [DOI] [PMC free article] [PubMed] [Google Scholar]
- 27.Kratz G, Lake M, Gidlund M. Insulin like growth factor-1 and -2 and their role in the reepithelialisation of wounds; interactions with insulin like growth factor binding protein type 1. Scand J Plast Reconstr Surg Hand Surg. 1994;28:107–112. doi: 10.3109/02844319409071187. [DOI] [PubMed] [Google Scholar]
- 28.Kratz G, Lake M, Ljungstrom K, Forsberg G, Haegerstrand A, Gidlund M. Effect of recombinant IGF binding protein-1 on primary cultures of human keratinocytes and fibroblasts: selective enhancement of IGF-1 but not IGF-2-induced cell proliferation. Exp Cell Res. 1992;202:381–385. doi: 10.1016/0014-4827(92)90089-q. [DOI] [PubMed] [Google Scholar]