Abstract
Spatially modulated ultrasound radiation force (SMURF) imaging is an elastographic technique that involves generating a radiation force beam with a lateral intensity variation of a defined spatial frequency. This results in a shear wave of known wavelength. By using the displacements induced by the shear wave and standard Doppler or speckle-tracking methods, the shear wave frequency, and thus material shear modulus, is estimated. In addition to generating a pushing beam pattern with a specified lateral intensity variation, it is generally desirable to induce larger displacements so that the displacement data signal-to-noise ratio is higher. We provide an analysis of two beam forming methods for generating SMURF in an elastic material: the focal Fraunhofer and intersecting plane wave methods. Both techniques generate beams with a defined spatial frequency. However, as a result of the trade-offs associated with each technique, the peak acoustic intensity outputs in the region of interest differs for the same combinations of parameters (e.g., the focal depth, the width of the area of interest, and ultrasonic attenuation coefficient). Assuming limited transducer drive voltage, we provide a decision plot to determine which of the two techniques yields the greater pushing force for a specific configuration.
I. Introduction
Methods for examining and imaging tissue stiffness are widely studied [1]–[10]. In acoustic radiation force imaging techniques, high-intensity ultrasound pulses are applied for a short duration (<1 ms) to a region of interest (ROI) [5], [9]. A transfer of momentum from an ultrasonic pressure wave to the tissue creates a radiation force that results in the displacement of the material. These displacements are on the order of <40 μm [11]–[13]. Because stiffer materials tend to be displaced less than softer materials, the relative displacements of the interrogated points within the medium are used to create a map related to stiffness. This is diagnostically relevant because many disease processes are characterized by changes in tissue stiffness. Imaging techniques that create maps of tissue stiffness can thus provide important information about the health of the tissue.
The shear modulus of various tissues spans a wide range (103 to 107 Pa) and shows a greater contrast than the bulk modulus [5]. Shear modulus is thus useful in differentiating between tissue types, as well as between healthy and diseased tissues. Studies [14]–[17] have shown that there is a correlation between the disease state and tissue shear modulus. Carstensen et al. compiled data collected by several groups that shows a correlation between the degree of liver fibrosis and the liver shear modulus [18].
In contrast to other methods that apply a known vibration frequency and then attempt to estimate the wavelength of the resulting shear wave, spatially modulated ultrasound radiation force (SMURF) imaging [10] is an elastographic technique that generates a shear wave of a known wavelength, λ, and then measures the frequency, f, of the wave to calculate the tissue shear modulus, G. The shear modulus for a linear, elastic material is given by
| (1) |
where ρ is the density for soft tissue and is assumed to be 1000 kg/m3.
An impulsive (less than 50 μs), high-intensity acoustic pulse with a desired spatially varying magnitude is applied to the tissue. Such an impulse results in the generation of shear waves that propagate from the region of excitation. The spatial frequency of the intensity pattern, and thus force variation, is set equal to the desired spatial frequency (k) of the shear wave to be generated. The tissue motion is tracked by acquiring echoes along a single A-line. The temporal frequency of the resulting motion is estimated using displacement estimation techniques. The shear wave’s wavelength and temporal frequency are then used to calculate the shear wave speed, and thus shear modulus. One advantage of using this SMURF method to measure shear modulus is that tracking the tissue motion in a single location reduces speckle-induced bias in phase estimates because constant phase errors are canceled out [19], [20].
To induce a shear wave of known wavelength in the tissue, the ideal pushing force would have a well-defined spatial frequency. In addition, the pushing force would have to be localized to the ROI. We present two methods that can be used to generate this spatial acoustic intensity variation, namely, the focal Fraunhofer (FF) and intersecting plane wave (IP) methods. We present an analysis indicating which beam-forming technique generates maximum acoustic intensity in the ROI for limited transducer element drive power. The analysis includes parameters of focal length and the lateral width of the region of excitation. Selecting the intensity-maximizing configuration ensures that we maximize the tissue displacement and, hence, the SNR of the displacement estimates.
In Section II, we provide the theoretical development of the ultrasound intensity fields associated with both methods and illustrate their spatial configurations. In Section III, we explain the simulation setup used to characterize and determine the thresholds between the methods. Section IV presents the simulation results and the decision plot indicating which method to use for a specific ROI width and depth. Finally, we provide further insight into the mechanisms at work and the implications of our results.
II. THEORY
In an absorbing meium, under plane wave or weakly focused conditions, the radiation force at a given depth, z and ultrasound intensity, I(x, y) are related by [21]
| (2) |
where F is the spatially and temporally modulated body force in newtons per cubic meter, α is the attenuation coefficient of the medium in nepers per meter, c is the speed of sound in the medium in meters per second, and I is the intensity of the beam in watts per square meter.
Assuming that the attenuation coefficient and the speed of sound in the medium are constant, we can achieve the desired forcing function by manipulating ultrasound beams to create a spatially varying intensity pattern. In SMURF imaging, the radiation force is shaped by varying the applied ultrasound intensity as a function of the lateral coordinate. The spatial frequency (k) of the intensity pattern, and thus force variation, is set equal to the desired spatial frequency of the shear wave to be generated (k = 2π/λ).
The ideal spatially modulated push force would be well localized in space, to provide spatial resolution, and have a well-defined spatial frequency, so that the shear wave frequency may be readily measured. In this work, a Gaussian-enveloped sinusoidal variation in intensity has been selected as the desired model for the lateral intensity pattern. Spatial resolution and purity of spatial frequency may be traded off by varying the width of the Gaussian envelope. Both methods proposed here will generate lateral beam profiles conforming to this model.
Field II [22], an acoustic field simulator tool, is used to simulate the beams as generated by a linear array similar to a Siemens VF 7–3 ultrasound transducer (Siemens AG, Munich, Germany). Field II is used in this work to confirm that for a desired ROI pattern, the calculated input parameters used in the transducer apodization and delay profiles result in the expected pattern. It is also used in comparing the relative ultrasound intensity generated at the ROI by both methods for various combinations of the ROI focal depth and width. The simulator is linear, and scaling the impulse response results in an equivalent scaling of the measured amplitudes. Consequently, it is sufficient to normalize the apodizations and thus constrain the drive voltage before performing the ROI intensity comparison of the two methods. We have also shown in previous work [23] that the tracked shear waves generated in phantoms using SMURF methods are in agreement with the corresponding patterns simulated with FIELD II. We explore further which method is more effective in terms of relative ultrasound intensity at the focus for different combinations of parameters such as the depth of the focal region, the width of the desired pushing region, and the transducer center frequency.
A. Focal Fraunhofer Method
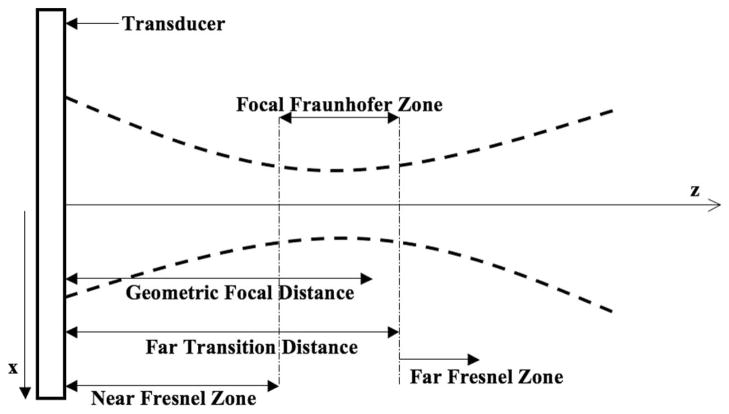
The FF method relies on the fact that lateral pressure distribution within the focal zone (see Fig. 1) is determined by the Fourier transform of the transducer’s apodization function and can thus be written as [10]
Fig. 1.
Diagram indicating the focal Fraunhofer zone. The lateral intensity profile in the focal Fraunhofer zone is the Fourier transform of the apodization of the aperture elements. The Fourier transform relationship is thus used to determine the necessary weighting of the transducer elements for a desired intensity pattern.
| (3) |
where
| (4) |
and v0 is the peak velocity amplitude of the transducer; kl, c, and λl are the wave number, the sound speed, and the wavelength of the longitudinal wave, respectively.
Again, the ideal pushing force (and hence intensity pattern) should be well localized to maximize the energy deposition at the ROI. It should also have a well defined spatial frequency so that the resulting shear wave has a known wavelength. A sinusoidal pressure distribution limited in its lateral extent resembles such a pattern. Based on the Fourier transform relationship, the apodization that guarantees a sinusoidal pressure distribution with equally spaced peaks at the focal zone, in theory, consists of a pair of impulses. However, because it is not possible to create perfect impulses with the transducer elements and the applied force is to be confined laterally, the apodization function consists instead of a pair of narrow Gaussian functions. Our model pushing pulse is thus a Gaussian-weighted sinusoid of the desired spatial frequency.
The function describing the apodization and delay profiles to be applied to the transducer elements can be represented by the expression
| (5) |
where x0 is the lateral distance at the transducer face (z = 0), M(x0) represents the magnitude of the apodization, and φ(x0) contains the phase information.
| (6) |
where Δ is the distance from the center of the Gaussian function to the center of the transducer face and σa is the spread of the Gaussian function. The phases of the elements are determined geometrically.
With the lateral pressure variation shown in (2), the intensity at the region of interest is found to be (see [10])
| (7) |
Δ is found to be
| (8) |
where cl is the longitudinal speed of sound, f0 is the transducer center frequency, and λs is the desired shear wavelength. As indicated by (8), the spatial frequency of the pressure distribution can be controlled by the distance between the peaks of the two Gaussians in the apodization profile.
The widths of the beams at the aperture are represented by the spread of the Gaussians (σa) and the width of the ROI is represented by the spread of its Gaussian envelope (σf). The width of the pushing region is controlled by the widths of the two Gaussians in the apodization profile. The relationship between the width of the beams at the transducer (apodization profile) and that of the desired spatial pattern is found to be
| (9) |
For a given focal depth and limited drive voltage, the energy at the focus is proportional to the effective aperture width, represented by σf. If the desired focal width is large, the widths of the apodized beams at the transducer must be narrow because of the inverse Fourier relationship between the apodization and the lateral intensity variation in the far-field. Narrowing the width of the apodization beams at the transducer implies that the energy at the focus will decrease accordingly.
B. Intersecting Plane Wave Method
A spatially modulated function can also be generated by the interference pattern of two intersecting planar waves. The pressure caused by the interference of the two plane waves propagating at angles ±θ to the z-axis, can be expressed by
| (10) |
where fl and kl are the frequency and wave number of the ultrasound wave. By using the appropriate trigonometric identities, the expression for the lateral pressure distribution can be rewritten as
| (11) |
where the spatial frequency of the lateral pressure variation is given by k,
| (12) |
and the intensity is
| (13) |
The wavenumber of the induced shear wave, ks, is thus
| (14) |
Consequently, the angle, θ, required to result in the desired spatial variation must then be
| (15) |
Given that we have a finite aperture and the ROI is to be limited in its lateral extent, two unfocused Gaussian beams are used to approximate the planar wave fronts.
The function describing the apodization and delay profiles to be applied to the transducer elements can be represented by the expression:
| (16) |
where x0 is the lateral distance at the transducer face (z = 0), Δ is the distance from the center of the Gaussian function to the center of the transducer face, and σa is the spread of the Gaussian function. The complex function A(x0) is a Gaussian-modulated version of the equation of two forward-traveling plane waves at an angle.
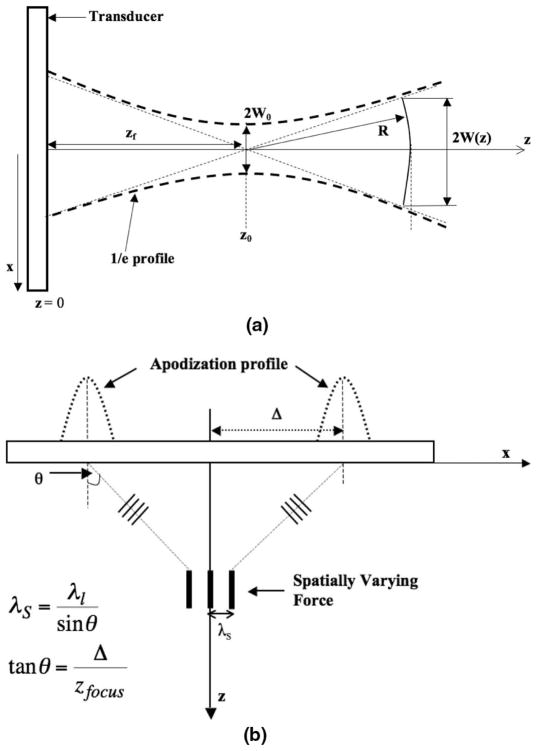
Gaussian beams are of particular interest because they maintain a Gaussian profile everywhere in the field of propagation [24]. The shape of a propagating Gaussian beam is represented by the hyperbolic profile shown in Fig. 2(a).
Fig. 2.
(a) The profile of a Gaussian beam emitted from a transducer (as in [24]). (b) The profile of the intersecting Gaussian beams emitted from a transducer.
Let W(z) represent the width of the beam, where the pressure amplitude is reduced by 4.3 dB (i.e., e−1), from the on-axis value. It is represented mathematically as
| (17) |
where
| (18) |
and the radius of curvature R(z) of a wave front in the beam is given by
| (19) |
where z0 is the Rayleigh distance and zf is the focal distance. The width of the waist is W0. By observing (17) and (18), we can see that, first, the Rayleigh distance is directly proportional to the square of the beam width at the waist. Second, near the waist, i.e., for |z − zf| < z0, W(z) can be approximated by W0. In other words, in this region, the beam diverges slowly. Further from the waist (|z − zf| ≫ z0), the beam width increases proportionally with distance and can be approximated as W(z) ≈ (λ/(πW0))(z − zf). Note that the larger the waist, the slower the divergence of the beam profile, and the greater the region over which the plane wave approximation holds.
Also, from (19), for |z − zf| ≫ z0 (far from the beam waist), the wave front radius asymptotically approaches z and is approximated as a spherical wave. Near the waist however, the wave front radius is very large compared with the beam width W(z) and the beam can thus be approximated as a plane wave (infinite radius) with a Gaussian lateral profile. Based on these relationships, one can determine the Gaussian apodization that would be required for a desired ROI width.
The spatial frequency at the focus is determined by the angle at which the beams intersect. Knowing the longitudinal wavelength and the desired shear wavelength, θ is first determined by using (15).
From Fig. 2(b),
| (20) |
The distance from the center of the beam profiles to the center of the transducer, Δ, depends on the focal depth, because θ is kept constant. Recall that the apodization consists of two Gaussians separated by a distance of 2Δ. The delay profile is such that the waves propagate at an angle so that the pattern is generated by a constructive and destructive interference at the focus. The resulting pattern also has a Gaussian profile. The widths of the beams at the aperture are thus represented by the spread, σa, of the Gaussians. The width of the ROI is also represented by the spread of its Gaussian envelope, σf. The relationship between the width of the beams at the transducer (apodization profile) and the desired spatial pattern is found to be
| (21) |
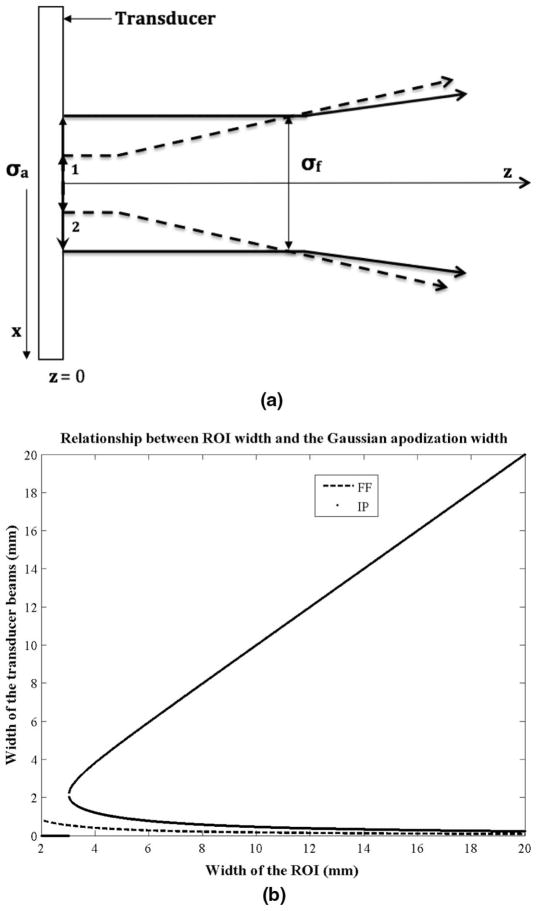
where p = (2zλ0)/π, λ0 is the transducer wavelength, and z is the focal depth. Eq. (21) indicates that there are two possible apodization widths (σa) that would result in an ROI of a desired width (σf). However, the solution that is more consistent with the plane wave assumption, and is likely to produce a greater acoustic intensity at the ROI, is the one that requires a wider Gaussian apodization (see Fig. 3). That is,
Fig. 3.
(a) Two solutions to the equation relating the ROI lateral width to the width of the Gaussian apodization. The figure shows the two ways to create an ROI of the desired beam width. The solution requiring a wider apodization is more desirable because it results in a collimated beam and is thus consistent with the plane wave assumption. (b) The width of the Gaussian apodization as a function of the ROI lateral width at a fixed ROI depth of 5 cm. This is an illustration of the solutions to (6) and (17). The intersecting plane wave method has two possible solutions for creating an ROI of a particular width. The larger of the two is more desirable.
| (22) |
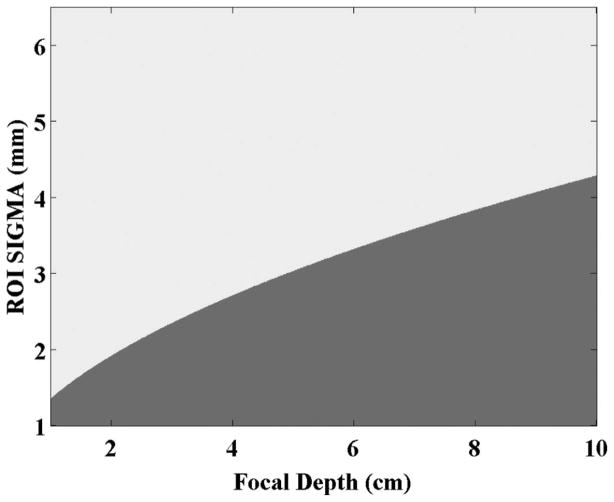
Note that there will be combinations of focal depths (z) and ROI beam widths (σf) that will result in a non-real number for the spread of the Gaussian apodization (σa). For these cases, the focal Fraunhofer will automatically be the method of choice (see Fig. 4).
Fig. 4.
Combinations of the ROI focal depth and width for which the solution for the intersecting plane wave aperture width is not real. The darker portion (bottom-right) indicates the cases where the solution is not real. In these cases, the focal Fraunhofer method is to be used.
III. METHODS
A. Simulation of the SMURF Pattern
A linear array similar to a Siemens VF7–3 ultrasound transducer was simulated. The transducer has 192 elements with a pitch of 0.2 mm, a height of 7.5 mm, and an elevation focus of 3.75 cm. The pushing pulse length is 100 cycles and falls in the typical range used in practice. The signal was sampled at 100 MHz.
Both methods of beam formation were simulated using Field II with no attenuation. The shape of the intensity pattern was similar for different levels of attenuation; however, because no energy is lost in the near field in this case, it was used in subsequent figures to portray the similarities and the differences in the FF and IP methods as a function of the focal depth and the width of the ROI. The speed of sound in tissue and the density of tissue were assumed to be 1540 m/s and 1000 kg/m3, respectively.
Delay and apodization values for each simulated transducer element were calculated according to equations shown in the previous section. Apodization and delay profiles were determined for each configuration with ROI depths ranging from 1 to 10 cm and ROI widths ranging from 1 to 20 mm. The peak acoustic intensity at the ROI was simulated for each configuration.
For the FF method, (8) and (9) are first used to calculate the width of the Gaussian apodization (σa) and their lateral offset (7). The magnitude of the apodization that is applied across the simulated transducer elements is determined using
The delay is calculated geometrically with the elements closest to the ROI depth, given the longest delay (τ)
where r(x0) is the distance from transducer element to the ROI focal depth.
For the IP method, the desired spatial frequency is dependent on the longitudinal wavelength and the angle at which the beams intersect. The required angle is determined using (15), and this, in turn, is used to find the lateral offset (7) of the Gaussian apodization needed to create the ROI at greater depths. The width of the Gaussian apodization is calculated using (21). The magnitude of the apodization that is applied across the simulated transducer elements is then calculated by
The phase and the delay of the elements are calculated using
respectively.
B. Generating the Decision Plot
The decision plot is a representation of which of the two methods is more efficient for different ROI focal depth and width choices at a fixed transducer frequency. To generate this, two matrices are created: one for the FF method and the other for the IP method. The rows represent the ROI widths and the columns represent the ROI focal depth. The intensity at the focal point in the ROI is measured for each combination of ROI focal depth and width, and entered into the matrices. The intensities in both matrices are then compared cell-by-cell, and the comparison is rendered as an image showing which method resulted in a greater intensity.
In addition, realizing that there are combinations of focal depths and ROI beam widths that will result in a non-real number for the spread of the Gaussian apodization (21), these cases are determined and considered to be regions of the decision plot where the FF method will automatically be the method of choice. By combining both results, the ultimate threshold plot is determined.
IV. RESULTS
A. Apodization and Delay Profiles as a Function of Focal Depth
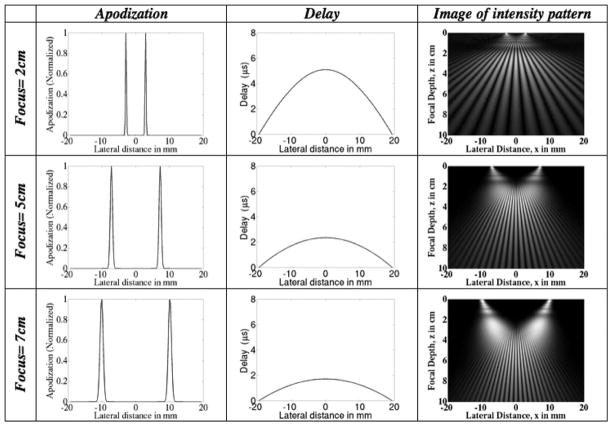
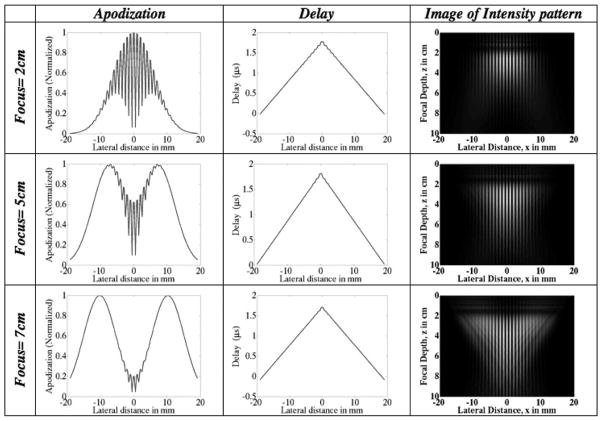
The apodization and delay profiles for several focal depths for both the FF and the IP methods are depicted in Figs. 5 and 6. The width of the ROI and other parameters are kept constant. The width (spread) of the apodization profiles serve to indicate the effective width of the aperture needed to create the beam pattern at a specific focal depth, spatial frequency, and ROI width. The delay profiles show the necessary degree of beam steering. Note that the delay profiles do not vary as much in the case of the IP method as they do in the FF method.
Fig. 5.
Focal Fraunhofer method: plots of the transducer apodization and delay profiles at different focal depths for a fixed ROI envelope spread (lateral width) of 5 mm. The focal depth increases from top to bottom. (Left) The increase in the widths of the apodized beams with increasing depth. This implies that there is an increase in the number of transducer elements required to create the ROI of a fixed lateral width at greater depths. (Middle) The delay that is applied across the aperture elements to steer the beam according to the desired depth. The greater the focal depth, the less aggressive the degree of beam steering. (Right) Image of intensity pattern.
Fig. 6.
Intersecting plane wave method: plots of the transducer apodization and delay profiles at different focal depths for a fixed ROI envelope spread (lateral width) of 5 mm. The focal depth increases from top to bottom. (Left) The apodized beams are pushed further apart to create the ROI at greater depths. (Middle) The delay that is applied across the aperture elements to steer the beam according to the desired depth. The delay profiles do not vary significantly with increasing focal depth because the spatial frequency is kept constant. (Right) Image of intensity pattern.
B. Apodization and Delay Profiles as a Function of Desired ROI Beam Width
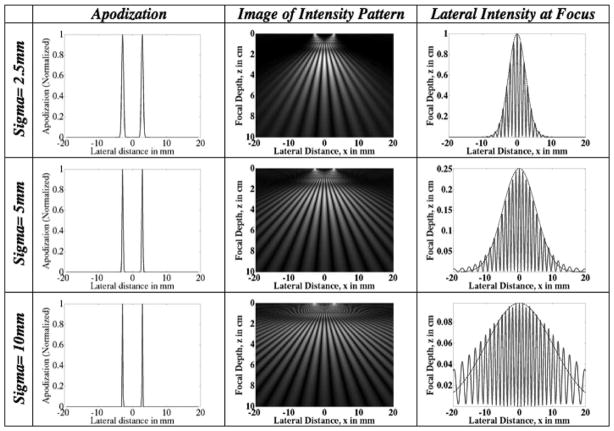
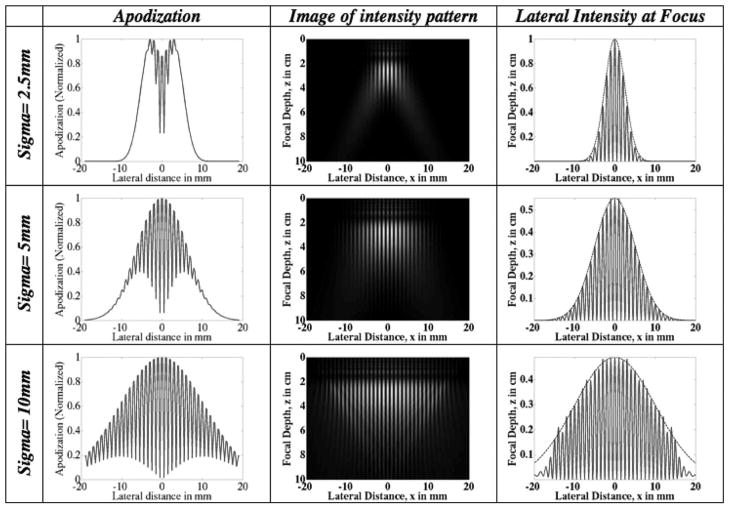
The apodization and delay profiles as a function of ROI width for both the FF and the IP methods are depicted in Figs. 7 and 8. The ROI depth is kept constant at 2 cm. All other parameters are kept constant as well. In the FF case (Fig. 7), the widths of the beams at the transducer decrease as the width of the pushing region increases. This is contrast with the IP method (Fig. 8) for which the widths of the beams at the transducer increase as the width of the pushing region increases. Comparing Figs. 7 and 8, we can see that the IP method uses more elements than the FF method for the cases shown.
Fig. 7.
Focal Fraunhofer method: plots of the transducer apodization and delay profiles for ROI of different beam widths. The desired width of the region of interest increases from top to bottom. The apodization profiles show that wider ROIs require fewer transducer elements to be employed. The use of fewer transducer elements implies a smaller pushing force at the ROI. The lateral intensity profiles at the ROI focal depth are plotted in the third column. Note the decrease in intensity with increasing width. Superimposed on the lateral profiles is a Gaussian of the specified ROI width (spread) which indicates that the intensity field is localized to the ROI.
Fig. 8.
Intersecting plane wave method: plots of the transducer apodization and delay profiles for ROI of different beam widths. The desired width of the region of interest increases from top to bottom. The apodization profiles show that wider ROIs require more transducer elements to be employed. The lateral intensity profiles at the ROI focal depth are plotted in the third column. Note the decrease in intensity with increasing width. Superimposed on the lateral profiles is a Gaussian of the specified ROI width (spread) which indicates that the intensity field is localized to the ROI.
C. Intensity at the ROI as a Function of the Desired ROI Depth and Width
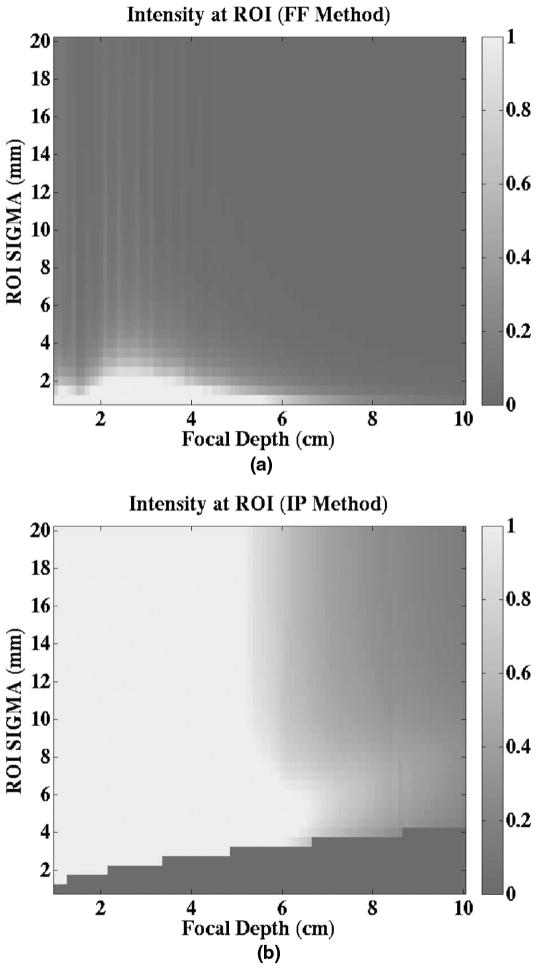
To investigate the relative amount of pushing energy each method generated for a given ROI width and focal depth, the intensity at the ROI using each method is determined and plotted. Depending on the desired ROI width and depth, one can decide which method to use to generate a greater pushing force. Figs. 9(a) and 9(b) depict the relative peak intensity levels at the ROI for an ultrasonic attenuation of 0.5 dB/cm/MHz and a transducer frequency of 5.33 MHz. The darkened region at the bottom-right of Fig. 9(b) represents the cases in which the calculated aperture width for the IP method is found to be a non-real number, so that the FF method automatically becomes the method of choice. The intensities have been normalized relative to the maximum of the intensity value from both methods, so that both plots use the same scale. Fig. 9 shows that the intensities for most of the ROI depth and width combinations using the IP method are greater than those using the FF method.
Fig. 9.
Images of intensity at the ROI as a function of ROI (a) depth and (b) width for both the focal Fraunhofer (FF) and intersecting plane wave (IP) methods. The images show which method results in a greater acoustic intensity at the focus (and thus greater pushing energy) for a specified focal depth and ROI sigma (lateral width). For cases in which the calculated aperture width for the IP method is found to be a nonreal number, the FF method is automatically the method of choice. Both plots are on the same scale.
D. Effect of Frequency on the Decision Plots
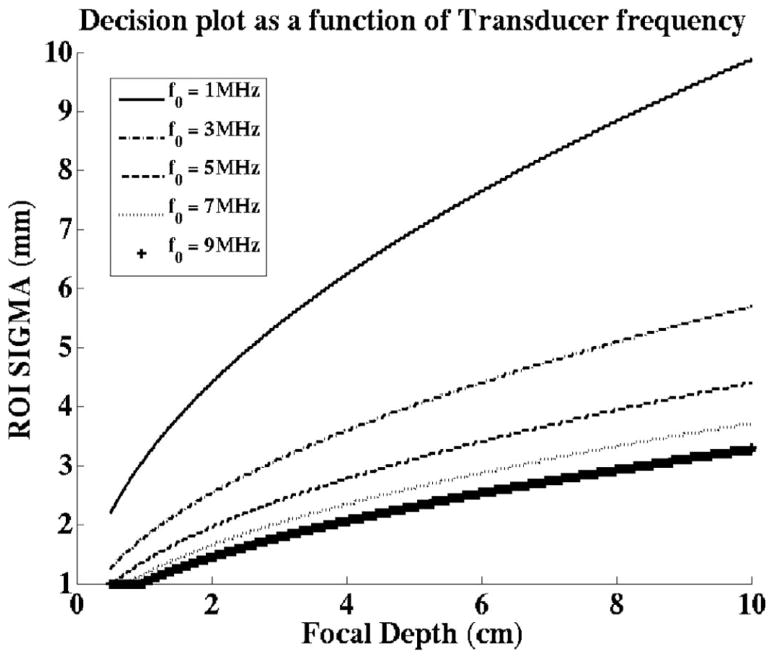
From the expressions of the beam widths at the aperture, (9) and (22), we expect the apodizations for both methods to be influenced by the transducer frequency (or wavelength). Fig. 10 portrays the effects of the transducer frequency on the decision plots. The region below each line represents the combinations of ROI depths and widths for which the FF method should be used. These results indicate that the FF method becomes more favorable for lower transducer frequencies.
Fig. 10.
Effect of transducer frequency. The focal Fraunhofer (FF) method is more effective for the combinations of ROI sigma values and focal depths represented by the region under each line. The decision plot shifts in favor of the FF method for lower transducer center frequencies.
V. DISCUSSION
The FF and IP methods are two ways that a shear wave with a localized spatial acoustic intensity variation can be generated. However, the peak intensity in the ROI associated with the methods differ for the same focal depth, ROI width, and transducer frequency. Consequently, we attempt to determine which method is more efficient for a specific set of parameters to maximize the pushing force, and thus displacement SNR.
Because the spread of the Gaussian envelope at the ROI is characterized by the spread widths of the beams at the aperture, the width of the ROI is a function of the widths of the Gaussian beams in the apodization. For the FF method, the spread of the Gaussian apodization is inversely proportional to the spread of the Gaussian envelope at the ROI and the focal depth. The FF configuration is such that for wide pushing regions (high σf values), the transducer elements must have two very narrow Gaussians in the applied apodization. This is because the lateral pressure distribution at the focal Fraunhofer zone is determined by the Fourier transform of the apodization profile at the transducer. The apodization profiles in Fig. 7 show this relationship. This implies that the width of the ROI will ultimately be limited by the size of the individual transducer elements. The ROI depth is set by geometrically focusing the beam, with wider beams required to maintain the same ROI width at greater depths. For the IP method, on the other hand, the spread of the Gaussian apodization is directly proportional to the spread of the Gaussian envelope at the ROI. The intent is to create a beam that is collimated so that it closely approximates the plane wave assumption. Based on Kino’s analysis of a Gaussian beam profile, the implication is that the width of the Gaussian apodization will be close to the value of the ROI width, and the ROI width will thus be constrained by the overall aperture width [24]. As expected, the results indicate that there is a trade-off between the two techniques. Figs. 9(a) and 9(b) show that there are certain ROI widths and focal depths at which one method generates a greater acoustic output at the focus. For SMURF imaging with a 5.33-MHz transducer and a shear wavelength chosen to be about 1 mm, the figures show that the IP method is generally the more effective of the two.
In deciding which method to use, however, there is an additional component that must be considered. In the case of the IP method, the solution for the width of the Gaussian apodization that is required for a given ROI width and focal depth is limited in its application because of diffraction. As previously mentioned, there are two ways to produce an ROI with a particular lateral width at a fixed depth [Fig. 3(a)]. In one case, the apodization width is smaller than the ROI width. Here, the Rayleigh distance is shorter and the beam diverges faster. The implication is that the Rayleigh distance falls short of the ROI and the intersecting waves at the ROI are more spherical than planar. In the other case, the apodization width is approximately equal to the width of ROI. Here the Rayleigh distance is farther and the beam diverges slowly. The implication is that the Rayleigh distance falls past the ROI, and the intersecting waves at the ROI are collimated and consistent with a plane wave assumption. The limitation of using this model is thus that the ROI cannot be both narrow and far away from the aperture while maintaining a plane wave assumption. Mathematically, this is represented by the solutions to (22) that result in a non-real number, and is portrayed by the discontinuity in the plot relating the apodization width and the ROI width at a particular depth [Fig. 3(b)]. For these cases, the FF method must be used. The results indicated that this is the overarching determinant of the decision plot (Figs. 4 and 9).
Besides the focal depth and the width of the region of interest, the other parameter that affects the decision to select one method over another, is the transducer center frequency. Fig. 10 shows that the decision plot shifts in favor of using the FF method for lower transducer frequencies. When all else is equal, higher element utilization is expected to generate a greater acoustic intensity, and thus greater pushing force at the ROI. The spread of the Gaussian apodization is a nonlinear function of the transducer frequency for the IP method, but is inversely proportional to the transducer frequency for the FF method. From (6) and (21), a decrease in the transducer frequency would result in an increase in the spread of the Gaussian apodization for the FF method, but a decrease for the IP method. The employment of more elements is one of the likely causes for the shift of the decision plot in favor of the FF method.
Although the choice of the FF or IP method is independent of the shear wavelength, the choice of shear wavelength is important for a few reasons. Assuming that the number of shear wave peaks is kept constant, increasing the spatial frequency will result in a higher spatial resolution. Thus, if there are spatial details of interest within the region to be interrogated, using a higher spatial frequency will be beneficial. If, however, the goal is to determine the average shear modulus of an area, using a smaller spatial frequency (larger shear wavelength) will be more efficient. There are also certain constraints to keep in mind. If the shear wavelength is too large, the farther peaks will be significantly attenuated before arriving at the tracking location. This reduces the SNR of the displacement data and could affect the shear modulus estimate. If the shear wavelength is too small, it could become harder to distinguish the arrival of one peak of the wave from the next, because there is a limitation on the size of the elements in the aperture and on the PRF of the tracking pulses. The accuracy of the wave frequency, and thus the shear modulus estimate, would be affected negatively. In addition, if the material is viscoelastic, there will be a frequency-dependent attenuation of the induced shear wave. The result is that shear waves with a higher spatial frequency will be attenuated more and this could lead to a reduction in the SNR of the displacement data. From the work done in our lab, we have found a shear wavelength between 1 and 2 mm to be adequate [19], [20].
VI. CONCLUSION
We have presented two methods for generating a spatial acoustic intensity variation, the FF and IP methods. We analyzed and determined which beam-forming technique is better for a specified set of parameters including, the focal length, the lateral width of the region of excitation and the transducer frequency. Selecting the better of the two configurations ensures that the available energy is used efficiently and that the tissue displacement and SNR are maximized.
The two methods exhibited differing trends in peak intensity and aperture utilization for the same ROI specifications. By estimating the appropriate aperture apodization and delays required, as well as the intensity at the ROI, we have shown a way to select the method that is more efficient for different combinations of ROI depths and widths, assuming limited transducer drive voltage. The results indicate that the IP method is generally the more effective of the two, but the FF method is more effective for configurations in which the ROI is located deeper and is narrower in its lateral extent.
Acknowledgments
This work was supported by the Wallace H. Coulter Foundation, Siemens Medical Solutions USA, and the National Institutes of Health.
Biographies
 Etana Chioma Elegbe received the B.Sc degree in electrical engineering from the Rochester Institute of Technology, Rochester, NY, in 2005. She worked at Bose Corporation in Framingham, MA, from 2005 to 2006 as an Automotive Audio Transducer Engineering Intern and then as a Firmware Verification Test Intern (Automotive Software Division). She earned an M.Sc. degree in biomedical engineering from the University of Rochester, Rochester, NY, in 2009. She is currently working toward the Ph. D. degree in the Department of Biomedical Engineering at the University of Rochester. Her research interests include acoustic radiation force-based imaging and elastography.
 Manoj Gopal Menon received a B.Sc degree in biomedical engineering from the University of Rochester, Rochester, NY, in 2004. In 2003, he joined the Center for Visual Science at the University of Rochester, Rochester, NY, as a research assistant, where he contributed to customized vision correction research until 2005. He earned M.Sc. and a Ph.D. degrees in biomedical engineering from the University of Rochester, Rochester, NY, in 2006 and 2010, respectively. He is currently employed by Siemens Medical Solutions USA, Inc., Issaquah, WA as an ultrasound engineer.
 Stephen McAleavey received the B.S. and M.S. degrees in electrical engineering and the Ph.D. degree in electrical and computer engineering from the University of Rochester in 1996, 1998, and 2002, respectively. From 2001 to 2004, he was a Research Associate in the Department of Biomedical Engineering at Duke University. In 2004, he returned to the University of Rochester, where he is currently an Associate Professor in the departments of Biomedical Engineering and Electrical and Computer Engineering. His research interests include Doppler methods, acoustic radiation force-based imaging, and applying tissue motion estimation to develop novel ultrasound imaging methods.
References
- 1.Lerner RM, Huang SR, Parker KJ. Sonoelasticity images derived from ultrasound signals in mechanically vibrated tissues. Ultrasound Med Biol. 1990;16(3):231–239. doi: 10.1016/0301-5629(90)90002-t. [DOI] [PubMed] [Google Scholar]
- 2.Parker KJ, Huang SR, Musulin RA, Lerner RM. Tissue- response to mechanical vibrations for sonoelasticity imaging. Ultrasound Med Biol. 1990;16(3):241–246. doi: 10.1016/0301-5629(90)90003-u. [DOI] [PubMed] [Google Scholar]
- 3.Ophir J, Cespedes I, Ponnekanti H, Yazdi Y, Li X. Elastography— A quantitative method for imaging the elasticity of biological tissues. Ultrason Imaging. 1991 Apr;13:111–134. doi: 10.1177/016173469101300201. [DOI] [PubMed] [Google Scholar]
- 4.Fatemi M, Greenleaf JF. Ultrasound-stimulated vibro-acoustic spectrography. Science. 1998 Apr 3;280:82–85. doi: 10.1126/science.280.5360.82. [DOI] [PubMed] [Google Scholar]
- 5.Sarvazyan AP, Rudenko OV, Swanson SD, Fowlkes JB, Emelianov SY. Shear wave elasticity imaging: A new ultrasonic technology of medical diagnostics. Ultrasound Med Biol. 1998 Nov;24:1419–1435. doi: 10.1016/s0301-5629(98)00110-0. [DOI] [PubMed] [Google Scholar]
- 6.Nightingale KR, Palmeri ML, Nightingale RW, Trahey GE. On the feasibility of remote palpation using acoustic radiation force. J Acoust Soc Am. 2001 Jul;110:625–634. doi: 10.1121/1.1378344. [DOI] [PubMed] [Google Scholar]
- 7.Sandrin L, Tanter M, Catheline S, Fink M. Shear modulus imaging with 2-D transient elastography. IEEE Trans Ultrason Ferroelectr Freq Control. 2002 Apr;49:426–435. doi: 10.1109/58.996560. [DOI] [PubMed] [Google Scholar]
- 8.Greenleaf JF, Fatemi M, Insana M. Selected methods for imaging elastic properties of biological tissues. Annu Rev Biomed Eng. 2003;5:57–78. doi: 10.1146/annurev.bioeng.5.040202.121623. [DOI] [PubMed] [Google Scholar]
- 9.Nightingale K, McAleavey S, Trahey G. Shear-wave generation using acoustic radiation force: In vivo and ex vivo results. Ultrasound Med Biol. 2003 Dec;29:1715–1723. doi: 10.1016/j.ultrasmedbio.2003.08.008. [DOI] [PubMed] [Google Scholar]
- 10.McAleavey SA, Menon M, Orszulak J. Shear-modulus estimation by application of spatially modulated impulsive acoustic radiation force. Ultrason Imaging. 2007 Apr;29:87–104. doi: 10.1177/016173460702900202. [DOI] [PubMed] [Google Scholar]
- 11.Bercoff J, Tanter M, Fink M. Supersonic shear imaging: A new technique for soft tissue elasticity mapping. IEEE Trans Ultrason Ferroelectr Freq Control. 2004 Apr;51:396–409. doi: 10.1109/tuffc.2004.1295425. [DOI] [PubMed] [Google Scholar]
- 12.Fahey BJ, Palmeri ML, Trahey GE. The impact of physiological motion on tissue tracking during radiation force imaging. Ultrasound Med Biol. 2007 Jul;33:1149–1166. doi: 10.1016/j.ultrasmedbio.2007.01.007. [DOI] [PMC free article] [PubMed] [Google Scholar]
- 13.Nightingale K, Soo MS, Nightingale R, Trahey G. Acoustic radiation force impulse imaging: In vivo demonstration of clinical feasibility. Ultrasound Med Biol. 2002 Feb;28:227–235. doi: 10.1016/s0301-5629(01)00499-9. [DOI] [PubMed] [Google Scholar]
- 14.Ziol M, Handra-Luca A, Kettaneh A, Christidis C, Mal F, Kazemi F, de Lédinghen V, Marcellin P, Dhumeaux D, Trinchet JC, Beaugrand M. Noninvasive assessment of liver fibrosis by measurement of stiffness in patients with chronic hepatitis C. Hepatology. 2005;41(1):48–54. doi: 10.1002/hep.20506. [DOI] [PubMed] [Google Scholar]
- 15.Sandrin L, Fourquet B, Hasquenoph JM, Yon S, Fournier C, Mal F, Christidis C, Ziol M, Poulet B, Kazemi F, Beaugrand M, Palau R. Transient elastography: A new noninvasive method for assessment of hepatic fibrosis. Ultrasound Med Biol. 2003;29(12):1705–1713. doi: 10.1016/j.ultrasmedbio.2003.07.001. [DOI] [PubMed] [Google Scholar]
- 16.Rouviere O, Yin M, Dresner MA, Rossman PJ, Burgart LJ, Fidler JL, Ehman RL. MR elastography of the liver: Preliminary results. Radiology. 2006;240(2):440–448. doi: 10.1148/radiol.2402050606. [DOI] [PubMed] [Google Scholar]
- 17.Corpechot C, El Naggar A, Poujol-Robert A, Ziol M, Wendum D, Chazouillères O, de Lédinghen V, Dhumeaux D, Marcellin P, Beaugrand M, Poupon R. Assessment of biliary fibrosis by transient elastography in patients with PBC and PSC. Hepatology. 2006;43(5):1118–1124. doi: 10.1002/hep.21151. [DOI] [PubMed] [Google Scholar]
- 18.Carstensen EL, Parker KJ, Lerner RM. Elastography in the management of liver disease. Ultrasound Med Biol. 2008;34(10):1535–1546. doi: 10.1016/j.ultrasmedbio.2008.03.002. [DOI] [PubMed] [Google Scholar]
- 19.McAleavey S, Collins E, Kelly J, Elegbe E, Menon M. Validation of SMURF estimation of shear modulus in hydrogels. Ultrason Imaging. 2009 Apr;31:131–150. doi: 10.1177/016173460903100204. [DOI] [PMC free article] [PubMed] [Google Scholar]
- 20.McAleavey S, Menon M, Elegbe E. Shear modulus imaging with spatially-modulated ultrasound radiation force. Ultrason Imaging. 2009 Oct;31:217–234. doi: 10.1177/016173460903100401. [DOI] [PMC free article] [PubMed] [Google Scholar]
- 21.Duck FA, Baker AC, Starritt HC. Ultrasound in Medicine. Philadelphia, PA: Institute of Physics; 1998. [Google Scholar]
- 22.Jensen JA, Svendsen NB. Calculation of pressure fields from arbitrarily shaped, apodized, and excited ultrasound transducers. IEEE Trans Ultrason Ferroelectr Freq Control. 1992 Mar;39:262–267. doi: 10.1109/58.139123. [DOI] [PubMed] [Google Scholar]
- 23.McAleavey SA, Menon M, Orszulak J. Shear-modulus estimation by application of spatially-modulated impulsive acoustic radiation force. Ultrason Imaging. 2007 Apr;29:87–104. doi: 10.1177/016173460702900202. [DOI] [PubMed] [Google Scholar]
- 24.Kino GS. Acoustic Waves: Devices, Imaging, and Analog Signal Processing. Englewood Cliffs, NJ: Prentice-Hall; 1987. [Google Scholar]


