Abstract
The application of proteomics methodology for analyzing human blood samples is of increasing importance as a noninvasive method for understanding, detecting, and monitoring disease. In particular, glycoproteomic analysis may be useful in the study of age-related diseases and syndromes, such as frailty. This study demonstrates the use of methodology for isolating plasma glycoproteins using lectins, comparing the glycoproteome by frailty status using two-dimensional polyacrylamide gel electrophoresis and identifying glycoproteins using mass spectrometry. In a pilot study, we found seven glycoproteins to differ by at least twofold in prefrail compared with nonfrail older adults, including haptoglobin, transferrin, and fibrinogen, consistent with known inflammatory and hematologic changes associated with frailty. Enzyme-linked immunosorbent assay analysis found that plasma transferrin concentration was increased in frail and prefrail older adults compared with nonfrail, confirming our proteomic findings. This work provides evidence for using a reproducible methodology for conducting clinical proteomic comparative studies of age-related diseases.
Keywords: Proteomics, Frailty
Frailty, an age-related syndrome, is an important clinical and public health problem present in 10%–15% of adults over the age of 65 years in the United States and is marked by progressive physical decline, medical comorbidity, disability, and mortality (1). Frailty is hypothesized to be a phenotype of accelerated aging and has been associated with changes in several physiological systems, including inflammation, coagulation, hematologic, and endocrine systems (2). Evidence suggests that these physiological changes are evident in a preclinical stage of frailty (prefrailty) (2), and it is hypothesized that these alterations are responsible for the characteristics used to classify the syndrome, such as weight loss, muscle weakness, low activity level, exhaustion, and slow gait (3). The etiology of frailty is not well understood. It has been suggested that the identification of blood markers that distinguish at-risk frail older adults would be useful for the purpose of both prevention and etiologic studies (4).
The use of proteomic methods to examine peripheral blood proteins is of increasing interest and importance to human health, as it provides a noninvasive method for aiding in the diagnosis of several diseases as well as for monitoring disease response to therapy (5). Because human blood contains several 100s to 1,000s of proteins, the application of proteomic methodology to the study of peripheral samples relies upon the ability to isolate proteins of potential biological interest from clinical samples. One possible method for simplifying the proteome is to create a subproteome for study and include the selection of proteins with specific posttranslational modifications, such as glycosylation (6).
Glycoproteins result from the most common type of protein posttranslational modification, comprise up to half of all circulating proteins, and are likely to be the most useful “subproteome” to study using clinical peripheral blood samples for the following reasons (5,7,8). First, glycoproteins are synthesized in the endoplasmic reticulum and play an important role in cell-to-cell and cell-to-matrix interactions, including signaling mechanisms between cells. Second, as secreted proteins, they provide valuable insight into the overall health state of a cell and have been considered potentially useful as disease markers for use as “fingerprints” for specific disease states, which are likely to have alterations in posttranslational modification and glycoprotein expression (5,7). Frailty, in particular, is often described as a syndrome of lack of resilience to stressors with aging, loss of physiological reserve, and decreased capacity to maintain homeostasis (9). Protein homeostasis requires the ability to detect and clear defective proteins as well as the ability to respond to physiological stressors, such as illness and infection. The endoplasmic reticulum is particularly prone to results of inflammation and oxidative stress due to lower glutathione levels (10) and plays an important role in maintaining protein homeostasis. Several prior studies have shown that frailty has been associated with alterations in inflammatory, hematologic, and endocrine system–related glycoproteins (2,4,9). Based on this, we hypothesized that individuals who are frail would have increased inflammation and increased endoplasmic reticulum stress, leading to disruption in posttranslational modification, and subsequently frailty-related differences in expressed glycoproteins.
One method available for the isolation of glycoproteins from biological samples involves the use of lectins, which are plant-derived proteins that selectively bind to the carbohydrate moiety of glycoproteins and allow the selective isolation of glycoproteins based on the configuration and type of glycosylation (6). Many lectins, such as concanavalin A (ConA) and wheat germ agglutinin (WGA), are broad in spectrum with regards to the types of glycoproteins they are able to select, and their use allows the capture of the majority of the glycoproteins present in a sample. Other lectins are more specific in their selectivity and can target glycoproteins with specific types of sugar residues, such as sialic acid in the case of Sambucus nigra agglutinin, fucose in the case of Aleuria aurantia lectin, and O-linked oligosaccharides in the case of Jacalin (Jac). Therefore, one advantage of using lectins is that they can be used alone or in combination to tailor the selection of glycoproteins for those that may be more implicated in specific diseases.
This study presents the glycoprotein profiles obtained with lectin affinity using these five lectins (ConA, WGA, Sambucus nigra agglutinin, Aleuria aurantia lectin, and Jac) with two-dimensional (2-D) polyacrylamide gel electrophoresis and is the first study to use this methodology to compare glycoproteins by frailty status in older adult clinical research subjects. The purpose of this study was to demonstrate the use of reliable and reproducible methods for lectin affinity for comparative analysis of glycoproteins present in peripheral blood samples of human subjects and to show the feasibility of using this method for studying the geriatric syndrome of frailty.
METHODS
Population
Subjects were recruited with informed consent and approval by the Institutional Review Board at the University of Texas Health Science Center at San Antonio. Recruitment efforts targeted healthy volunteers who were free of disabling chronic medical disease. Subjects for developing the lectin affinity methods were younger adults (aged 19–65 years) recruited from the university community, and subjects for the frailty comparison study were older (65+) community-dwelling adults recruited from an independent living retirement community in San Antonio, Texas. Subjects for proteomic comparative analysis were age- and sex-matched nonfrail (n = 4) and prefrail (n = 4) community-dwelling older adults (mean age 81, 50% female). Data from a larger sample of older adults from this community were used to confirm pilot proteomic analysis findings using enzyme-linked immunosorbent assay (ELISA). Subjects for the confirmatory ELISA study were 73 older adults (23 nonfrail, 35 prefrail, and 15 frail older adults). Frailty was defined as the presence of three or more of five criteria: weak grip strength, slow walking speed, unintentional weight loss, self-reported exhaustion, and low physical activity. For the comparative proteomic analysis, prefrailty was defined as the presence of two of these characteristics, and for the ELISA analysis, prefrailty was defined as the presence of one or two of these characteristics. Nonfrailty was defined as the absence of any of these criteria. Standardized criteria for these characteristics were derived from prior work in a population-based sample of community-dwelling older adults in San Antonio, TX, and have been reported previously (11).
Blood Collection and Isolation of Plasma
Whole blood was collected by venipuncture using antiseptic technique with vacutainers containing citrate anticoagulant (Becton–Dickinson laboratories). Samples were centrifuged at 3,000 rpm for 10 minutes, and the plasma was extracted. A protease inhibitor cocktail of 500 μM 4-(2-Aminoethyl)benzenesulfonylfluoride, Hydrochloride (AEBSF–HCl), 150 nM aprotinin, and 1 μM leupeptin hemisulfate was added according to the manufacturer’s recommendations (Calbiochem). To test the stability of the glycoproteome over different processing conditions, plasma was immediately placed on lectin columns, placed on ice for 3 hours before lectin incubation, or stored at −80°C until the time of processing.
Synthesis of Lectin Columns
Plasma was applied to lectin columns for lectin incubation as in Supplementary Figure 1. For each lectin column, a lectin-specific equilibration and elution buffer were used. The ConA equilibration buffer included 10 mM 4-(2-Hydroxyethyl)piperazine-1-ethanesulfonic acid, 0.1 mM CaCl2, 0.1 mM MnCl2, and 0.15 M NaCl at pH 7.5, and the elution buffer included the composition of the equilibration buffer with the addition of 0.5 M alpha methyl mannoside. For Aleuria aurantia lectin, the equilibration buffer included 10 mM 4-(2-Hydroxyethyl)piperazine-1-ethanesulfonic acid and 0.15 M NaCl at pH 7.5, and the elution buffer included the equilibration buffer with 100 mM fucose in 0.1 M phosphate buffer and 0.15 M NaCl at pH 7.1. The Sambucus nigra agglutinin equilibration buffer included 0.1 M sodium phosphate, 0.15 M NaCl, and 0.1 mM CaCl2 at pH 7.5, and the elution buffer included the equilibration buffer plus 0.5 M lactose at pH 3.0. The Jac equilibration buffer included 175 mM Tris, 0.15 M NaCl, and 0.1 mM CaCl2 at pH 7.5, and the elution buffer included the equilibration buffer plus 0.8 M galactose. The WGA equilibration buffer included 10 mM 4-(2-Hydroxyethyl)piperazine-1-ethanesulfonic acid and 0.15 M NaCl at pH 7.5, and the elution buffer included the equilibration buffer plus 0.5 M glucosamine at pH 3.0. All fractions were saved for analysis.
Protein Concentration Determination
After lectin incubation, bound fractions were treated with an equivolume of 20% trichloroacetic acid for 15 minutes on ice to remove buffer salts and centrifuged at 16,000g for 10 minutes at 4°C to pellet protein precipitates. Protein pellets were disrupted in 1 mL of ice-cold ethanol: ethyl acetate (1:1, v/v) and re-pelleted, followed by aspiration of the supernatant. Washed protein pellets were dissolved in 8 M urea, and the protein concentration for each sample was determined using the bicinchoninic acid assay and employed bovine albumin standards.
2-D Polyacrylamide Gel Electrophoresis
Isolated protein, 150 μg, was reconstituted in rehydration buffer containing 8 M urea, 4% (w/v) 3-[(3-Cholamidopropyl)dimethylammonio]-1-propanesulfonate, 3 mL of ampholytes (Bio-Rad; pH 3–10), and 4 mL of destreak reagent (GE Healthcare), and the final volume of 300 μL is made using 8 M urea. The samples were then used to rehydrate 11-cm immobilized pH gradient strips (Bio-Rad) with a pH 3–10 linear gradient. The strips were passively rehydrated for 12 hours without current in a Protean isoelectric focusing cell (Bio-Rad). First dimension isoelectric focusing was carried out at 20°C in a Protean isoelectric focusing cell by the following protocol: 250 V for 20 minutes linear, 8,000-V linear ramping to over 3 hours, and instantaneously 8,000 V until approximately 32 kVh was reached. After isoelectric focusing, strips were equilibrated by agitating for 15 minutes in 50 mM of Tris–HCl, pH 8.8, 6 M urea, 30% (v/v) glycerol, 2% (w/v) sodium dodecyl sulfate, and 1% (w/v) Dithiothreitol and then agitating for 15 minutes in 50 mM of Tris–HCl, pH 8.8, 6 M urea, 30% (v/v) glycerol, 2% (w/v) sodium dodecyl sulfate, and 2.5% (w/v) iodoacetamide. Strips were removed and stored at −80°C until run on the second dimension. For separation in the second dimension, the equilibrated immobilized pH gradient strips were slightly rinsed with running buffer containing 25 mM Tris, 192 mM glycine, and 0.1% (w/v) sodium dodecyl sulfate; blotted to remove excess equilibration buffer; and then applied to 11% sodium dodecyl sulfate–polyacrylamide gel electrophoresis gels using a Criterion Dodeca system (Bio-Rad) at 4°C at constant 150 V in a running buffer until the dye front had run off the edge of the 2-D gel. The gels were fixed in 10% methanol and 7% acetic acid for half an hour and stained overnight with Sypro ruby protein gel stain. The stained gels were washed three times with Milli-Q water each for 30 minutes. Gels were imaged using the Typhoon 9410 variable mode imager, which provided 16-bit gray-scale images. Gel images were quantitated using PDQuest 2-D Advanced software (Bio-Rad), and spots for identification were excised using the ExQuest spot cutter (Bio-Rad) based on a criteria of twofold change in normalized intensity from controls (ie, nonfrail older adults).
Peptide N-G Glycosidase F Digestion
Proteins from denatured bound fractions were incubated with proteomics grade peptide N-G glycosidase F at 37°C for 1 hour to deglycosylate N-linked glycoproteins, following the recommended instructions from the supplier (Sigma-Aldrich). This methodology was applied to a single bound fraction with or without peptide N-G glycosidase F digestion followed by focusing the glycoproteins by 2-D gel electrophoresis. In order to observe predicted changes in an overlay gel, spots in the image of the undigested sample were artificially colored red, but the peptide N-G glycosidase F–digested sample was colored yellow.
Mass Spectrometry
After trypsin digestion of proteins, an equivolume of 0.1% trifluoroacetic acid and 50% acetonitrile was added to the tryptic digest. Three microliters of this mixture was spotted on a matrix-assisted laser desorption ionization (MALDI) target with 0.5 μL of α-cyano-4-hydroxycinnamic acid on the top surface of the spot. The mass spectra of the digest were collected using an Applied Biosystems VoyagerDE STR MALDI time of flight (MALDI-TOF) mass spectrometer. The generated mass spectra were processed using Data Explorer 4.0.0.0 (Applied Biosystems) and the following default settings for peak smoothing to create the peak list: smoothing, signal/noise, Corr, and advanced baseline correction. Advanced baseline correction settings were as follows: peak width of 32, flexibility of 0.5, degree of 0.1, noise filter of 0.7, smoothing of 5, and noise reduction of 2.00. Protein identifications were determined by MASCOT database searching at 150 ppm with variable modifications of methionine oxidation and carbamidomethyl. Spots that could not be identified by MALDI-TOF were identified by electrospray tandem mass spectrometry (ThermoFinnigan LTQ ion trap mass spectrometer). The uninterpreted tandem mass spectrometry spectra were searched using MASCOT and X! Tandem against the NCBInr_20080310 database. Trypsin was specified as the proteolytic precursor, and up to two missed cleavages were allowed. A fragment ion mass tolerance of 0.8 Da and a parent ion tolerance of 1.5 Da were specified for both search engines. Variable modifications specified were oxidation of methionine, N-formylation of the amino terminus, and iodoacetic acid derivative of cysteine. Cross-correlation of the MASCOT results with X! Tandem and determination of protein identity probabilities were accomplished with Scaffold, Version 2 (Proteome Software).
Comparative Analysis
Relative spot intensities by comparison group were estimated using PDQuest Advanced software, Version 8.0 (Bio-Rad); those showing ≥twofold difference by group (prefrail vs nonfrail) were identified using MALDI-TOF.
Enzyme-Linked Immunosorbent Assay
ELISA was performed to measure the plasma concentration of transferrin in 73 older subjects using materials and methods provided by a commercially available kit (GenWay Biotech, Inc.). Difference in mean transferrin concentration by group (nonfrail, prefrail, and frail) was examined using one-way analysis of variance using STATA Version 10.1.
RESULTS
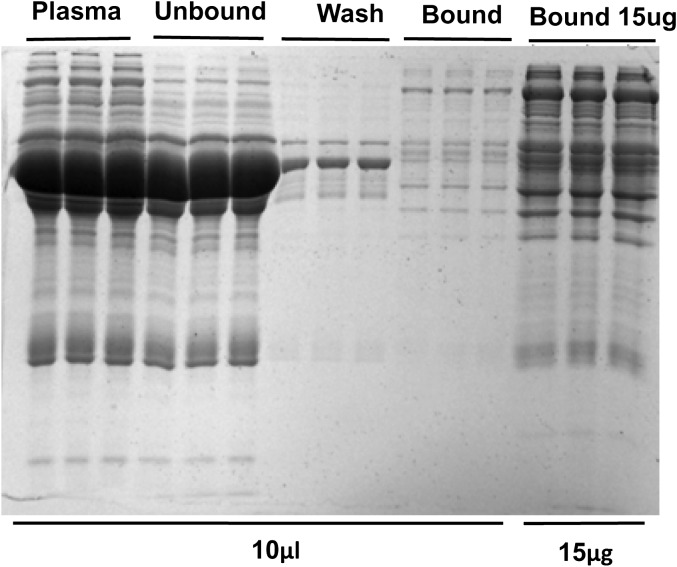
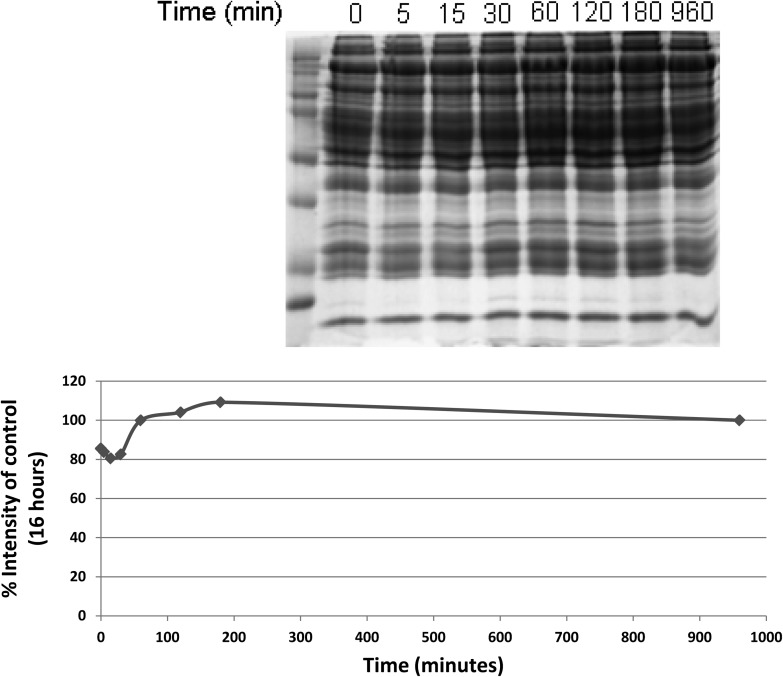
To define the characteristics of the lectin affinity column, ConA was used to isolate glycoproteins in one individual human sample isolated with three different columns, as described above. As shown in Figure 1, the fraction of proteins that bind to ConA represents a small fraction of the overall protein, and the pattern of proteins among replicates is similar. Sample incubation with ConA for 2–3 hours at 4°C gives optimum binding of glycoproteins, which was not increased with longer incubation times (shown in Figure 2). Furthermore, saturation of the lectin with a large volume of plasma may lead to reduced diversity in the number of proteins bound to the lectin due to competition among glycoproteins for available lectin-binding sites. A ratio of 0.5:1 or less (sample:column) recovered significantly more protein, which bounds to the lectin (p < .01) than a ratio of 1:1 or greater (shown in Supplementary Figure 2). We chose to use a sample:column ratio of 0.5:1 in subsequent analyses because this ratio resulted in the highest amount of bound protein as well as sufficient protein material to use in subsequent 2-D gel analyses.
Figure 1.
After plasma was treated with concanavalin A (ConA) lectin, sodium dodecyl sulfate–polyacrylamide 1-dimensional gel electrophoresis was performed. The gel was loaded with 0.5 μL of untreated plasma diluted in ConA buffer, the unbound fraction, the wash, which was retained for this analysis, and the bound fractions. Lanes were loaded in equivolume amounts (10 μL) or on the basis of equal protein (15 μg per lane), as labeled. Gels were then stained with Coomassie blue.
Figure 2.
Sodium dodecyl sulfate (SDS)–polyacrylamide 1-dimensional gel electrophoresis performed after incubating obtained after plasma was allowed to incubate on concanavalin A lectin columns for varying amount of times, in minutes, as shown. After separating an equal volume of bound fraction by SDS gel electrophoresis, the total amount of protein in each lane was determined by calculating the lane intensity after staining with Coomassie blue and plotted. The percent intensity of the control condition (overnight incubation, or 16 hours) is plotted for each time condition.
One of the problems of fractionation procedures is that they introduce another element of variability into the assay. Therefore, we determined the amount of variability in the types and amount of proteins bound to ConA affinity column by comparing the protein profiles obtained on 1-D polyacrylamide gel electrophoresis by examining eight replicates of one sample (Supplementary Figure 3). We found that the individual bands showed coefficients of variation ranging from 3.4% to 13.76%, and the global coefficient of variation was 6.12%, acceptable for use with clinical samples.
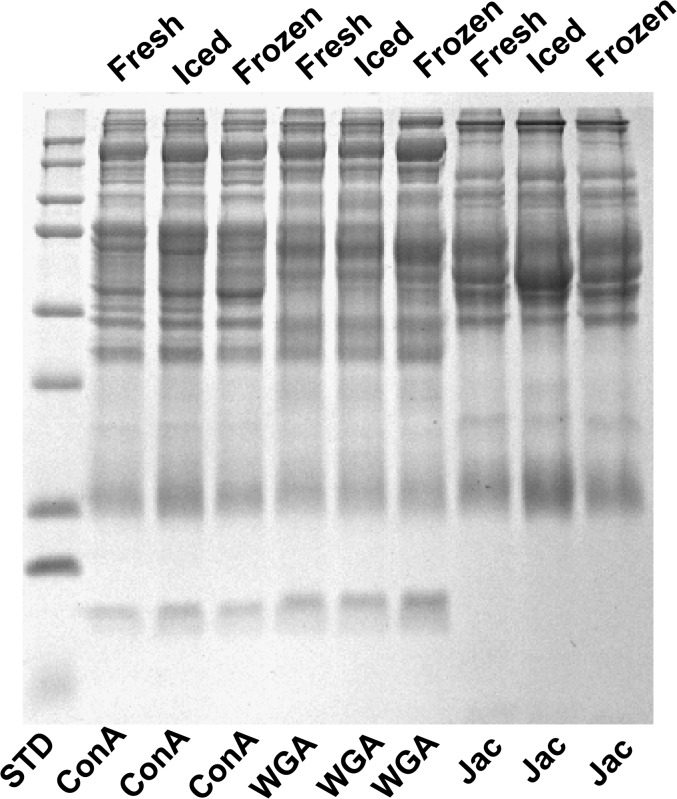
Because samples obtained from clinical studies are often stored for several months to years and because few studies of lectin affinity chromatography have examined human serum or plasma stored for undefined times, we determined the effect of storage on the glycoproteins obtained after lectin affinity. The gels in Figure 3 show that the glycoprotein profiles were similar for glycoproteins isolated from fresh plasma compared with plasma stored on ice for 3 hours or frozen and stored at −80°C for 30 days before analysis, and the proportion of total bound protein isolated by the three treatments was similar (Supplementary Figure 4).
Figure 3.
(A) Lectin incubation was performed on fresh plasma (within 10 minutes of draw), iced plasma (plasma isolated from whole blood left on ice for 2 hours prior to centrifugation), and frozen plasma (whole blood centrifuged within 2 hours and plasma stored at −80°C for 30 days). Analyses were performed using concanavalin A (ConA), wheat germ agglutinin (WGA), and Jacalin (Jac) lectins.
In order to demonstrate that the majority of proteins isolated using ConA lectin consists of N-linked glycoproteins, we treated a single bound fraction with or without peptide N-G glycosidase F prior to focusing the glycoproteins by 2-D gel electrophoresis. As shown in Supplementary Figure 5, most proteins show a decrease in molecular weight and an increase in isoelectric point, as predicted by the removal of N-linked sugars and negatively charged sialic acid, respectively.
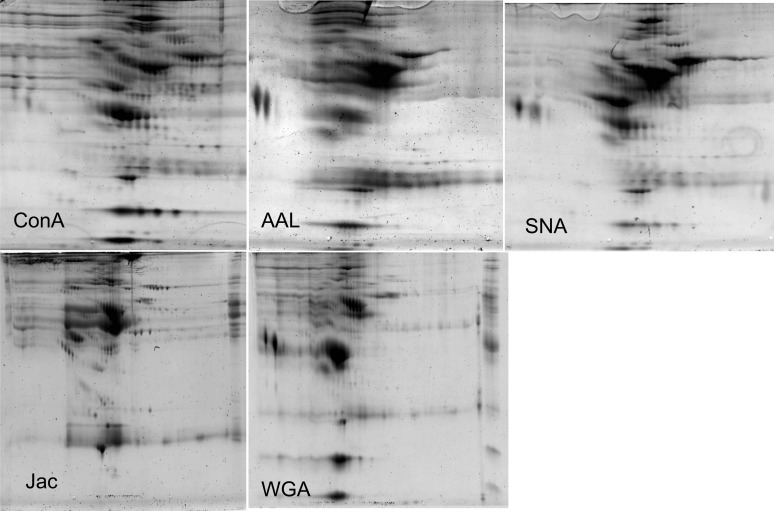
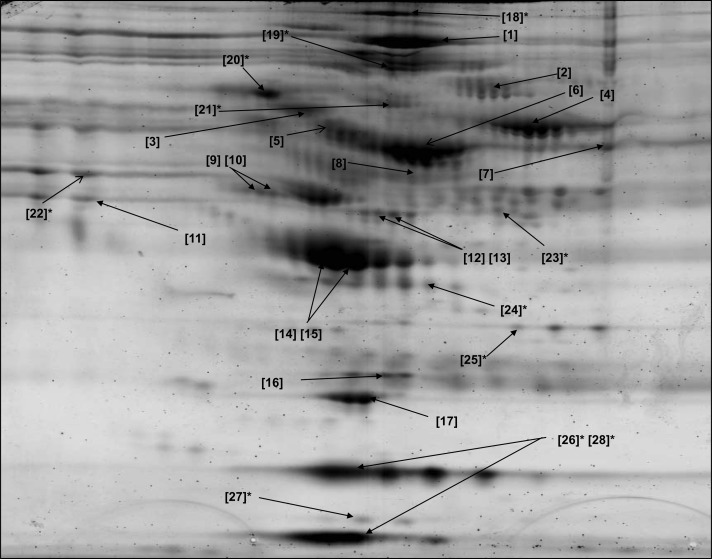
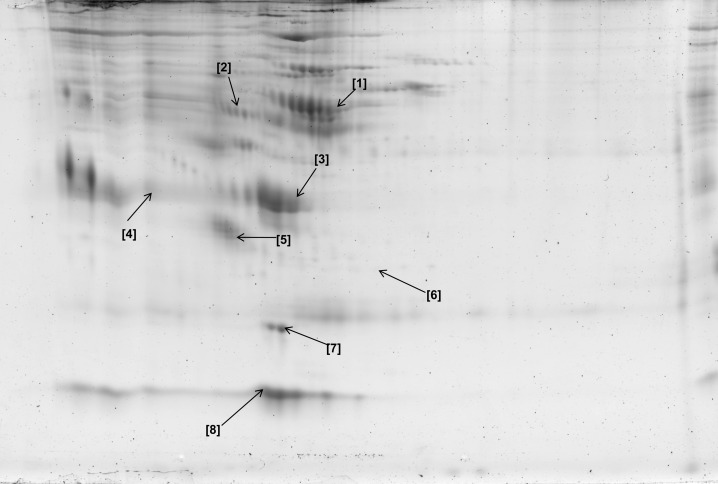
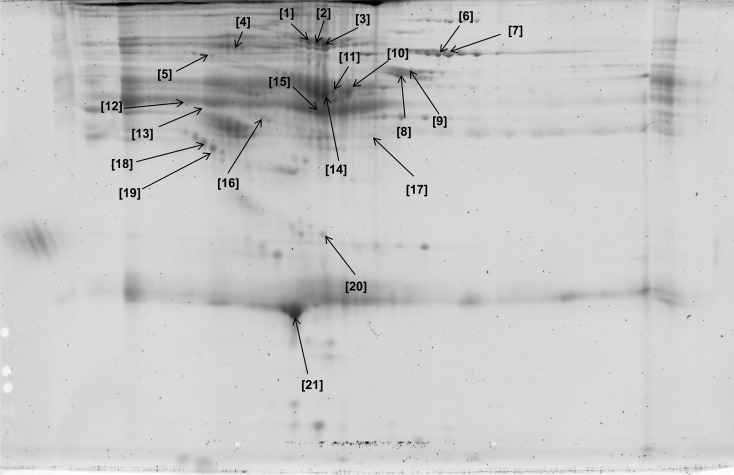
2-D gels of glycoproteins fractionated with five lectins with differing specificities (ConA:α-linked mannose, Aleuria aurantia lectin:fucose, Sambucus nigra agglutinin:sialic acid, Jac:O-linked N-acetyl galactosamine, and WGA:N-acetyl glucosamine) are shown in Figure 4, and the lectins appear to have differential selectivity for different glycoproteins across the gels. ConA and WGA have been shown in previous work to be capable of isolating the most glycoproteins from a blood sample (12), and our findings support this observation; however, we also show that these two lectins result in slightly different patterns of glycoproteins. Of the other lectins, Jac seemed to isolate the most glycoproteins that were not isolated with ConA. Based on these five gels, we determined that using ConA, WGA, and Jac to isolate glycoproteins from plasma provides a broad spectrum of glycoproteins for analysis. In Figures 5, 6, and 7, we define the 2-D gel maps of the glycoproteins isolated using ConA, WGA, and Jac, and Tables 1–4 provide the identities of the glycoproteins isolated. As can be seen from Figure 5, Con A gave the largest number of glycoproteins and their isoforms.
Figure 4.
Two-dimensional gel images of plasma glycoproteins isolated after incubation on five different lectin affinity columns: concanavalin A (ConA), Aleuria aurantia lectins (AAL), Sambucus nigra lectin (SNA), Jacalin (Jac), and wheat germ agglutinin (WGA).
Figure 5.
Two-dimensional gel map of plasma glycoproteins isolated after incubation with concanavalin A lectin. Glycoproteins were identified by matrix-assisted laser desorption ionizing time of flight (MALDI-TOF) or electrospray tandem mass spectrometry (marked with an asterisk). Identities of all glycoproteins are shown in Table 1 (for glycoproteins identified with MALDI-TOF) and Table 2 (for glycoproteins identified by electrospray).
Figure 6.
Two-dimensional gel map of plasma glycoproteins isolated after incubation with wheat germ agglutinin lectin. Identities of all glycoproteins are shown in Table 3.
Figure 7.
Two-dimensional gel map of plasma glycoproteins isolated after incubation with Jacalin lectin. Identities of all glycoproteins are shown in Table 4.
Table 1.
Glycoproteins Identified From Concanavalin A–Treated Plasma Using Matrix-Assisted Laser Desorption Ionizing Time of Flight Mass Spectrometry
| Spot | Protein Name | Accession Number | Molecular Weight (Da) | Change in Prefrail* | Peptides Searched | Peptides Matched | Percent Coverage | Mowse Score |
| 1 | Complement factor H | P08603 | 139,019 | — | 36 | 20 | 17 | 98 |
| 2 | Complement factor B | P00751 | 85,479 | — | 19 | 9 | 11 | 68 |
| 3 | Thrombin | P00734 | 69,209 | — | 32 | 13 | 20 | 90 |
| 4 | Transferrin | P02787 | 77,050 | ↑ | 19 | 10 | 18 | 75 |
| 5 | Alpha-1-b-glycoprotein | P04217 | 51,908 | — | 36 | 12 | 27 | 94 |
| 6 | Hemopexin | P02790 | 51,643 | — | 25 | 15 | 35 | 152 |
| 7 | Complement component C3 | P01024 | 71,146 | — | 26 | 19 | 36 | 205 |
| 8 | Serum albumin | P02768 | 69,349 | — | 36 | 21 | 34 | 148 |
| 9 | Olfactomedin-like 3 | Q9NRN5 | 46,101 | — | 18 | 7 | 18 | 56 |
| 10 | Olfactomedin-like 3 | Q9NRN5 | 46,101 | — | 16 | 7 | 22 | 67 |
| 11 | Alpha-1 antitrypsin | P01009 | 46,678 | — | 27 | 10 | 30 | 89 |
| 12 | Chain C fibrinogen gamma | P02679 | 51,512 | — | 10 | 5 | 17 | 60 |
| 13 | Chain C fibrinogen gamma fragment D | P02679 | 36,157 | — | 11 | 7 | 24 | 92 |
| 14 | Haptoglobin | P00738 | 45,205 | — | 8 | 5 | 16 | 69 |
| 15 | Haptoglobin | P00738 | 45,205 | — | 20 | 8 | 31 | 75 |
| 16 | Serum amyloid | P02743 | 23,244 | — | 20 | 7 | 29 | 82 |
| 17 | Apolipoprotein A1 | P02647 | 28,061 | — | 50 | 19 | 61 | 189 |
Notes: *Up arrow (↑) indicates glycoprotein was increased and down arrow (↓) indicates glycoprotein was decreased in prefrail compared with nonfrail older adults. Dash (—) indicates no change.
Table 2.
Glycoproteins Identified From Concanavalin A–Treated Plasma Using Electrospray Tandem Mass Spectrometry
| Spot | Protein Name | Accession/gi Number | Molecular Weight (Da) | Change in Prefrail* | Unique Peptides | Total Spectra | Coverage (%) | Unique spectra |
| 18 | Alpha-2-macroglobulin | P01023/gi|112911 | 163,300.90 | — | 18 | 37 | 15.9 | 22 |
| Fibronectin 1 | AAI17177/gi|GI109658664 | 259,066.30 | — | 11 | 15 | 6.7 | 11 | |
| 19 | Alpha-2-macroglobulin precursor | NP_000005/gi|66932947 | 164,114.80 | — | 28 | 63 | 22.7 | 34 |
| Inter-alpha-trypsin inhibitor family heavy chain–related protein | AAD05198/gi|4096840 | 103,341.30 | — | 12 | 27 | 15.7 | 15 | |
| Complement component C3 (Homo sapiens) | AAA85332/gi|179665 | 187,147.20 | — | 15 | 20 | 11.7 | 16 | |
| Ceruloplasmin (Homo sapiens) | BAA08084/gi|1620909 | 122,156.60 | — | 9 | 12 | 12.3 | 9 | |
| Complement factor H | P08603/gi|158517847 | 139,078.20 | — | 4 | 6 | 3.74 | 4 | |
| Inter-alpha (globulin) inhibitor H3 variant (Homo sapiens) | BAD96477/gi|62897073 | 75,061.90 | — | 3 | 3 | 4.18 | 3 | |
| 20 | Similar to complement subcomponent C1s precursor | XP_001163713/gi|114643130 | 76,666.20 | — | 6 | 15 | 9.59 | 7 |
| Plasma protease (C1) inhibitor precursor | AAA35613/gi|179619 | 58,035.20 | — | 6 | 14 | 12.6 | 7 | |
| Serum albumin | CAA23754/gi|28590 | 69,277.90 | — | 6 | 11 | 9.85 | 6 | |
| Afamin precursor | NP_001124/gi|4501987 | 69,096.80 | — | 6 | 10 | 8.68 | 6 | |
| 21 | Complement C1r subcomponent | P00736/gi|115204 | 80,182.00 | — | 7 | 21 | 10.5 | 9 |
| Plasma protease (C1) inhibitor precursor | AAB59387/gi|179621 | 58,035.20 | — | 7 | 13 | 14.2 | 10 | |
| Alpha-2-macroglobulin | P01023/gi|112911 | 164,114.80 | — | 8 | 10 | 5.74 | 8 | |
| Unnamed protein product (Homo sapiens) (NCBI)/serum albumin (UNIPROT) | CAA23753/gi|28590 P02768/gi|28590 | 69,277.90 | — | 2 | 2 | 3.12 | 2 | |
| 22 | Beta-2-glycoprotein I apolipoprotein H (Homo sapiens) | CAA41113/gi|28810 | 38,249.30 | — | 3 | 7 | 11.6 | 4 |
| Alpha-2-macroglobulin | P01023/gi|112911 | 163,300.90 | — | 5 | 7 | 3.7 | 5 | |
| Hemopexin precursor | NP_000604/gi|11321561 | 51,596.60 | — | 3 | 5 | 4.8 | 3 | |
| Alpha-1 antitrypsin variant | ABG73380/gi|110350939 | 46,705.90 | — | 4 | 4 | 8.4 | 4 | |
| Fibrinogen gamma chain | AAB59531/gi|182439 | 49,593.30 | — | 3 | 4 | 10.3 | 3 | |
| Complement factor I preproprotein | NP_000195/gi|1335054 | 63,438.70 | — | 2 | 4 | 4.8 | 2 | |
| Fibrin beta | 0401173A/gi|223002 | 58,245.10 | — | 3 | 3 | 10.4 | 3 | |
| IGHG2 protein | AAH62335/gi|38382776 | 51,305.90 | — | 2 | 3 | 5.6 | 2 | |
| 23 | Fibrinogen gamma chain | AAB59531/gi|182439 | 47,357.30 | — | 8 | 15 | 22.1 | 8 |
| Hemopexin precursor | NP_000604/gi|11321561 | 50,145.70 | — | 2 | 4 | 4.9 | 2 | |
| 24 | Haptoglobin isoform 1 preproprotein (Homo sapiens) | NP_005134/gi|4826762 | 46,704.70 | — | 7 | 12 | 16.9 | 7 |
| 25 | Complement component C4A (Homo sapiens) | AAA51855/gi|179674 | 192,731.80 | — | 2 | 3 | 0.917 | 2 |
| 26 | Haptoglobin isoform 1 preproprotein (Homo sapiens) | NP_005134/gi|4826762 | 46,704.70 | — | 6 | 178 | 11.2 | 9 |
| Immunoglobulin J chain isoform 5 (Pan troglodytes) | XP_517248/gi|55622594 | 19,653.30 | — | 3 | 11 | 17.1 | 3 | |
| 27 | Immunoglobulin light chain (Homo sapiens) | BAF64541/gi|149673887 | 23,290.00 | — | 4 | 20 | 32.6 | 6 |
| Haptoglobin, isoform CRA_a (Homo sapiens) | EAW59194/gi|119579598 | 46,704.70 | — | 2 | 10 | 6.19 | 2 | |
| 28 | Haptoglobin, isoform CRA_a (Homo sapiens) | EAW59194/gi|119579598 | 45,186.90 | ↑ | 3 | 16 | 6.9 | 3 |
Notes: *Up arrow (↑) indicates glycoprotein was increased and down arrow (↓) indicates glycoprotein was decreased in prefrail compared with nonfrail older adults. Dash (—) indicates no change. NCBI = National Center for Biotechnology Information; UNIPROT =Universal Protein Resource.
Table 3.
Glycoproteins Identified From Wheat Germ Agglutinin–Treated Plasma Using Matrix-Assisted Laser Desorption Ionizing Time of Flight Mass Spectrometry
| Spot | Protein | Accession Number | Molecular Weight (Da) | Change in Prefrail | Peptides Searched | Peptides Matched | Percent Coverage | Mowse Score |
| 1 | Serum albumin | P02768 | 69,039 | — | 49 | 16 | 24 | 73 |
| 2 | Histidine-rich glycoprotein precursor | P00450 | 59,541 | — | 12 | 9 | 21 | 115 |
| 3 | HP protein | Q0VAC5 | 31,362 | — | 25 | 11 | 42 | 131 |
| 4 | Leucine-rich alpha-2-glycoprotein | P02750 | 36,471 | — | 10 | 6 | 18 | 77 |
| 5 | Apolipoprotein J | Q8IWM0 | 48,772 | — | 26 | 15 | 33 | 144 |
| 6 | Hemopexin | P02790 | 51,643 | — | 22 | 15 | 38 | 177 |
| 7 | Apolipoprotein A1 | P02647 | 28,061 | — | 24 | 15 | 53 | 194 |
| 8 | Haptoglobin | P00738 | 38,983 | — | 14 | 6 | 9 | 67 |
Notes: *Up arrow (↑) indicates glycoprotein was increased and down arrow (↓) indicates glycoprotein was decreased in prefrail compared with nonfrail older adults. Dash (—) indicates no change.
Table 4.
Glycoproteins Identified From Jacalin (Jac)-Treated Plasma Using Matrix-Assisted Laser Desorption Ionizing Time of Flight Mass Spectrometry
| Spot | Protein | Accession Number | Molecular Weight (Da) | Change in Prefrail* | Peptides Searched | Peptides Matched | Percent Coverage | Mowse Score |
| 1 | Hemopexin | P02790 | 51,643 | — | 15 | 11 | 25 | 109 |
| 2 | Hemopexin | P02790 | 51,643 | — | 22 | 16 | 38 | 193 |
| 3 | Hemopexin | P02790 | 51,643 | — | 24 | 15 | 36 | 155 |
| 4 | Hemopexin | P02790 | 51,643 | — | 41 | 19 | 34 | 109 |
| 5 | Nebulin-related anchoring protein | Q86VF7 | 96,730 | — | 21 | 12 | 11 | 75 |
| 6 | Plasminogen | P00747 | 90,510 | — | 29 | 15 | 18 | 105 |
| 7 | Plasminogen | P00747 | 90,510 | — | 25 | 13 | 15 | 90 |
| 8 | Transferrin | Q06AH7 | 76,910 | — | 13 | 10 | 14 | 105 |
| 9 | Transferrin | Q06AH7 | 76,910 | ↑ | 64 | 17 | 27 | 68 |
| 10 | Hemopexin | P02790 | 51,643 | ↓ | 41 | 15 | 35 | 113 |
| 11 | Hemopexin | P02790 | 51,643 | — | 37 | 12 | 29 | 91 |
| 12 | Kininogen-1 variant | P01042 | 47,823 | ↓ | 40 | 13 | 28 | 90 |
| 13 | Kininogen-1 variant | P01042 | 47,823 | ↑ | 35 | 12 | 26 | 88 |
| 14 | Leucine-rich alpha-2-glycoprotein 1 | P02750 | 36,471 | ↓ | 76 | 13 | 33 | 72 |
| 15 | Hemopexin | P02790 | 49,264 | — | 38 | 11 | 25 | 76 |
| 16 | Chain A, alpha-1 antitrypsin | P01009 | 44,223 | — | 63 | 13 | 37 | 90 |
| 17 | Fibrinogen gamma chain, isoform CRA_O | P02679 | 47,344 | ↓ | 62 | 12 | 29 | 70 |
| 18 | Leucine-rich alpha-2-glycoprotein 1 | P02750 | 36,471 | — | 10 | 7 | 16 | 96 |
| 19 | Leucine-rich alpha-2-glycoprotein 1 | P02750 | 36,471 | — | 38 | 13 | 33 | 110 |
| 20 | Apolipoprotein E | P02649 | 36,185 | ↓ | 18 | 9 | 28 | 98 |
| 21 | Apolipoprotein A1 | P02647 | 28,061 | — | 42 | 20 | 75 | 200 |
Notes: *Up arrow (↑) indicates glycoprotein was increased and down arrow (↓) indicates glycoprotein was decreased in prefrail compared with nonfrail older adults. Dash (—) indicates no change.
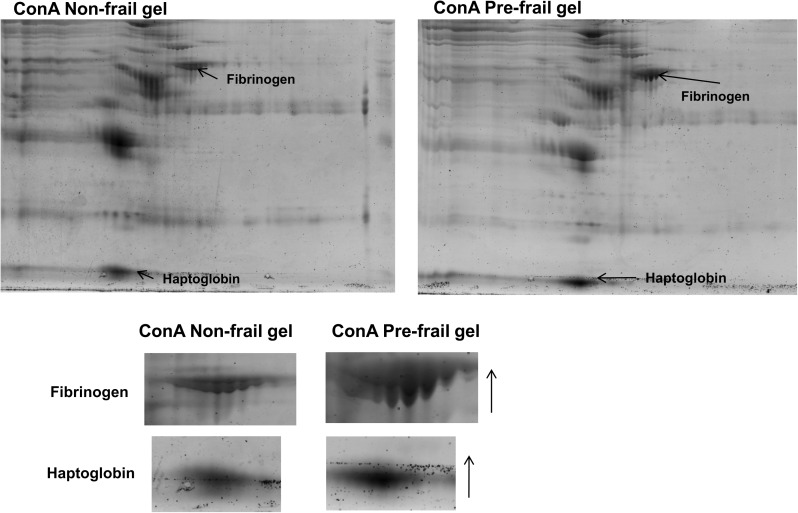
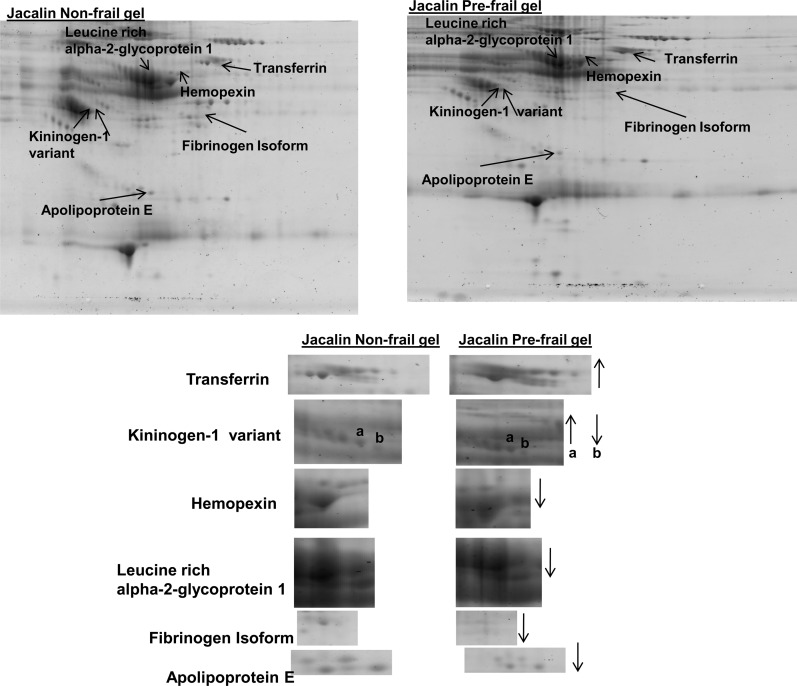
To determine the ability of our lectin-based system to analyze proteins from different human populations, we conducted a preliminary study, in which we compared the glycoprotein profiles obtained from four nonfrail versus four prefrail older adults, using ConA, WGA, and Jac. We found that three glycoproteins or their isoelectric isoforms showed over a twofold increase in spot intensity in prefrail compared with nonfrail individuals: haptoglobin, transferrin, and an isoform of kininogen-1 variant. We also found four glycoproteins to show a twofold or greater decrease in prefrail individuals: kininogen-1 variant isoform, a hemopexin precursor, isoform of fibrinogen, leucine-rich alpha-2-glycoprotein 1, and apolipoprotein E. Representative gels from prefrail and nonfrail samples are shown in Figures 8 and 9. Using ELISA, we measured transferrin levels in the plasma of a larger group (n = 73) of older adult individuals recruited from the same retirement community. Plasma transferrin (nanograms per milliliter) was significantly increased in prefrail and frail individuals compared with nonfrail individuals (nonfrail: 43.4 ± 11.4, prefrail: 54.3 ± 11.9, frail: 58.3 ± 10.2, p < .001), confirming our findings from the comparative proteomic analysis study.
Figure 8.
Representative concanavalin A (ConA) gels from nonfrail and prefrail older adults from comparative analysis study showing the two glycoproteins (fibrinogen and haptoglobin) found to be increased at least twofold in prefrail compared with nonfrail older adults in this population sample.
Figure 9.
Representative Jacalin gel from nonfrail and prefrail older adults from comparative analysis study showing the glycoproteins found to be increased (transferrin and kininogen-1 variant isoform) and decreased (hemopexin, leucine-rich alpha-2-glycoprotein 1, fibrinogen, apolipoprotein E, and kininogen-1 variant isoform) at least twofold in prefrail compared with nonfrail older adults in this population sample.
DISCUSSION
The goal of this study was to demonstrate the use of a reliable and replicable methodology for the study of the circulating proteome in human plasma in older adults, which can be used to identify potential biomarkers for the geriatric syndrome of frailty. The glycoproteins that were found to differ by frailty status are related to inflammation and the hematologic system and consistent with prior studies demonstrating that frailty is associated with changes in inflammatory and hematologic serum markers (4,9,13). Haptoglobin, a secreted glycoprotein produced primarily in the liver and binds oxidatively active heme released from erythrocytes, is known to increase with physiological stress and inflammation and is also a known antioxidant (14). It was elevated in the prefrail individuals, which is consistent with prior studies showing that frail, disabled older adults have increased circulating levels of interleukin-6 and C-reactive protein (2), as well as evidence of oxidative stress (15). Interestingly, haptoglobin was also recently associated with aging in both humans and animal models and was identified using similar high-throughput 2-D gel proteomics methodology (16,17). Hemopexin is also a heme-binding glycoprotein that, similar to haptoglobin, mediates hemoglobin-mediated oxidative damage and has been thought to possibly play a role in neurodegenerative diseases and aging (18). Transferrin, a major plasma glycoprotein which binds and transports ferric iron, was increased in our prefrail population and has been shown to increase with aging (19). Interestingly, two different isoforms of kininogen-1 variant, a secretory glycoprotein and acute-phase reactant (20), were found to be one increased and one decreased in the prefrail older adults. This could have been caused by the migration of one acidic kininogen spot to a more basic location on the gel. One possibility for this is this protein becoming more desialated and therefore more basic; however, this was not formally tested. Glycoproteins often exist in several glycosylated variants or glycoforms and alterations in the glycoforms present can possibly contribute to pathogenesis of disease and potentially provide diagnostic biomarkers (21). The identification of this protein is interesting, given that the kininogen proteins are involved in coagulation response (20,22), which has been shown in several prior studies to be altered in frailty (2,23), We found significant difference in apolipoprotein E in prefrail, which has been frequently implicated in cognitive impairment (24), a condition which has been thought to be a potential mediator of frailty (25). Rigorous assessment for cognitive impairment in these independently living community-dwelling older adults was not completed in this study; however, all subjects were screened using the Mini Mental State Examination, and none met criteria for possible dementia (26). Nevertheless, this intriguing finding may suggest that early cognitive impairment is associated with the development of frailty as prior studies have suggested (25). Lastly, leucine-rich alpha-2-glycoprotein 1 is a plasma glycoprotein of unknown function that has been associated with infection, malignancy, and with the inflammatory response in general (27).
Although research investigating the biological basis of frailty is in its infancy (4,9), there has been significant interest in identifying biomarkers for frailty, with the ultimate goal of early identification of at-risk older adults. Recently, Reiner et al. (23) studied whether the serum levels of six potential plasma biomarkers were predictive of incident frailty in the Women’s Health Initiative study. They found that plasma levels of D-dimer and tissue plasminogen activator were predictive of becoming frail over a 3-year follow-up period. In a similar study, interleukin-6 and D-dimer levels were found to be predictive of two frailty-related outcomes, functional decline and mortality (28). Interestingly, both studies found that a combination of the two biomarkers was more predictive than either one considered alone. These studies used clinical laboratory measurement (typically ELISA) of proteins that were obtained at the study baseline examinations and not a high-throughput approach as we have described in this study. We have built upon these findings by utilizing proteomics methodology to screen plasma simultaneously for 100s of proteins allowing the discovery of potential biomarkers that could not have been hypothesized a priori to play a role in frailty. Although there have been prior studies using genomics, metabolomics, and proteomics to understand aging in general (17,29,30), to our knowledge this is the first application of high-throughput proteomics methodology to study the geriatric syndrome of frailty. Our findings are also novel in that differences in the glycoproteome were found in prefrail individuals before the onset of clinically recognizable frailty (3). Larger studies must be conducted to confirm these findings and to determine if these or other discovered plasma biomarkers could identify older adults at risk for frailty and its associated poor outcomes, including disability, institutionalization, and death.
This work also illustrates which plasma glycoproteins are available for study using clinical peripheral blood samples and this lectin affinity technique and demonstrates reproducible methodology for the isolation of glycoproteins in real-time from clinical research subjects. We found that the combination of using ConA, WGA, and Jac was sufficient to isolate the majority of the plasma glycoproteome. Our results support the study design of Yang and Hancock (31) who decided a priori upon the use of ConA, WGA, and Jac in a multilectin affinity column experimental design to isolate glycoproteins from serum, based on knowledge of the common N- and O-linked glycan structures present in serum proteins. Furthermore, the glycoproteins isolated using ConA are similar to those identified in previous reports (32), and considering all glycoproteins identified using these three lectins together, our findings are similar to those identified by Yang et al. using a multiaffinity approach with these lectins using reference standard plasma samples or commercially available human serum (31,33).
One of the most common protein fractionation methods is gel electrophoresis. The disadvantage of gel electrophoresis is that it is relatively more time consuming in comparison to technologies, which have more recently become available for liquid fractionation of proteins. For this reason, a limitation of our study is that it may be difficult to apply this methodology to a very large subject population (ie, 100s of subjects). We recognize that the use of targeted mass spectrometry can be more sensitive and time efficient (34,35); however, this technology is not yet widely available and is more costly. We suggest that the method described in this study could be used to study smaller sample populations and/or to gather pilot information in order to design future studies using less widely available technologies. Another potential pitfall of this methodology is related to the identification of plasma glycoproteins using MALDI-TOF. Because the attached sugar moieties can be bulky leading to incomplete trypsination, it can be difficult to identify glycoproteins using MALDI-TOF. For this reason, a minimum number of glycoproteins in this study were identified using tandem mass spectrometry.
In summary, this pilot study supports the hypothesis that frailty is marked by physiological changes in multiple systems, possibly the result of decreased effectiveness of feedback mechanisms in frail older adults (4,9,36), and that decline in multiple physiological systems leads to the clinically recognizable syndrome of weight loss, weakness, and slowness that has become known as frailty (3). The findings from this pilot study show novel glycoproteins that are associated with prefrailty. In the future, interventions to prevent or ameliorate frailty are likely to be developed. We propose that this methodology may be useful for the identification of older adults at risk for frailty and help to identify a target population most amenable to future frailty interventions.
FUNDING
This work was supported by Veterans Affairs Research & Development (VISN 17 New Investigator Award, #10N17), the San Antonio Area Foundation, the Biomedical Research Foundation of South Texas, The University Research Council of the University of Texas Health Science Center at San Antonio, and The Clinical and Translational Science Award (KL2 RR025766) from the National Center for Research Resources.
CONFLICT OF INTEREST
The content is solely the responsibility of the authors and does not necessarily represent the official views of the National Center for Research Resources of the National Institutes of Health. The views expressed in this article are those of the authors and do not necessarily reflect the position or policy of the Department of Veterans Affairs or the U.S. Government. This material is the result of work supported with resources and the use of facilities at the Audie Murphy VA Medical Center, San Antonio, TX.
SUPPLEMENTARY MATERIAL
Supplementary material can be found at: http://biomedgerontology.oxfordjournals.org/.
References
- 1.Fried LP, Walston J. Frailty and failure to thrive. In: Hazzard WR, Blass JP, Ettinger WH Jr, Halter JB, Ouslander J, editors. Principles of Geriatric Medicine and Gerontology. 4th ed. New York, NY: McGraw Hill Publisher; 1998. pp. 1387–1402. [Google Scholar]
- 2.Walston J, McBurnie MA, Newman A, et al. Frailty and activation of the inflammation and coagulation systems with and without clinical comorbidities: results from the Cardiovascular Health Study. Arch Intern Med. 2002;162(20):2333–2341. doi: 10.1001/archinte.162.20.2333. [DOI] [PubMed] [Google Scholar]
- 3.Fried LP, Tangen CM, Walston J, et al. Frailty in older adults: evidence for a phenotype. J Gerontol A Biol Sci Med Sci. 2001;56(3):M146–M156. doi: 10.1093/gerona/56.3.m146. [DOI] [PubMed] [Google Scholar]
- 4.Walston J, Hadley EC, Ferrucci L, et al. Research agenda for frailty in older adults: toward a better understanding of physiology and etiology: summary from the American Geriatrics Society/National Institute on Aging Research Conference on Frailty in Older Adults. J Am Geriatr Soc. 2006;54(6):991–1001. doi: 10.1111/j.1532-5415.2006.00745.x. [DOI] [PubMed] [Google Scholar]
- 5.Anderson NL, Anderson NG. The human plasma proteome: history, character, and diagnostic prospects. Mol Cell Proteomics. 2002;1(11):845–867. doi: 10.1074/mcp.r200007-mcp200. [erratum appears in Mol Cell Proteomics. 2003 Jan;2(1):50] [DOI] [PubMed] [Google Scholar]
- 6.Jung K, Cho W, Regnier FE. Glycoproteomics of plasma based on narrow selectivity lectin affinity chromatography. J Proteome Res. 2009;8(2):643–650. doi: 10.1021/pr8007495. [DOI] [PubMed] [Google Scholar]
- 7.Axford J, Kieda C, van Dijk W. Meeting report: glycobiology and medicine. Glycobiology. 2001;11(2):5G–7G. doi: 10.1093/glycob/11.2.5g. [DOI] [PubMed] [Google Scholar]
- 8.Apweiler R, Hermjakob H, Sharon N. On the frequency of protein glycosylation, as deduced from analysis of the SWISS-PROT database. Biochim Biophys Acta. 1999;1473(1):4–8. doi: 10.1016/s0304-4165(99)00165-8. [DOI] [PubMed] [Google Scholar]
- 9.Fedarko NS. The biology of aging and frailty. Clin Geriatr Med. 2011;27:27–37. doi: 10.1016/j.cger.2010.08.006. [DOI] [PMC free article] [PubMed] [Google Scholar]
- 10.Yoshida H. ER stress and diseases. FEBS J. 2007;274(3):630. doi: 10.1111/j.1742-4658.2007.05639.x. [DOI] [PubMed] [Google Scholar]
- 11.Espinoza SE, Hazuda HP. Frailty in older Mexican American and European American adults: is there an ethnic disparity? J Am Geriatr Soc. 2008;56(9):1744–1749. doi: 10.1111/j.1532-5415.2008.01845.x. [DOI] [PubMed] [Google Scholar]
- 12.Qiu R, Regnier FE. Use of multidimensional lectin affinity chromatography in differential glycoproteomics. Anal Chem. 2005;77(9):2802–2809. doi: 10.1021/ac048751x. [DOI] [PubMed] [Google Scholar]
- 13.Kanapuru B, Ershler WB. Inflammation, coagulation, and the pathway to frailty. Am J Med. 2009;122(7):605–613. doi: 10.1016/j.amjmed.2009.01.030. [DOI] [PMC free article] [PubMed] [Google Scholar]
- 14.Quaye IK. Haptoglobin, inflammation and disease. Trans R Soc Trop Med Hyg. 2008;102(8):735–742. doi: 10.1016/j.trstmh.2008.04.010. [DOI] [PubMed] [Google Scholar]
- 15.Howard C, Ferrucci L, Sun K, et al. Oxidative protein damage is associated with poor grip strength among older women living in the community. J Appl Physiol. 2007;103(1):17–20. doi: 10.1152/japplphysiol.00133.2007. [DOI] [PMC free article] [PubMed] [Google Scholar]
- 16.Ding J, Kopchick JJ. Plasma biomarkers of mouse aging. Age(Dordr) 2010;33(3):291–307. doi: 10.1007/s11357-010-9179-z. [DOI] [PMC free article] [PubMed] [Google Scholar]
- 17.Byerley LO, Leamy L, Tam SW, et al. Development of a serum profile for healthy aging. Age(Dordr) 2010;32:497–507. doi: 10.1007/s11357-010-9146-8. [DOI] [PMC free article] [PubMed] [Google Scholar]
- 18.Delanghe JR, Langlois MR. Hemopexin: a review of biological aspects and the role in laboratory medicine. Clin Chim Acta. 2001;312:13–23. doi: 10.1016/s0009-8981(01)00586-1. [DOI] [PubMed] [Google Scholar]
- 19.Yang FM, Friedrichs WE, Buchanan JM, et al. Tissue specific expression of mouse transferrin during development and aging. Mech Ageing Dev. 1990;56(2):187–197. doi: 10.1016/0047-6374(90)90009-5. [DOI] [PubMed] [Google Scholar]
- 20.Müller-Esterl W, Johnson DA, Salvesen G, et al. Human kininogens. In: Di Sabato G, editor. Methods in Enzymology. Linn, MO: Academic Press; 1988. pp. 240–256. [DOI] [PubMed] [Google Scholar]
- 21.Arnold JN, Wormald MR, Sim RB, et al. The impact of glycosylation on the biological function and structure of human immunoglobulins. Annu Rev Immunol. 2007;25:21–50. doi: 10.1146/annurev.immunol.25.022106.141702. [DOI] [PubMed] [Google Scholar]
- 22.Bradford HN, Dela Cadena RA, Kunapuli SP, et al. Human kininogens regulate thrombin binding to platelets through the glycoprotein Ib-IX-V complex. Blood. 1997;90(4):1508–1515. [PubMed] [Google Scholar]
- 23.Reiner AP, Aragaki AK, Gray SL, et al. Inflammation and thrombosis biomarkers and incident frailty in postmenopausal women. Am J Med. 2009;122:947–954. doi: 10.1016/j.amjmed.2009.04.016. [DOI] [PMC free article] [PubMed] [Google Scholar]
- 24.Kim J, Basak JM, Holtzman DM. The role of apolipoprotein E in Alzheimer’s disease. Neuron. 2009;63:287–303. doi: 10.1016/j.neuron.2009.06.026. [DOI] [PMC free article] [PubMed] [Google Scholar]
- 25.Buchman AS, Boyle PA, Wilson RS, et al. Frailty is associated with incident Alzheimer’s disease and cognitive decline in the elderly. Psychosom Med. 2007;69:483–489. doi: 10.1097/psy.0b013e318068de1d. [DOI] [PubMed] [Google Scholar]
- 26.Folstein MF, Folstein SE, McHugh PR. Mini-mental state: a practical method for grading the cognitive state of patients for the clinician. J Psychiatr Res. 1975;12(3):189–198. doi: 10.1016/0022-3956(75)90026-6. [DOI] [PubMed] [Google Scholar]
- 27.Weivoda S, Andersen JD, Skogen A, et al. ELISA for human serum leucine-rich-2-glycoprotein-1 employing cytochrome c as the capturing ligand. J Immunol Methods. 2008;336:22–29. doi: 10.1016/j.jim.2008.03.004. [DOI] [PMC free article] [PubMed] [Google Scholar]
- 28.Cohen HJ, Harris T, Pieper CF. Coagulation and activation of inflammatory pathways in the development of functional decline and mortality in the elderly. Am J Med. 2003;114:180–187. doi: 10.1016/s0002-9343(02)01484-5. [DOI] [PubMed] [Google Scholar]
- 29.Wilcox BJ, Donlon TA, He Q, et al. FOXO3A genotype is strongly associated with human longevity. Proc Natl Acad Sci U S A. 2008;105(37):13987–13992. doi: 10.1073/pnas.0801030105. [DOI] [PMC free article] [PubMed] [Google Scholar]
- 30.Lu YAJ, Wang G, Hao H, et al. Gas chromatography/time-of-flight mass spectrometry based metabonomic approach to differentiating hypertension- and age-related metabolic variation in spontaneously hypertensive rats. Rapid Commun Mass Spectrom. 2008;22:2882–2888. doi: 10.1002/rcm.3670. [DOI] [PubMed] [Google Scholar]
- 31.Yang Z, Hancock WS. Approach to the comprehensive analysis of glycoproteins isolated from human serum using a multi-lectin affinity column. J Chromatogr A. 2004;1053(1–2):79–88. [PubMed] [Google Scholar]
- 32.Drake RR, Schwegler EE, Malik G, et al. Lectin capture strategies combined with mass spectrometry for the discovery of serum glycoprotein biomarkers. Mol Cell Proteomics. 2006;5(10):1957–1967. doi: 10.1074/mcp.M600176-MCP200. [DOI] [PubMed] [Google Scholar]
- 33.Yang Z, Hancock WS, Chew TR, et al. A study of glycoproteins in human serum and plasma reference standards (HUPO) using multilectin affinity chromatography coupled with RPLC-MS/MS. Proteomics. 2005;5(13):3353–3366. doi: 10.1002/pmic.200401190. [DOI] [PubMed] [Google Scholar]
- 34.Surinova S, Schiess R, Huttenhain R, et al. On the development of plasma protein biomarkers. J Proteome Res. 2011;10(1):5. doi: 10.1021/pr1008515. [DOI] [PubMed] [Google Scholar]
- 35.Schiess R, Wollscheid B, Aebersold R. Targeted proteomic strategy for clinical biomarker discovery. Mol Oncol. 2009;3(1):33. doi: 10.1016/j.molonc.2008.12.001. [DOI] [PMC free article] [PubMed] [Google Scholar]
- 36.Fried LP, Xue Q, Cappola AR, et al. Nonlinear multisystem physiological dysregulation associated with frailty in older women: implications for etiology and treatment. J Gerontol A Biol Sci Med Sci. 2009;64(10):1049–1057. doi: 10.1093/gerona/glp076. [DOI] [PMC free article] [PubMed] [Google Scholar]


