Figure 2.
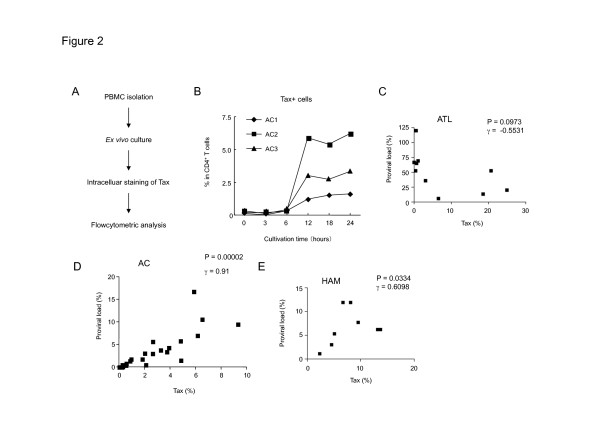
Characterization of Tax expression afterex vivocultivation. (A) A flowchart of the experiment to detect Tax by flow cytometry. (B) The percentages of Tax expression in CD4+ T cells after ex vivo culture are shown from 3 distinct ACs. (C–E) Correlation between Tax positivity in CD4+ T cells and PVL in ATL patients (C), ACs (D) or HAM/TSP (E).

