

Abstract
Objectives
The purpose of this secondary analysis was to test the hypothesis that an empirically derived psychological subgrouping scheme based on multiple Fear-Avoidance Model (FAM) constructs would provide additional capabilities for clinical outcomes in comparison to a single FAM construct.
Methods
Patients (n = 108) with acute or sub-acute low back pain (LBP) enrolled in a clinical trial comparing behavioral physical therapy interventions to classification based physical therapy completed baseline questionnaires for pain catastrophizing (PCS), fear-avoidance beliefs (FABQ-PA, FABQ-W), and patient-specific fear (FDAQ). Clinical outcomes were pain intensity and disability measured at baseline, 4-weeks, and 6-months. A hierarchical agglomerative cluster analysis was used to create distinct cluster profiles among FAM measures and discriminant analysis was used to interpret clusters. Changes in clinical outcomes were investigated with repeated measures ANOVA and differences in results based on cluster membership were compared to FABQ-PA subgrouping used in the original trial.
Results
Three distinct FAM subgroups (Low Risk, High Specific Fear, and High Fear & Catastrophizing) emerged from cluster analysis. Subgroups differed on baseline pain and disability (p’s<.01) with the High Fear & Catastrophizing subgroup associated with greater pain than the Low Risk subgroup (p<.01) and the greatest disability (p’s<.05). Subgroup × time interactions were detected for both pain and disability (p’s<.05) with the High Fear & Catastrophizing subgroup reporting greater changes in pain and disability than other subgroups (p’s<.05). In contrast, FABQ-PA subgroups used in the original trial were not associated with interactions for clinical outcomes.
Discussion
These data suggest that subgrouping based on multiple FAM measures may provide additional information on clinical outcomes in comparison to determining subgroup status by FABQ-PA alone. Subgrouping methods for patients with LBP should include multiple psychological factors to further explore if patients can be matched with appropriate interventions.
Keywords: Fear-Avoidance Model, Low Back Pain, Subgrouping, Specific Fear, Cluster Analysis
INTRODUCTION
Low back pain (LBP) is a heterogeneous condition, therefore it is not surprising that patient homogeneity has been described as a “myth” for LBP and other musculoskeletal diagnoses.1 Subgrouping of patients has been suggested as a method for implementing targeted treatment approaches and investigating which individuals respond favorably (or unfavorably) to specific interventions.1–3 An advantage of incorporating subgrouping methodology into studies investigating the effects of LBP interventions is the potential to identify larger effects between matched and unmatched treatment groups that may not have been detected in a heterogeneous sample of patients.1, 2, 4, 5 Consequently, subgrouping methodology has been used in previous LBP studies6 and suggested as a priority for future LBP research,2, 7–9 including studies focusing on psychosocial interventions.10
Psychological risk factors have been associated with the development and maintenance of chronic LBP.11–15 Subgrouping strategies based on psychological models have been incorporated into prior studies investigating the effectiveness of psychosocial interventions for LBP.4, 16, 17 Originally introduced by Lethem et al.,18 the Fear-Avoidance Model (FAM) of Musculoskeletal Pain is one specific psychological model that provides a potential explanation for why some individuals develop chronic LBP following an episode of acute LBP.19 The FAM consists of multiple psychological constructs (e.g., pain catastrophizing, fear of pain, and pain anxiety) that are associated with the development and maintenance of chronic musculoskeletal pain conditions. Previous studies have incorporated multiple FAM constructs into subgrouping methodology investigating prospective outcomes,4, 20 while others have used single FAM constructs (i.e., fear-avoidance beliefs) to specifically investigate the effects of psychosocial interventions for LBP.21–23
In previous randomized trials of behavioral physical therapy interventions for individuals with acute or subacute LBP, psychological subgrouping based on initial fear-avoidance beliefs about physical activity (Fear-Avoidance Beliefs Questionnaire: physical activity scale – FABQ-PA) scores were used in the analysis of clinical outcomes.22, 23 In 2003, George et al., used FABQ-PA scores in hierarchical regression models to investigate the influence of initial fear-avoidance beliefs on future clinical outcomes following physical therapy.22 Results indicated that when the interaction between type of treatment and initial fear-avoidance beliefs was added to the model, prediction of future disability was improved. In 2008, George et al., dichotomized initial FABQ-PA scores based on a 14-point cutoff score to categorize individuals into either high or low fear subgroups, which were ultimately not associated with clinical outcomes when type of treatment (i.e., classification based physical therapy alone, classification based physical therapy + graded activity, or classification based physical therapy + graded exposure) was considered.23 A potential limitation to the psychological subgrouping methodology used in the 2008 study is that only fear-avoidance beliefs about physical activity were considered.10, 24, 25 As previously mentioned, the FAM consists of multiple psychological constructs, however FABQ-PA scores only represent a single specific construct (i.e., fear-avoidance beliefs about physical activity). If a wider range of FAM constructs were used to develop subgroups; there may have been better probability for observing a differential response to the behavioral treatments.
Therefore, the current study is a secondary FAM subgrouping analysis conducted on data from a previous randomized trial of physical therapy behavioral interventions for acute and subacute LBP.23 Our primary aim was to test an empirically derived psychological subgrouping scheme consisting of multiple FAM constructs for prognostic (i.e., characteristics that identify patients who recover at different rates or have different outcomes; regardless of the nature of intervention)26 and treatment moderation (i.e., characteristics that identify subgroups of patients who respond differently to a particular intervention)26 capabilities for clinical outcomes. Our secondary aim was to determine if the current subgrouping scheme provided additional information about clinical outcomes in comparison to the single FAM construct psychological subgrouping scheme used in the original trial. We hypothesized that the current subgrouping scheme would provide additional information on clinical outcomes in the form of treatment moderation and that this capability would not be evident when incorporating the previous subgrouping scheme.
MATERIALS AND METHODS
Participants
Inclusion and exclusion criteria were based on guidelines from the Quebec Task Force on Spinal Disorders.27 For purposes of this study and the original trial,23 acute and subacute LBP were operationally defined as reporting current symptoms for 1 to 24 weeks and chronic LBP was defined as reporting current symptoms for greater than 24 weeks. Consecutive patients seeking treatment for LBP at University of Florida affiliated clinics were recruited and screened for eligibility. Inclusion criteria were patients aged between 15 and 60 with acute/subacute LBP with or without radiating symptoms. Patients had to have the ability to read and speak English because of the number of questionnaires. Exclusion criteria were patients with chronic LBP, signs of nerve-root compression, lumbar spinal stenosis, and postoperative lumbar spine surgery. Patients were also excluded for pregnancy, osteoporosis, and spinal disorders related to metastatic disease, visceral disease, or fracture. The study was approved by the University of Florida Institutional Review Board, and all subjects provided informed consent before participating in this study.
Demographic and Historical Information
Demographic and historical data were collected with a standard questionnaire during the initial physical therapy evaluation. Information collected included age, gender, race, work status, and duration of LBP symptoms.
Measures
Patients completed all self-report questionnaires before physical therapy evaluation.
Fear-Avoidance Model Measures
The Pain Catastrophizing Scale (PCS) was used to quantify the extent of catastrophic cognitions a patient reports in relation to LBP.28–30 The PCS is a 13-item scale with a total range of 0 to 52 and higher scores indicate elevated levels of pain catastrophizing. The Fear-Avoidance Beliefs Questionnaire (FABQ) was used to quantify general fear-avoidance beliefs specific to LBP.31 The FABQ contains 2 scales, a 4-item FABQ physical activity scale (FABQ-PA, range: 0 to 24) and a 7-item FABQ work scale (FABQ-W, range: 0 to 42). Higher scores indicate elevated levels of fear-avoidance beliefs for both scales. The FABQ-PA and FABQ-W are reported separately as this is matches how the FABQ is implemented clinically and is consistent with previous studies.23, 32, 33 The Fear of Daily Activities Questionnaire (FDAQ) was used to quantify fear of specific activities commonly reported by patients experiencing LBP.34 The FDAQ is a 10-item scale with a total range of 0 to 100 and higher scores indicate higher fear of specific activities.
Clinical Outcome Measures
The clinical measures used in this study were consistent with domains recommended for chronic pain clinical trials,35 and were measured at baseline, 4-weeks, and 6-months. To account for the pain intensity domain, patients rated their worst, best, and current pain intensity over the past 24 hours using a numerical rating scale (NRS), ranging from “0” (no pain) to “10” (worst pain imaginable).36 These 3 pain ratings were averaged and used as the numerical rating scale pain intensity variable in this study.37 To account for the physical function domain self-report of disability was assessed with the modified Oswestry Disability Questionnaire (ODQ).38, 39 The modified ODQ has 10 items that assess how LBP affects common daily activities, for example sitting, standing, and lifting. The ODQ has a range of 0 (no disability due to back pain) to 100 (completely disabled due to back pain), so higher scores indicate higher disability from LBP.
Interventions
This study is a secondary analysis of data from a clinical trial involving behavioral interventions for patients with acute or subacute LBP.23 Patients who met eligibility criteria provided informed consent and received treatment for 4 weeks under the supervision of a licensed physical therapist according to their random assignment of classification based physical therapy (PT) alone, PT with graded activity, or PT with graded exposure. Patients were reassessed by a blinded evaluator 4 weeks following randomization and completed mail follow-up for self-report questionnaires at 6 months. For the purpose of this secondary analysis, patients that received supplemental behavioral treatment (i.e., graded activity or graded exposure) were collapsed into one group (PT + Behavioral) and compared to patients that received classification based PT alone (PT).
Data Analysis
Analyses were performed with SPSS, version 17.0 (Chicago, IL). Baseline descriptive statistics were calculated for demographic variables, FAM measures, and clinical outcome measures. Raw scores for each FAM measure were transformed to z-scores to provide standardized scores for subsequent cluster analysis techniques. An exploratory hierarchical agglomerative cluster analysis was performed using Ward’s clustering method with squared Euclidean distances as the similarity measure to create distinct cluster profiles among FAM measures. Agglomeration coefficients were inspected and plotted to establish the most optimal cluster solution based on the percent change between adjacent cluster solutions40 and plot characteristics (i.e., elbow criterion).41
Next, discriminant function analysis with cross-validated (jackknifed) classification was performed on the same sample as a follow-up to interpret the cluster profiles.42 We used discriminant function analysis to determine: 1) which FAM measures differentiated subgroup allocation from the cluster analyses, and 2) the accuracy in subgroup allocation using solutions from the cluster analyses.
To identify potential cluster group differences in demographic variables, FAM measures and baseline clinical measures, one-way ANOVA with Bonferroni post-hoc correction was used for continuous variables and chi-square analysis was used for categorical data.
Changes in clinical outcomes (i.e., pain intensity and disability) based on cluster membership were then investigated with repeated measures ANOVA. The main effects were cluster membership, type of treatment (PT or PT + Behavioral) and time (baseline, 4-weeks, and 6-months). Detection of interactions that include cluster membership would support cluster membership being associated with treatment effect moderation capabilities.2, 5, 26 Specifically, the presence of three-way interactions between cluster membership, treatment, and time would indicate the capability of cluster membership as a specific treatment effect moderator (i.e., PT or PT + Behavioral). Alternatively, the presence of only two-way interactions between cluster membership and time would indicate the capability of cluster membership as a general treatment effect moderator (i.e., regardless of the nature of treatment). Results from these analyses indicating only cluster membership main effects would suggest its capability as a prognostic indicator for changes in clinical outcomes and not as a treatment effect moderator.2, 5, 26 Separate models were created with pain intensity (NRS) and disability (ODQ) as the dependent variables.
The effect of subgrouping based on cluster membership was compared to effects of subgrouping based on initial fear that was used when assessing clinical outcomes in the original trial and consisted of FABQ physical activity scores (dichotomized high and low based on FABQ-PA scores > 14).23 This was investigated with similar repeated measures ANOVA models as described in the previous section with the only exception being that the effect of cluster membership was removed from the model and replaced with dichotomized FABQ-PA scores. Alpha level was set at (.05) for all analyses.
RESULTS
Descriptive statistics of the study sample (n = 108) and resultant cluster solutions are provided in Table 1.
TABLE 1.
Baseline descriptive statistics
| Variable | Total sample (n = 108) | Low risk cluster (n = 46) | High specific fear cluster (n = 27) | High fear & catastrophizing cluster (n = 35) | Cluster comparisons |
|---|---|---|---|---|---|
| Age (years) | 37.2 (14.5) | 36.6 (14.9) | 38.7 (11.4) | 36.7 (16.3) | p > .05 |
| Gender (female) | 69 (63.9%) | 26 (56.5%) | 21 (77.8%) | 22 (62.8%) | p > .05 |
| Race | p < .05 | ||||
| African American | 24 (22.2%) | 6 (13.0%) | 2 (7.4%) | 16 (45.7%) | |
| White | 74 (68.5%) | 35 (76.1%) | 23 (85.2%) | 16 (45.7%) | |
| Other | 10 (9.3%) | 5 (10.9%) | 2 (7.4%) | 3 (8.6%) | |
| Work status | p > .05 | ||||
| Full-time | 62 (57.4%) | 23 (50.0%) | 16 (59.2%) | 23 (65.7%) | |
| Part-time | 13 (12.0%) | 6 (13.0%) | 3 (11.1%) | 4 (11.4%) | |
| Unemployed | 25 (23.1%) | 13 (28.2%) | 6 (22.2%) | 6 (17.1%) | |
| Retired | 5 (4.6%) | 2 (4.3%) | 1 (3.7%) | 2 (5.7%) | |
| Work-related LBP (yes) | 22 (20.4%) | 4 (9.5%) | 4 (15.4%) | 14 (40.0%) | p < .01 |
| Symptom duration (weeks) | 7.5 (6.1) | 8.5 (6.9) | 6.5 (4.7) | 6.9 (6.1) | p > .05 |
| Average pain intensity (NRS) | 4.7 (2.1) | 3.9 (1.8) | 4.8 (2.0) | 5.7 (1.9) | p < .01 |
| Oswestry disability score (ODQ) | 29.5 (16.2) | 18.8 (10.2) | 32.4 (12.8) | 41.3 (15.9) | p < .01 |
| Pain catastrophizing (PCS) | 16.3 (11.2) | 8.1 (6.9) | 19.7 (7.8) | 24.3 (11.2) | p < .01 |
| Fear avoidance beliefs about physical activity (FABQ-PA) | 14.9 (5.5) | 11.8 (5.9) | 15.1 (3.0) | 18.8 (3.8) | p < .01 |
| Fear avoidance beliefs about work (FABQ-W) | 13.3 (11.1) | 6.9 (7.5) | 8.3 (7.4) | 25.5 (6.5) | p < .01 |
| Fear of daily activities (FDAQ) | 37.3 (26.7) | 13.9 (11.2) | 57.1 (14.8) | 52.8 (24.7) | p < .01 |
All values are reported as mean (standard deviation) unless otherwise indicated.
NRS – Numerical Rating Scale for pain intensity (range = 0 to 10); ODQ – revised Oswestry Disability Questionnaire (range = 0% to 100%); PCS – Pain Catastrophizing Scale (range = 0 to 52); FABQ-PA – Fear-Avoidance Beliefs Questionnaire (physical activity scale) (range = 0 to 24); FABQ-W – Fear-Avoidance Beliefs Questionnaire (work scale) (range = 0 to 42); FDAQ – Fear of Daily Activities Questionnaire (range = 0 to 100).
Cluster Analysis
Z-score transformations for FAM measure scores were required for cluster analysis procedures; however raw scores are reported for descriptive purposes because they are more clinically interpretable. Inspection of all predictor z-scores indicated that absolute values did not exceed 4.0 (range = −2.7 to 2.9), suggesting the data did not contain extreme outliers.42, 43 Inspection of agglomeration coefficients from a hierarchical agglomerative cluster analysis of 4 FAM measures revealed that the percent change was large (56.5%) between the 3 and 2-cluster solutions with relatively smaller changes in preceding steps, suggesting a 3-cluster solution is appropriate, which was further confirmed by visual inspection of plotted agglomeration coefficients.40, 41 Cluster 1 was labeled “Low Risk” (n = 46, 43%) and was comprised of individuals that were associated with low levels of fear avoidance beliefs, specific fear, and pain catastrophizing. Cluster 2 was labeled “High Specific Fear” (n = 27, 25%) and was comprised of individuals that were associated with only high levels of specific fear. Cluster 3 was labeled “High Fear & Catastrophizing” (n = 35, 32%) and was comprised of individuals that were associated with high levels of fear avoidance beliefs, specific fear, and pain catastrophizing (Figure 1).
Figure 1.
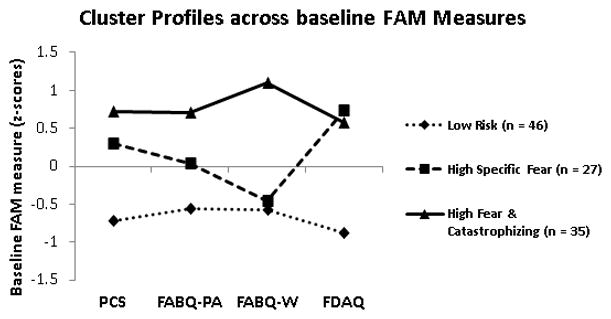
Z-scores of 3 clusters using baseline FAM measure responses
PCS – Pain Catastrophizing Scale; FABQ-PA – Fear-Avoidance Beliefs Questionnaire (physical activity scale); FABQ-W – Fear-Avoidance Beliefs Questionnaire (work scale); FDAQ – Fear of Daily Activities Questionnaire. Bonferroni post-hoc comparisons: (Low risk < other subgroups) for PCS, FABQ-PA and FDAQ scores (p’s < .01); (Low risk < High Fear & Catastrophizing) for FABQ-W scores (p < .01); (High Specific Fear < High Fear & Catastrophizing) for FABQ-PA and FABQ-W scores (p’s < .01), however not for PCS or FDAQ scores (p’s > .05).
Discriminant Function Analysis
Discriminant function analysis run with simultaneous entry method with 4 predictors (PCS: Wilks’ λ = .59, p < .001; FABQ-PA: Wilks’ λ = .70, p < .001; FABQ-W: Wilks’ λ = .41, p < .001; FDAQ: Wilks’ λ = .42, p < .001) suggested that each predictor contributed uniquely to cluster solutions and resulted in 2 discriminant functions for the 3 clusters. The overall test of the 2 functions (i.e., functions 1 and 2) was significant (χ2 (8) = 196.82, Wilks’ λ = .15, p < .001) indicating that predictor scores were able to discriminate among the 3 cluster solutions. The test for function 2 alone was also significant (χ2 (3) = 49.05, Wilks’ λ = .62, p < .001), indicating that that even after function 1 is removed, there remained significant discrimination. Function 1 accounted for 76% (canonical R = .87) and function 2 accounted for 37% (canonical R = .61) of the total relationship between predictors and clusters. The two discriminant functions account for 84% and 16%, respectively, of the between-cluster variability. The pooled within-groups correlations between discriminating variables and standardized canonical discriminant functions, as well as the standardized canonical discriminant function coefficients (analogous to multiple regression beta weights) are provided in Table 2. When discriminant function analyses result in multiple functions, the first function is considered the most important.42 Therefore, based on the standardized coefficients for the first discriminant function in Table 2, fear-avoidance beliefs about work (FABQ-W) demonstrated the strongest relationship with the discriminant function, whereas pain catastrophizing (PCS) and fear of specific daily activities (FDAQ) demonstrated moderate relationships and fear-avoidance beliefs about physical activity (FABQ-PA) demonstrated the weakest relationship. Together, the functions were able to correctly classify 93.5% of the 3 subgroups (97.8% of the Low Risk, 88.9% of the High Specific Fear, and 91.4% of the High Fear & Catastrophizing).
Table 2.
Coefficients of FAM Predictor Variables of the Discriminant Function
| Discriminant Function | ||||
|---|---|---|---|---|
| FAM Variables | 1 | 2 | ||
| Standardized Coefficients* | Correlation Coefficients† | Standardized Coefficients* | Correlation Coefficients† | |
| Pain catastrophizing (PCS) | 0.477 | 0.464 | −0.054 | −0.198 |
| Fear avoidance beliefs about physical activity (FABQ-PA) | 0.248 | 0.366 | 0.193 | 0.050 |
| Fear avoidance beliefs about work (FABQ-W) | 0.669 | 0.609 | 0.643 | 0.656 |
| Fear of daily activities (FDAQ) | 0.487 | 0.576 | −0.759 | −0.735 |
Key:
indicates standardized canonical discriminant function coefficients;
indicates pooled within-groups correlations between discriminating variables and standardized canonical discriminant functions
Cluster Comparisons
Differences in demographic variables were detected between subgroups on race and the presence of work-related LBP, however not on age, gender, or work status. Chi-square analyses revealed that the High Fear & Catastrophizing subgroup had proportionally more African Americans (66.7%) compared to Low Risk (25.0%) or High Specific Fear (8.3%) subgroups (χ2 (4) = 17.48, p = .002). Furthermore, there were proportionally more patients with work-related LBP in the High Fear & Catastrophizing (40.0%) subgroup compared to Low Risk (9.5%) or High Specific Fear (15.4%) subgroups (χ2 (2) = 11.30, p = .004).
Differences in FAM measures were detected between subgroups for PCS, FABQ-PA, FABQ-W, and FDAQ z-scores (Figure 1). Post-hoc comparisons with Bonferonni correction revealed that the Low Risk subgroup was associated with lower PCS, FABQ-PA and FDAQ scores compared to other subgroups and lower FABQ-W scores compared to the High Fear & Catastrophizing subgroup (p’s < .01). Furthermore, the High Specific Fear subgroup was associated with lower FABQ-PA and FABQ-W scores compared to the High Fear & Catastrophizing subgroup (p’s < .01), however there were no statistical differences between these two subgroups for PCS or FDAQ scores (p’s > .05).
Differences in baseline clinical measures were detected between subgroups for pain intensity ratings and disability scores, however not for symptom duration. Post-hoc comparisons with Bonferonni correction revealed that the Low Risk subgroup was associated with lower baseline pain intensity ratings compared to the High Fear & Catastrophizing subgroup (p < .01) and lower baseline disability scores compared to the High Fear & Catastrophizing and High Specific Fear subgroups (p’s < .01). High Specific Fear subgroup disability scores were also lower when compared to the High Fear & Catastrophizing subgroup (p < .05).
Clinical Outcomes
The 4-week and 6-month outcomes for pain (NRS) and disability (ODQ) scores (n = 72, 66.7%) are reported in Table 3. There were no three-way (cluster membership × treatment × time) interactions for clinical outcomes associated with either subgrouping scheme. Moreover, there were no two-way interactions that included treatment, indicating that individuals receiving PT alone or PT + Behavioral treatment were associated with similar changes in clinical outcomes in both subgrouping schemes. However, models consisting of subgrouping based on our cluster analysis results indicated two-way (time × cluster) interactions for pain [F (4,128) = 2.54, p < .05, η2 = .07] and disability [F (4,128) = 3.64, p < .01, η2 = .10] scores, indicating that cluster membership was associated with changes in both clinical outcomes and demonstrated general treatment effect moderation capabilities (i.e., regardless of the nature of treatment) (Figures 2 and 3). Pairwise comparisons between clusters indicated that the High Fear & Catastrophizing cluster reported greater changes in pain intensity ratings and disability scores when compared to the Low Risk or High Specific Fear clusters (p’s < .05). Models consisting of subgrouping based on initial fear that was used in assessing clinical outcomes in the original trial and consisted of FABQ physical activity scores (dichotomized high and low based on FABQ-PA scores > 14) indicated only main effects for time for pain [F (2, 132) = 68.18, p < .01, η2 = .51] and disability [F (2, 132) = 52.95, p < .01, η2 = .44] scores, indicating that both initial fear subgroups (i.e., high and low) and both treatment groups (i.e., PT and PT + Behavioral) demonstrated significant decreases in pain intensity ratings (NRS) and disability scores (ODQ).
Table 3.
Descriptive Statistics for Clinical Outcomes
| Subgrouping method | Treatment group | Pain Intensity (NRS) | Disability (ODQ) | ||||
|---|---|---|---|---|---|---|---|
| Baseline | 4-weeks | 6-months | Baseline | 4-weeks | 6-months | ||
| Cluster Analysis* | |||||||
| Low Risk | PT | 3.7 (1.7) | 1.5 (1.5) | 1.3 (1.2) | 22.7 (9.0) | 10.7 (10.3) | 7.4 (8.7) |
| PT + Behavioral | 3.9 (1.9) | 2.2 (1.5) | 1.4 (1.4) | 19.6 (9.8) | 12.2 (10.5) | 9.0 (7.5) | |
| High Specific Fear | PT | 3.7 (2.3) | 1.6 (1.8) | 1.6 (1.3) | 23.5 (6.6) | 15.0 (6.2) | 9.5 (11.2) |
| PT + Behavioral | 4.7 (2.0) | 1.8 (2.0) | 1.6 (2.2) | 29.7 (13.5) | 14.4 (13.1) | 12.1 (15.9) | |
| High Fear & Catastrophizing | PT | 6.4 (2.0) | 2.3 (2.1) | 1.4 (1.7) | 50.3 (17.5) | 25.3 (20.1) | 14.0 (13.8) |
| PT + Behavioral | 6.1 (1.9) | 3.0 (2.0) | 2.4 (2.2) | 39.2 (13.1) | 20.9 (12.5) | 19.8 (14.5) | |
| Original Trial# | |||||||
| Low fear (FABQ-PA < 14) | PT | 3.5 (2.2) | 1.2 (1.5) | 0.9 (1.2) | 24.4 (15.5) | 10.0 (7.4) | 5.8 (7.1) |
| PT + Behavioral | 4.3 (2.0) | 1.7 (1.6) | 1.7 (1.5) | 25.6 (10.2) | 14.8 (13.8) | 13.1 (10.1) | |
| High fear (FABQ-PA ≥ 14) | PT | 4.8 (1.9) | 2.0 (1.8) | 1.6 (1.3) | 32.2 (15.9) | 17.7 (15.9) | 11.4 (11.6) |
| PT + Behavioral | 5.1 (2.1) | 2.6 (1.9) | 1.8 (2.1) | 30.9 (16.2) | 15.9 (11.9) | 14.3 (16.2) | |
All values are reported as mean (standard deviation) for completers of initial trial only (n = 72, 66.7%)
NRS – Numerical Rating Scale for pain intensity (range = 0 to 10); ODQ – revised Oswestry Disability Questionnaire (range = 0% to 100%); FABQ-PA – Fear-Avoidance Beliefs Questionnaire (physical activity scale)
indicates statistically significant two-way [subgroup × time] interactions for NRS (p < .05) and ODQ (p < .01)
indicates statistically significant main effects of time for both subgroups for NRS (p < .01) and ODQ (p < .01)
Figure 2.
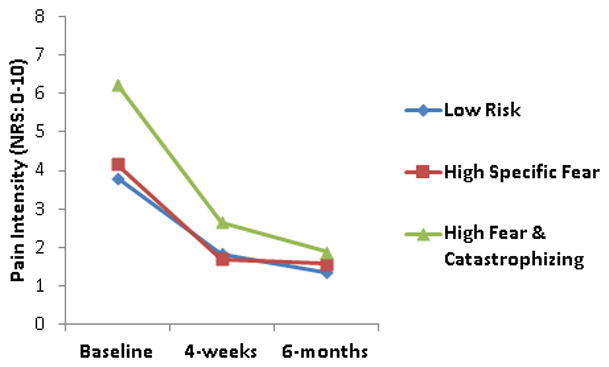
Results from repeated measures ANOVA for pain intensity ratings using cluster analysis generated FAM subgroups
NRS – Numeric Rating Scale (range = 0 to 10)
Figure 3.
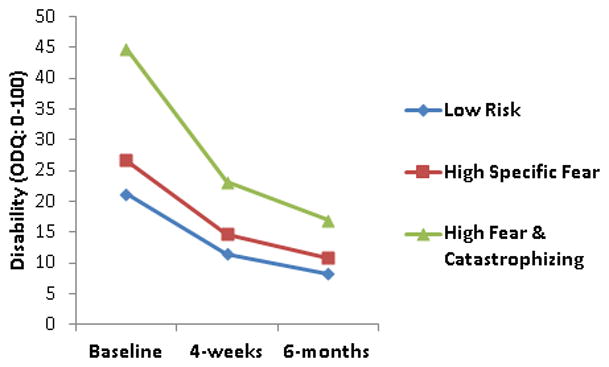
Results from repeated measures ANOVA for disability scores using cluster analysis generated FAM subgroups
ODQ – revised Oswestry Disability Questionnaire (range = 0% to 100%)
We then investigated the distribution of subgroups using chi-squared analysis for participants that completed 6-month follow-up assessments (n = 72). As expected, subgroups were not evenly distributed (χ2 (2) = 14.33, p < .01) as indicated by a greater proportion of participants in the Low Risk subgroup (75.0%; standardized residual = 2.1) and lower proportion of participants in the High Fear & Catastrophizing subgroup (4.2%; standardized residual = −2.2) that were also allocated to the low fear subgroup (33.3%) used in the original trial. Interestingly, subgroups generated from the current study through cluster analysis were fairly evenly distributed across the high fear subgroup (66.7%) used in the original trial (31.3% Low Risk; 29.2% High Specific Fear; 39.6% High Fear & Catastrophizing). This finding suggests that the original subgroup method based on dichotomized FABQ-PA scores may have missed subgroups identified through clustering methods.
As an exploratory analysis, we tested if our clinical outcome results differed when behavioral treatments were not collapsed. Similar to the results previously reported in this study, there were no three or two-way interactions that included treatment for clinical outcomes (p’s > .05), indicating that individuals receiving PT alone, PT + graded activity, or PT + graded exposure were associated with similar changes in pain and disability outcomes in both subgrouping schemes.
DISCUSSION
The primary aim of the current analyses were to determine if a psychological subgrouping scheme based on multiple FAM constructs (i.e., pain catastrophizing, fear-avoidance beliefs, and fear of specific activities) provided prognostic or treatment moderation capabilities for clinical outcomes in comparison to the single FAM construct (i.e., fear-avoidance beliefs about physical activity).23 Our results suggested that 3 FAM subgroups (Low Risk, High Specific Fear, and High Fear & Catastrophizing) emerged from cluster analysis solutions with different profiles in pain catastrophizing, fear-avoidance beliefs, and fear of specific activities (Figure 1). These FAM subgroups were used to detect subgroup × time interactions for changes in clinical outcomes, suggesting that subgroup status is potentially a treatment moderator based on these data. Alternatively, subgroup status based exclusively on fear-avoidance beliefs about physical activity was associated with prognostic capability for clinical outcomes but not as a treatment moderator.
A potential limitation to previous studies investigating FAM subgrouping methodology is that the interaction between subgroups and responses to various treatments were not considered in subsequent analyses.4, 20 In this study we explored this question from two different perspectives. First, using our cluster analysis, we investigated the generated subgroups for capabilities as prognostic indicators or treatment effect moderators for clinical outcomes. Second, we compared our cluster analysis generated subgrouping scheme to the subgrouping scheme used in the original trial by investigating results from repeated measures analyses for clinical outcomes. Treatment effect moderators have been described as characteristics that identify subgroups of patients who respond differently to a particular intervention, while prognostic indicators have been described as characteristics that identify patients who recover at different rates or have different outcomes; regardless of the nature of intervention.26 It has been suggested that identification of treatment effect moderators should be based on tests of statistical interactions, while the presence of only main effects are indicative of prognostic indicators.2, 5, 26 Therefore, subgrouping capabilities as a prognostic indicator for clinical outcomes would be supported by the presence of only subgroup main effects, which were detected when subgroups generated from dichotomized FABQ-PA scores were modeled. Alternatively, subgrouping capabilities as a treatment effect moderator for clinical outcomes would be supported by the presence of statistical interactions that include the effect of subgroup status, which were detected when subgroups generated from our cluster analysis solutions were modeled. Considering there were no statistical interactions that included type of treatment, the specific effects associated with treatment were similar across treatment groups (i.e., PT or PT + Behavioral) regardless of subgrouping methodology. Furthermore, this finding potentially suggests that the FAM subgroups generated from our cluster analysis solutions were associated with general treatment effect moderation, as opposed to specific treatment effect moderation.
Fear-avoidance beliefs about physical activity (i.e., dichotomized FABQ-PA scores) were used to subgroup individuals in the original trial and were not associated with clinical outcomes.23 Discriminant analyses indicated that FABQ-PA scores were the weakest contributors in determining cluster membership in this study when measured on a continuous scale (Table 2). In general, subgroups generated from our cluster analysis solutions differed based on FAM measure z-scores. The Low Risk subgroup was associated with lower FAM measure scores compared to other subgroups, with the only exception being FABQ-W scores which were similar to the High Specific Fear subgroup. FABQ-W scores were the strongest contributors in determining cluster membership in this study (Table 2) and were highest in the High Fear & Catastrophizing subgroup that consisted of the highest proportion of individuals with work-related LBP. Collectively, these findings potentially suggest that: 1) FABQ-PA scores alone may not be sufficient for generating FAM subgroups associated with clinical outcomes; 2) although PCS, FABQ-PA, and FDAQ scores were important for differentiating Low Risk from other subgroups, FDAQ scores were most important (based on z-score mean differences; not reported) for differentiating between Low Risk and High Specific Fear subgroups followed by PCS and FABQ-PA scores; and 3) work-related LBP and associated FABQ-W scores were most important for differentiating between High Fear & Catastrophizing and High Specific Fear subgroups.
Subgroups identified by cluster analysis did not differ in age, gender, work status, or symptom duration, however did differ in racial composition, and baseline pain intensity ratings and disability scores. Our results indicated consistent dose-response patterns based on a plausible (albeit theoretical) Low Risk < High Specific Fear < High Fear & Catastrophizing relationship for baseline pain intensity ratings and disability scores, although not all were statistically significant. The presence of psychological distress dose-response patterns for clinically relevant domains (i.e., pain and disability) potentially provides further support for the cluster analysis generated subgroups in this study. Previous cross-sectional studies44–47 have indicated that elevated psychological distress is associated with higher levels of initial pain and disability. Furthermore, elevated levels of initial pain or disability have been implicated as being strong predictors of future pain or disability in previous longitudinal studies.48, 49 Therefore, based on the results of this study we cannot speculate if baseline clinical characteristics or subgroup allocation were more important for predicting clinical outcomes.
Identifying subgroups of individuals within the FAM has been suggested as a potential method to improve its clinical utility.4, 25 Cluster analysis techniques have been described as a useful statistical procedure to maximize the homogeneity within-clusters and maximizing the heterogeneity between-clusters in respect to variables of interest.50 Our resultant cluster solutions are consistent with previous studies that have used these techniques to identify individuals with similar scoring patterns on psychological screening questionnaires to investigate if resultant subgroups were associated with study outcomes and could potentially be used to guide treatment in future studies. For example, Boersma & Linton used the Örebro Musculoskeletal Pain Screening Questionnaire to identify distinct subgroups with similar scoring patterns of psychological distress.4, 20 Collectively, their results indicated that subgroups with elevated levels of psychological distress (e.g., pain-related fear,20 fear-avoidant 4) were associated with increased pain and decreased function (cross-sectionally)20 and poor outcomes (prospectively)4, 20 in comparison to lower risk subgroups.
Our study included a measure of specific fear that has not been incorporated in previous cluster analyses. The potential importance of specific fear has been highlighted in a recent FAM review25 and its identification is consistent with a previously suggested research agenda to investigate the role and effectiveness of early psychosocial interventions for LBP (i.e., treatment that matches individual patient characteristics or prognostic profiles).10 Interestingly, High Specific Fear was represented in a distinct subgroup in this study (Figure 1). Post-hoc analyses of baseline FAM measure z-scores indicated that individuals in the High Specific Fear subgroup were associated with greater FDAQ scores in comparison to PCS, FABQ-PA, or FABQ-W scores (p < .02), therefore individuals reporting elevated levels of specific fear related to activities were not associated with elevated levels of general pain-related fear beliefs or catastrophizing. Moreover, our results indicated that specific fear as measured by the FDAQ was a strong contributor to the first discriminant function and the strongest contributor to the second discriminant function (Table 2). The implications of measuring general or specific fear is currently an unresolved issue related to the FAM,19 however our results suggest that specific fear should be accounted for separately for individuals with LBP. Furthermore, composite measures of psychological distress (e.g., Örebro Musculoskeletal Pain Screening Questionnaire51 or STarT Back Screening Tool52) may not be accounting for a potentially important patient subgroup because they do not include items associated with specific fears and there is the potential that the effects of elevated fear or catastrophizing in isolation may be different from the cumulative effects associated with elevated levels of fear and catastrophizing.
We acknowledge there are important conceptual differences between graded activity and graded exposure and these differences may be masked by combining these intervention groups in this analysis. Our rationale for collapsing patients that received physical therapy supplemented with either graded activity or graded exposure into a single treatment group (i.e., PT + Behavioral) was based on data from the original trial23 and a separate clinical trial by our group53 where primary and secondary outcomes associated with either behavioral treatment were equivalent. Graded activity and graded exposure are based on different theoretical backgrounds and clinical application. For example, both are focused on behavioral principles in the progression of treatment, however graded activity incorporates a pre-established quota-based system, while graded exposure is primarily based on the performance of fearful activities. Therefore, it is important to acknowledge that the results of this study should not be interpreted as having implications for matching patients with specific behavioral interventions (i.e., graded activity or graded exposure). These results are best generalized to application of supplemental behavioral treatment in general.
Several limitations should be considered when interpreting the results of this study. First, these results were based on cluster analysis solutions. These techniques will generate solutions regardless if they are associated with any theoretical plausibility. Unfortunately, there is no standard objective process to determine the optimal number of clusters.50 As a result, we employed various “stopping rules” combined with practical judgment and theoretical foundations in determining our final number of clusters solutions.50 Future studies should consider establishing an a-priori optimal number of cluster solutions with an empirical basis, then determine if agglomeration coefficients and plot characteristics confirm or refute their hypothesis. Second, other previously described FAM subgrouping studies using cluster analysis included a measure of depression.4, 20 Including measures of depression, anxiety, and kinesiophobia would have provided a more comprehensive representation of the current FAM19 that may have resulted in different findings. We did not incorporate more comprehensive measures because of attempt to replicate the previous 2003 trial22 and also for concerns of patient burden. Therefore, future studies investigating FAM subgrouping should consist of a comprehensive set psychological construct measures within the current FAM. Third, behavioral treatments used in the original trial23 were primarily based on a high and low fear approach and were not tailored to the three subgroups generated through cluster analysis in this study which may be viewed as a limitation. Finally, 6-month follow-up data was only available for 66.7% (n = 72) of the study sample, therefore this sample size was not powered to detect the statistically meaningful interactions of interest (i.e., three-way subgroup × treatment × time) for this study.54 As an exploratory analysis, we only tested individuals in the High Specific Fear subgroup to detect if individuals in the PT + Behavioral group that received graded exposure were associated with larger treatment effects. There were no statistical interactions detected when these analyses were performed providing “proof of concept” that we did not miss any potential beneficial effects that were observed descriptively.
Collectively, the results of this study suggest that questionnaires measuring FAM constructs can be used to detect psychological profiles central to the FAM via cluster analysis techniques. Moreover, cluster solutions are useful in detecting subgroups of patients that are distinctly associated with baseline measures of pain and disability that may be useful as general treatment moderators for future outcomes. Furthermore, the findings of this study indicate that cluster analysis methods may be more useful in identifying subgroups in comparison to arbitrary dichotomization methods involving continuous measures. Specifically, a more valid representation of the multivariate distribution may be more optimally identified through clustering methods in comparison to using dichotomies to identify potential subgroups when a bimodal distribution is not present. Finally, results from this type of subgrouping methodology have potential to be integrated into clinical decision-making processes associated with targeting appropriate psychological variables for early intervention.
Acknowledgments
JMB received support from the National Institutes of Health T-32 Neural Plasticity Research Training Fellowship (Grant #HD043730) while preparing this manuscript.
Giorgio Zeppieri Jr., Anthony L. Cere, Melissa R. Cere, Michael S. Borut, Michael J. Hodges, Dalton M. Reed, and Carolina Valencia assisted with data collection.
REFERENCES
- 1.Turk DC. The potential of treatment matching for subgroups of patients with chronic pain: lumping versus splitting. Clin J Pain. 2005;21(1):44–55. doi: 10.1097/00002508-200501000-00006. discussion 69–72. [DOI] [PubMed] [Google Scholar]
- 2.Kent P, Keating JL, Leboeuf-Yde C. Research methods for subgrouping low back pain. BMC Med Res Methodol. 2010;10:62. doi: 10.1186/1471-2288-10-62. [DOI] [PMC free article] [PubMed] [Google Scholar]
- 3.Foster NE, Hill JC, Hay EM. Subgrouping patients with low back pain in primary care: are we getting any better at it? Man Ther. 2011;16(1):3–8. doi: 10.1016/j.math.2010.05.013. [DOI] [PubMed] [Google Scholar]
- 4.Boersma K, Linton SJ. Screening to identify patients at risk: profiles of psychological risk factors for early intervention. Clin J Pain. 2005;21(1):38–43. doi: 10.1097/00002508-200501000-00005. discussion 69–72. [DOI] [PubMed] [Google Scholar]
- 5.Vlaeyen JW, Morley S. Cognitive-behavioral treatments for chronic pain: what works for whom? Clin J Pain. 2005;21(1):1–8. doi: 10.1097/00002508-200501000-00001. [DOI] [PubMed] [Google Scholar]
- 6.Fritz JM, Cleland JA, Childs JD. Subgrouping patients with low back pain: evolution of a classification approach to physical therapy. J Orthop Sports Phys Ther. 2007;37(6):290–302. doi: 10.2519/jospt.2007.2498. [DOI] [PubMed] [Google Scholar]
- 7.Foster NE, Dziedzic KS, van der Windt DA, et al. Research priorities for non-pharmacological therapies for common musculoskeletal problems: nationally and internationally agreed recommendations. BMC Musculoskelet Disord. 2009;10:3. doi: 10.1186/1471-2474-10-3. [DOI] [PMC free article] [PubMed] [Google Scholar]
- 8.Goldstein MS, Scalzitti DA, Craik RL, et al. The revised research agenda for physical therapy. Phys Ther. 2011;91(2):165–74. doi: 10.2522/ptj.20100248. [DOI] [PMC free article] [PubMed] [Google Scholar]
- 9.Bouter LM, Pennick V, Bombardier C, et al. Cochrane back review group. Spine (Phila Pa 1976) 2003;28(12):1215–8. doi: 10.1097/01.BRS.0000065493.26069.1C. [DOI] [PubMed] [Google Scholar]
- 10.van der Windt D, Hay E, Jellema P, et al. Psychosocial interventions for low back pain in primary care: lessons learned from recent trials. Spine (Phila Pa 1976) 2008;33(1):81–9. doi: 10.1097/BRS.0b013e31815e39f9. [DOI] [PubMed] [Google Scholar]
- 11.Pincus T, Burton AK, Vogel S, et al. A systematic review of psychological factors as predictors of chronicity/disability in prospective cohorts of low back pain. Spine (Phila Pa 1976) 2002;27(5):E109–20. doi: 10.1097/00007632-200203010-00017. [DOI] [PubMed] [Google Scholar]
- 12.Linton SJ. A review of psychological risk factors in back and neck pain. Spine (Phila Pa 1976) 2000;25(9):1148–56. doi: 10.1097/00007632-200005010-00017. [DOI] [PubMed] [Google Scholar]
- 13.Hayden JA, Chou R, Hogg-Johnson S, et al. Systematic reviews of low back pain prognosis had variable methods and results: guidance for future prognosis reviews. J Clin Epidemiol. 2009;62(8):781–796. e1. doi: 10.1016/j.jclinepi.2008.09.004. [DOI] [PubMed] [Google Scholar]
- 14.Grotle M, Foster NE, Dunn KM, et al. Are prognostic indicators for poor outcome different for acute and chronic low back pain consulters in primary care? Pain. 2010;151(3):790–7. doi: 10.1016/j.pain.2010.09.014. Epub ahead of print. [DOI] [PMC free article] [PubMed] [Google Scholar]
- 15.Hayden JA, Dunn KM, van der Windt DA, et al. What is the prognosis of back pain? Best Pract Res Clin Rheumatol. 2010;24(2):167–79. doi: 10.1016/j.berh.2009.12.005. [DOI] [PubMed] [Google Scholar]
- 16.Jellema P, van der Windt DA, van der Horst HE, et al. Should treatment of (sub)acute low back pain be aimed at psychosocial prognostic factors? Cluster randomised clinical trial in general practice. BMJ. 2005;331(7508):84. doi: 10.1136/bmj.38495.686736.E0. [DOI] [PMC free article] [PubMed] [Google Scholar]
- 17.Hay EM, Dunn KM, Hill JC, et al. A randomised clinical trial of subgrouping and targeted treatment for low back pain compared with best current care. The STarT Back Trial Study Protocol. BMC Musculoskelet Disord. 2008;9:58. doi: 10.1186/1471-2474-9-58. [DOI] [PMC free article] [PubMed] [Google Scholar]
- 18.Lethem J, Slade PD, Troup JD, et al. Outline of a Fear-Avoidance Model of exaggerated pain perception--I. Behav Res Ther. 1983;21(4):401–8. doi: 10.1016/0005-7967(83)90009-8. [DOI] [PubMed] [Google Scholar]
- 19.Leeuw M, Goossens ME, Linton SJ, et al. The fear-avoidance model of musculoskeletal pain: current state of scientific evidence. J Behav Med. 2007;30(1):77–94. doi: 10.1007/s10865-006-9085-0. [DOI] [PubMed] [Google Scholar]
- 20.Boersma K, Linton SJ. Psychological processes underlying the development of a chronic pain problem: a prospective study of the relationship between profiles of psychological variables in the fear-avoidance model and disability. Clin J Pain. 2006;22(2):160–6. doi: 10.1097/01.ajp.0000159582.37750.39. [DOI] [PubMed] [Google Scholar]
- 21.Werneke MW, Hart DL, George SZ, et al. Clinical outcomes for patients classified by fear-avoidance beliefs and centralization phenomenon. Arch Phys Med Rehabil. 2009;90(5):768–77. doi: 10.1016/j.apmr.2008.11.008. [DOI] [PubMed] [Google Scholar]
- 22.George SZ, Fritz JM, Bialosky JE, et al. The effect of a fear-avoidance-based physical therapy intervention for patients with acute low back pain: results of a randomized clinical trial. Spine (Phila Pa 1976) 2003;28(23):2551–60. doi: 10.1097/01.BRS.0000096677.84605.A2. [DOI] [PubMed] [Google Scholar]
- 23.George SZ, Zeppieri G, Jr, Cere AL, et al. A randomized trial of behavioral physical therapy interventions for acute and sub-acute low back pain ( NCT00373867) Pain. 2008;140(1):145–57. doi: 10.1016/j.pain.2008.07.029. [DOI] [PMC free article] [PubMed] [Google Scholar]
- 24.Jellema P, van der Windt DA, van der Horst HE, et al. Why is a treatment aimed at psychosocial factors not effective in patients with (sub)acute low back pain? Pain. 2005;118(3):350–9. doi: 10.1016/j.pain.2005.09.002. [DOI] [PubMed] [Google Scholar]
- 25.Pincus T, Smeets RJ, Simmonds MJ, et al. The fear avoidance model disentangled: improving the clinical utility of the fear avoidance model. Clin J Pain. 2010;26(9):739–46. doi: 10.1097/AJP.0b013e3181f15d45. [DOI] [PubMed] [Google Scholar]
- 26.Hancock M, Herbert RD, Maher CG. A guide to interpretation of studies investigating subgroups of responders to physical therapy interventions. Phys Ther. 2009;89(7):698–704. doi: 10.2522/ptj.20080351. [DOI] [PubMed] [Google Scholar]
- 27.Scientific approach to the assessment and management of activity-related spinal disorders. A monograph for clinicians. Report of the Quebec Task Force on Spinal Disorders. Spine (Phila Pa 1976) 1987;12(7 Suppl):S1–59. [PubMed] [Google Scholar]
- 28.Sullivan M, Bishop S, Pivik J. The Pain Catastrophizing Scale: development and validation. Psychological Assessment. 1995;7(4):524–532. [Google Scholar]
- 29.Van Damme S, Crombez G, Bijttebier P, et al. A confirmatory factor analysis of the Pain Catastrophizing Scale: invariant factor structure across clinical and non-clinical populations. Pain. 2002;96(3):319–24. doi: 10.1016/S0304-3959(01)00463-8. [DOI] [PubMed] [Google Scholar]
- 30.Osman A, Barrios FX, Gutierrez PM, et al. The Pain Catastrophizing Scale: further psychometric evaluation with adult samples. J Behav Med. 2000;23(4):351–65. doi: 10.1023/a:1005548801037. [DOI] [PubMed] [Google Scholar]
- 31.Waddell G, Newton M, Henderson I, et al. A Fear-Avoidance Beliefs Questionnaire (FABQ) and the role of fear-avoidance beliefs in chronic low back pain and disability. Pain. 1993;52(2):157–68. doi: 10.1016/0304-3959(93)90127-B. [DOI] [PubMed] [Google Scholar]
- 32.George SZ, Calley D, Valencia C, et al. Clinical Investigation of Pain-related Fear and Pain Catastrophizing for Patients With Low Back Pain. Clin J Pain. doi: 10.1097/AJP.0b013e3181f21414. [DOI] [PubMed] [Google Scholar]
- 33.George SZ, Valencia C, Beneciuk JM. A psychometric investigation of fear-avoidance model measures in patients with chronic low back pain. J Orthop Sports Phys Ther. 2010;40(4):197–205. doi: 10.2519/jospt.2010.3298. [DOI] [PubMed] [Google Scholar]
- 34.George SZ, Valencia C, Zeppieri G, Jr, et al. Development of a self-report measure of fearful activities for patients with low back pain: the fear of daily activities questionnaire. Phys Ther. 2009;89(9):969–79. doi: 10.2522/ptj.20090032. [DOI] [PMC free article] [PubMed] [Google Scholar]
- 35.Dworkin RH, Turk DC, Wyrwich KW, et al. Interpreting the clinical importance of treatment outcomes in chronic pain clinical trials: IMMPACT recommendations. J Pain. 2008;9(2):105–21. doi: 10.1016/j.jpain.2007.09.005. [DOI] [PubMed] [Google Scholar]
- 36.Jensen MP, Turner JA, Romano JM, et al. Comparative reliability and validity of chronic pain intensity measures. Pain. 1999;83(2):157–62. doi: 10.1016/s0304-3959(99)00101-3. [DOI] [PubMed] [Google Scholar]
- 37.Jensen MP, Turner LR, Turner JA, et al. The use of multiple-item scales for pain intensity measurement in chronic pain patients. Pain. 1996;67(1):35–40. doi: 10.1016/0304-3959(96)03078-3. [DOI] [PubMed] [Google Scholar]
- 38.Fairbank JC, Pynsent PB. The Oswestry Disability Index. Spine (Phila Pa 1976) 2000;25(22):2940–52. doi: 10.1097/00007632-200011150-00017. discussion 2952. [DOI] [PubMed] [Google Scholar]
- 39.Fritz JM, Irrgang JJ. A comparison of a modified Oswestry Low Back Pain Disability Questionnaire and the Quebec Back Pain Disability Scale. Phys Ther. 2001;81(2):776–88. doi: 10.1093/ptj/81.2.776. [DOI] [PubMed] [Google Scholar]
- 40.Milligan GA, Cooper MC. An examination of procedures for determining the number of clusters in a data set. Psychometrika. 1985;50(2):159–179. [Google Scholar]
- 41.Ketchen DJ, Shook CL. The application of cluster analysis in strategic management research: an analysis and critique. Strategic Management Journal. 1996;17:441–458. [Google Scholar]
- 42.Tabachnick BG, Fidell LS. Using Multivariate Statistics. 5. Boston, MA: Pearson /Allyn and Bacon; 2007. [Google Scholar]
- 43.Meyers LW, Gamst G, Guarino AJ. Applied Multivariate Research: Design and Interpretation. Thousand Oaks, CA: Sage Publications; 2006. [Google Scholar]
- 44.Severeijns R, Vlaeyen JW, van den Hout MA, et al. Pain catastrophizing predicts pain intensity, disability, and psychological distress independent of the level of physical impairment. Clin J Pain. 2001;17(2):165–72. doi: 10.1097/00002508-200106000-00009. [DOI] [PubMed] [Google Scholar]
- 45.Crombez G, Vlaeyen JW, Heuts PH, et al. Pain-related fear is more disabling than pain itself: evidence on the role of pain-related fear in chronic back pain disability. Pain. 1999;80(1–2):329–39. doi: 10.1016/s0304-3959(98)00229-2. [DOI] [PubMed] [Google Scholar]
- 46.Grotle M, Vollestad NK, Veierod MB, et al. Fear-avoidance beliefs and distress in relation to disability in acute and chronic low back pain. Pain. 2004;112(3):343–52. doi: 10.1016/j.pain.2004.09.020. [DOI] [PubMed] [Google Scholar]
- 47.George SZ, Calley D, Valencia C, et al. Clinical Investigation of Pain-related Fear and Pain Catastrophizing for Patients With Low Back Pain. Clin J Pain. 2011;27(2):108–15. doi: 10.1097/AJP.0b013e3181f21414. [DOI] [PubMed] [Google Scholar]
- 48.Sieben JM, Vlaeyen JW, Portegijs PJ, et al. A longitudinal study on the predictive validity of the fear-avoidance model in low back pain. Pain. 2005;117(1–2):162–70. doi: 10.1016/j.pain.2005.06.002. [DOI] [PubMed] [Google Scholar]
- 49.Foster NE, Thomas E, Bishop A, et al. Distinctiveness of psychological obstacles to recovery in low back pain patients in primary care. Pain. 2010;148(3):398–406. doi: 10.1016/j.pain.2009.11.002. [DOI] [PMC free article] [PubMed] [Google Scholar]
- 50.Hair JE, Anderson RE, Tatham RL, et al. Cluster Analysis. In: Boyd J, editor. Multivariate Data Analysis. Prentice Hall; Upper Saddle River, NJ: 1998. pp. 469–515. [Google Scholar]
- 51.Linton SJ, Hallden K. Can we screen for problematic back pain? A screening questionnaire for predicting outcome in acute and subacute back pain. Clin J Pain. 1998;14(3):209–15. doi: 10.1097/00002508-199809000-00007. [DOI] [PubMed] [Google Scholar]
- 52.Hill JC, Dunn KM, Lewis M, et al. A primary care back pain screening tool: identifying patient subgroups for initial treatment. Arthritis Rheum. 2008;59(5):632–41. doi: 10.1002/art.23563. [DOI] [PubMed] [Google Scholar]
- 53.George SZ, Wittmer VT, Fillingim RB, et al. Comparison of graded exercise and graded exposure clinical outcomes for patients with chronic low back pain. J Orthop Sports Phys Ther. 2010;40(11):694–704. doi: 10.2519/jospt.2010.3396. [DOI] [PMC free article] [PubMed] [Google Scholar]
- 54.Brookes ST, Whitely E, Egger M, et al. Subgroup analyses in randomized trials: risks of subgroup-specific analyses; power and sample size for the interaction test. J Clin Epidemiol. 2004;57(3):229–36. doi: 10.1016/j.jclinepi.2003.08.009. [DOI] [PubMed] [Google Scholar]