Abstract
We previously demonstrated that refeeding after a prolonged fast activates a subset of neurons in the ventral parvocellular subdivision of the paraventricular nucleus (PVNv) as a result of increased melanocortin signaling. To determine whether these neurons contribute to satiety by projecting to the nucleus tractus solitarius (NTS), the retrogradely transported marker substance, cholera toxin-β (CTB), was injected into the dorsal vagal complex of rats that were subsequently fasted and refed for 2 h. By double-labeling immunohistochemistry, CTB accumulation was found in the cytoplasm of the majority of refeeding-activated c-Fos neurons in the ventral parvocellular subdivision of the hypothalamic paraventricular nucleus (PVNv). In addition, a large number of refeeding-activated c-Fos-expressing neurons were observed in the lateral parvocellular subdivision (PVNl) that also contained CTB and were innervated by axon terminals of proopiomelanocortin neurons. To visualize the location of neuronal activation within the NTS by melanocortin-activated PVN neurons, α-MSH was focally injected into the PVN, resulting in an increased number of c-Fos-containing neurons in the PVN and in the NTS, primarily in the medial and commissural parts. All refeeding-activated neurons in the PVNv and PVNl expressed the mRNA of the glutamatergic marker, type 2 vesicular glutamate transporter (VGLUT2), indicating their glutamatergic phenotype, but only rare neurons contained oxytocin. These data suggest that melanocortin-activated neurons in the PVNv and PVNl may contribute to refeeding-induced satiety through effects on the NTS and may alter the sensitivity of NTS neurons to vagal satiety inputs via glutamate excitation.
The nucleus tractus solitarius (NTS) is known as a primary integration site for satiety signals involved in the termination of a meal (1, 2). Feeding stops after a certain amount of food has been consumed, and direct information about meal size from the gastrointestinal tract is carried to the NTS by the vagus nerve (1). Vagal mechanosensors in the mucosa and external muscle layers of the gastrointestinal tract sense the volume of ingested food (3, 4), whereas other vagal afferents in the gastric mucosa detect locally released satiety hormones, such as cholecystokinin, in response to a meal (5).
Although it is well established that the vagus nerve-NTS pathway has a critical role in the regulation of meal size (2), we recently demonstrated that during the early phase of refeeding after a fast, activation of the anorexigenic proopiomelanocortin (POMC) neurons in the hypothalamic arcuate nucleus and the subsequent activation of melanocortin target neurons in the ventral parvocellular subdivision of the hypothalamic paraventricular nucleus (PVNv) play a critical role in the determination of meal size during the first 2 h of refeeding (6). These data suggest that in addition to the NTS, neuronal populations in the forebrain also contribute to the regulation of meal size. We hypothesized that refeeding-activated neurons of the PVNv project to the medial part of the NTS in which neurons responsive to gastric distension are situated and modulate the sensitivity of these NTS neurons to vagal inputs. To elucidate the anatomical basis of this hypothesis, we determined whether refeeding-activated PVNv neurons project to the NTS. In addition, we determined whether melanocortin sensitive paraventricular nucleus (PVN) neurons can induce neural activation in the NTS and examined the potential chemical mediators of this pathway.
Materials and Methods
Animals
Adult, male, Sprague Dawley (Taconic Farms, Germantown, NY) and Wistar rats (TOXI-COOP KKT, Budapest, Hungary) weighing 240–300 g were used throughout this study. Animals were housed under standard conditions (lights on between 0600 and 1800 h, temperature 22 ± 1 C, rat chow, and water ad libitum before the experiments). All experimental protocols were reviewed and approved by the Institutional Animal Care and Use Committee at Tufts Medical Center and the Animal Welfare Committee at the Institute of Experimental Medicine of the Hungarian Academy of Sciences.
Experiment 1: identification of refeeding-activated neurons in the PVN that project to the dorsal vagal complex
Rats were anesthetized ip with ketamine/xylazine (ketamine 50 mg/kg, xylazine 10 mg/kg body weight) and their heads positioned in a stereotaxic apparatus with bregma and lambda in the horizontal plane. Through a burr hole in the skull, a glass micropipette (20 μm outer tip diameter) containing 0.5% solution of the retrograde tracer, cholera toxin-β subunit (CTB; List Biological Laboratories, Campbell, CA), was lowered into the brain at stereotaxic coordinates corresponding to the NTS based on the atlas of Paxinos and Watson (7): 5.0 mm posterior and 1.9 mm dorsal to the interaural line and 0.5 mm lateral to the midline. The tracer was deposited by iontophoresis for 15 min (6 μA positive current, pulsed on-off at 10 sec intervals) using an iontophoretic apparatus (Stoelting, Wood Dale, IL). After 4 d, the animals were fasted for 64 h and then given free access to food for 2 h before euthanasia. The animals were deeply anesthetized with an overdose of pentobarbital (50 mg/kg; Ovation Pharmaceuticals, Inc., Deerfield, IL) and perfused transcardially with 20 ml 0.01 m PBS (pH 7.4) for 10–20 sec followed by 4% paraformaldehyde in 0.1 m phosphate buffer (pH 7.4) for 5 min. The brains were postfixed by immersion in the same fixative for 2 h and immersed in 30% sucrose in 0.01 m PBS at 4 C overnight. One-in-four series of 25-μm-thick coronal sections were cut through the rostrocaudal extent of the medulla and the hypothalamus on a cryostat (CM 3050S; Leica Microsystems GmbH, Wetzlar, Germany) and collected into antifreeze solution (30% ethylene glycol; 25% glycerol; 0.05 m phosphate buffer) and stored at −20 C until their use for immunohistochemistry.
Single-labeling immunohistochemistry for detection of CTB was performed to evaluate the injection sites in the medulla. Sections were pretreated with 0.5% H2O2 and 0.5% Triton X-100 in PBS for 15 min. Nonspecific antibody binding was reduced by treatment in 2% normal horse serum in PBS. Sections were incubated in goat CTB antiserum (List Biological Laboratories) at 1:20,000, diluted in PBS containing 2% normal horse serum and 0.2% sodium azide (antibody diluent) for 1 d at room temperature. After washing in PBS, sections were incubated in biotinylated donkey antisheep IgG (Jackson ImmunoResearch, West Grove, PA) at 1:500 for 2 h at room temperature, followed by incubation in avidin-biotin-peroxidase complex (ABC Elite kit; Vector Laboratories, Burlingame, CA) at 1:1000 dilution for 1 h. After rinses in PBS, the tissue-bound peroxidase activity was visualized by 0.05% diaminobenzidine and 0.15% nickel ammonium sulfate with 0.005% H2O2 in 0.05 m Tris buffer at pH 7.6. The sections were mounted onto glass slides and coverslipped with DPX mounting medium (Sigma-Aldrich, St. Louis, MO).
Double-labeling immunofluorescence was used to study the presence of c-Fos protein in neurons of the PVN that accumulated CTB by retrograde transport from the dorsal vagal complex. After standard pretreatment as described above, sections were incubated in a mixture of primary antisera: goat CTB antiserum (List Biological Laboratories) at 1:2,000 and rabbit c-Fos antiserum (Calbiochem, catalog no. PC-38; EMD Chemicals, Gibbstown, NJ) at 1:10,000 for 2 d at 4 C. After washes in PBS, sections were immersed in a cocktail of Cy3-conjugated donkey antisheep IgG at 1:200 (Jackson ImmunoResearch) and biotinylated donkey antirabbit IgG (Jackson ImmunoResearch; 1:500) and incubated for 2 h at room temperature. Sections were then incubated in ABC at 1:1000 for 2 h and the immunolabeling amplified with biotinylated tyramide using the tyramide signal amplification kit (PerkinElmer, Waltham, MA). After further washes, the sections were incubated in fluorescein-conjugated streptavidin (1:300; Jackson ImmunoResearch) for 2 h, mounted onto glass slides, and coverslipped with Vectashield mounting medium with 4′,6′-diamidino-2-phenylindole (DAPI) (Vector Laboratories). Images were taken using a Zeiss Axioplan 2 microscope equipped with a RT SPOT digital camera (Diagnostic Instruments, Sterling Heights, MI). Adobe Photoshop 7.0 (Adobe Systems Inc., San Jose, CA) was used to create composite images and for the modification of brightness and contrast of the images. C-Fos/CTB and single-labeled c-Fos neurons in the parvocellular PVN were counted in every fourth section (five to six sections per PVN) from three brains, and the percentage of CTB-containing c-Fos neurons was calculated (mean ± sem). Line drawings representing the distribution of c-Fos/CTB and c-Fos neurons were created with Corel Draw 11 (Corel Corp., Ottawa, Canada).
Experiment 2: innervation of refeeding-activated neurons in the lateral parvocellular subdivision of the PVN by POMC-containing axons
After immunofluorescent detection of c-Fos as described above, sections were incubated in rabbit POMC antiserum (1:2000; Phoenix Pharmaceuticals Inc., Burlingame, CA) and then in Alexa 555-conjugated donkey antirabbit IgG (1:500; Invitrogen, Carlsbad, CA). To label the cytoplasm of neurons, the sections were incubated in mouse antiserum against human neuronal protein (HUC/D; 1:500; Invitrogen) and Cy5-conjugated donkey antimouse IgG (1:100; Jackson ImmunoResearch). The sections were mounted onto glass slides, coverslipped with Vectashield mounting medium (Vector Laboratories), and imaged using a Bio-Rad Radiance 2000 confocal microscope (Bio-Rad Laboratories, Hercules, CA).
For electron microscopy, fasted rats were refed for 2 h and then anesthetized with an ip injection of ketamine and xylazine. Animals were perfused transcardially with PBS followed by 50 ml 4% paraformaldehyde in 0.1 m Na-acetate buffer (pH 6), and 150 ml 4% paraformaldehyde in 0.1 m borax buffer (pH 8.5). The brains were postfixed in 4% paraformaldehyde in 0.1 m sodium phosphate buffer, and 25 μm coronal sections were cut on a Vibratome (VT1000S; Leica Microsystems). Endogenous peroxidase activity was eliminated with 0.5% H2O2 (15 min treatment, diluted in PBS). The sections were cryoprotected with 15% sucrose for 30 min and then 30% sucrose in PBS overnight, followed by permeabilization using three sequential freeze-thaw cycles in liquid nitrogen. Finally, 2% normal horse serum was applied (20 min) to prevent nonspecific antibody binding. The pretreated sections were incubated in the following mixture of primary antibodies: rabbit antiserum against c-Fos (1:4,000) and sheep antiserum against α-MSH (1:80,000; gift from Jeffrey B. Tatro, Tufts Medical Center, Boston, MA) for 4 d at 4 C. The sections were then rinsed in PBS and 0.1% cold water fish gelatin/1% BSA in PBS and incubated in a mixture of biotinylated donkey antisheep IgG (1:500; Jackson ImmunoResearch) and donkey antirabbit IgG conjugated with 0.8 nm colloidal gold (Electron Microscopy Sciences, Fort Washington, PA) diluted at 1:100 in PBS containing 0.1% cold water fish gelatin and 1% BSA for 12 h. The sections were washed in the same diluent and PBS, followed by a 10-min treatment in 1.25% glutaraldehyde in PBS. After rinsing in 1× Aurion ECS buffer, the gold particles were silver intensified with the R-Gent SE-LM kit (Aurion, Wageningen, The Netherlands). The sections were then treated in ABC complex (1:1000) for 1h, and α-MSH was visualized with NiDAB developer [0.05% diaminobenzidine, 0.15% nickel-ammonium-sulfate and 0.005% H2O2 in 0.05 m Tris buffer]. Sections were osmicated and then treated with 2% uranyl acetate in 70% ethanol for 30 min. After dehydration in an ascending series of ethanol and propylene oxide, the sections were flat embedded in Durcupan ACM epoxy resin (Sigma-Aldrich) on liquid release agent (Electron Microscopy Sciences)-coated slides and polymerized at 56 C for 2 d. The embedded sections were photographed and then cut into ultrathin sections (50–60 nm) with a Leica Ultracut UCT ultramicrotome (Leica Microsystems). The ultrathin sections were mounted onto Formvar-coated single slot grids, contrasted with 2% lead citrate, and examined with a Jeol-100C transmission electron microscope (Jeol Inc., Peabody, MA).
Experiment 3: effect of intra-PVN α-MSH administration on c-Fos activation in NTS neurons
Animals were anesthetized with ketamine/xylazine (ketamine 50 mg/kg, xylazine 10 mg/kg body weight, ip), and a 28-gauge stainless steel guide cannula (Plastics One Inc., Roanoke, VA) was implanted above the right PVN under stereotaxic control (coordinates from bregma: anteroposterior, −1.8 mm; lateral, −0.4 mm; and ventral, 6.8 mm). The cannula was secured to the skull with three stainless steel screws and dental cement and temporarily occluded with a dummy cannula. The rats were made accustomed to handling and given daily mock injections consisting of removal and reinsertion of the dummy cannula for 1 wk before experimentation. Animals were fasted for 64 h and divided into two groups (n = 4 each). Animals in the first group received 1 μl artificial cerebrospinal fluid (aCSF; 140 mm NaCl; 3.35 mm KCl; 1.15 mm MgCl2; 1.26 mm CaCl2; 1.2 mm Na2HPO4; and 0.3 mm NaH2PO4, pH 7.4) containing 0.05% BSA, whereas animals in the other group received 0.6 nmol α-MSH (Phoenix Pharmaceuticals) in an equivalent amount of aCSF. All the intra-PVN infusions were made in freely moving animals through a 30-gauge needle that extended 1 mm below the guide cannula. The needle was connected by polyethylene tubing to a 1-cc GlassPak syringe (BD Diagnostic Systems, Sparks, MD), and injections were made over 2 min by a microprocessor-controlled infusion pump (Bee electronic minipump; Bioanalytical Systems, West Lafayette, IN). Two hours after the aCSF or α-MSH infusion into the PVN, all animals were overdosed with pentobarbital (50 mg/kg) and transcardially perfused as described above. The position of the cannula was verified on sections of the PVN. Immunofluorescent labeling of c-Fos was performed as described above on every fourth section through the NTS. Images were taken using a Zeiss Axioplan 2 microscope equipped with a RT SPOT digital camera (Diagnostic Instruments).
Experiment 4: elucidation of the phenotype of refeeding-activated neurons in the PVN
To determine whether refeeding-activated PVN neurons express type 2 vesicular glutamate transporter (VGLUT2), a marker of glutamatergic neurons, the immunofluorescent detection of c-Fos was combined with isotopic in situ hybridization for VGLUT2 mRNA. Rats fasted for 64 h (water ad libitum) (n = 4) and rats fasted for 64 h and refed for 2 h (n = 4) before perfusion were used. The animals were deeply anesthetized with an overdose of pentobarbital and perfused as described above. One-in-four series of 20-μm-thick coronal sections were cut through the rostrocaudal extent of the PVN on a cryostat. Sections were collected into antifreeze solution and stored at −20 C until use.
Sections were washed in a 2-fold concentration of standard sodium citrate (SSC), acetylated with 0.25% acetic anhydride in 0.1 m triethanolamine for 10 min and then treated with 50, 70, and 50% acetone, for 5, 10, and 5 min, respectively. After further washes in 2×SSC for 2×5 min, the sections were hybridized with [35S]-uridine 5-triphosphate -labeled (PerkinElmer) cRNA probe for rat VGLUT2. The 35S-labeled antisense cRNA probe was synthesized using a cDNA template corresponding to bases 522-1400 of VGLUT2 mRNA [GenBank accession no. NM 053427; gift from Dr. Erik Hrabovszky, Institute of Experimental Medicine, Budapest, Hungary (8)]. The hybridization was performed in polypropylene tubes in hybridization buffer (50% formamide; 2× SSC; 0.25 m Tris buffer, pH 8.0; Denhardt's solution; 10% dextran sulfate; 0.5% sodium dodecyl sulfate; 265 μg/ml denatured salmon sperm DNA) containing the 35S-labeled VGLUT2 probe (50,000 cpm/μl) for 16 h at 52 C. The sections were washed in 1× SSC for 15 min and then treated with ribonuclease A (50 μg/ml; Sigma-Aldrich) for 1 h at 37 C. After additional washes in 1×SSC (15 min), 0.5×SSC (15 min), and 0.1×SSC (2 × 30 min) at 65 C, the sections were treated with the mixture of 0.5% Triton X-100 and 0.5% H2O2 for 15 min, followed by immersion in maleate buffer (0.1 m maleic acid; 0.15 m NaCl, pH 7.5) for 10 min and in 1% blocking reagent for nucleic acid hybridization (Roche, Basel, Switzerland) diluted in maleate buffer. The sections were then incubated in rabbit c-Fos antiserum (Calbiochem) at 1:4000 for 2 d at 4 C. After washes in PBS, sections were immersed in biotinylated donkey antirabbit IgG (Jackson ImmunoResearch; 1:500) and incubated for 2 h at room temperature. After rinses in PBS, sections were transferred into ABC at 1:1000 for 2 h. The sections were rinsed in PBS and then amplified with biotinylated tyramide using the tyramide signal amplification kit as previously described. After further washes, the sections were incubated in Cy3-conjugated streptavidin (1:250; Jackson ImmunoResearch). Sections were mounted onto gelatin-coated glass slides and dipped into Kodak NTB autoradiography emulsion (Eastman Kodak, Rochester, NY), placed in light-tight boxes containing desiccant, and stored at 4 C. After 28 d of exposure, the autoradiograms were developed using Kodak D19 developer, and slides were coverslipped with DPX mounting medium (Sigma-Aldrich).
The fluorescent signal of Cy3 and the autoradiograms were studied under the appropriate fluorescent filter set and by dark-field illumination, respectively, using a Zeiss Axio Imager M1 epifluorescent microscope (Carl Zeiss Ltd., Göttingen, Germany). The images were captured with an AxioCamMRc5 digital camera (Carl Zeiss). Adobe Photoshop 7.0 software was used to create composite images for analysis.
Oxytocin expression of refeeding-activated c-Fos neurons was studied on double-immunofluorescent sections of refed rats (n = 4). Sections were immunolabeled for c-Fos as described above and then incubated in a mouse monoclonal antibody against oxytocin-neurophysin (code PS38 at1:500; generous gift of Dr. H. Gainer, National Institute of Neurological Disorders and Stroke, National Institutes of Health, Bethesda, MD) for 2 d at 4 C, followed by Cy3-conjugated antimouse IgG (1:250; Jackson ImmunoResearch). Images were taken with a Zeiss Axioplan 2 microscope equipped with a RT SPOT digital camera.
Antibody characterization
According to the manufacturer, CTB antiserum forms an immunoprecipitation band against a 0.5 mg/ml solution of CTB subunit. Specificity of the antiserum was verified by the lack of labeling in sections from animals without CTB injections. The specificity of mouse monoclonal antioxytocin-neurophysin antibody has been extensively studied and established by both liquid and solid-phase assays, establishing the high specificity to oxytocin-neurophysin and no detectable cross-reactivity with vasopressin-associated neurophysin or other peptides (9). By immunostaining, the distribution of labeled cells in the PVN and supraoptic nucleus was identical with previous descriptions. Rabbit c-Fos antiserum was raised against a synthetic peptide corresponding to amino acids 4–17 of human c-Fos. It recognizes the 55-kDa c-Fos and 62-kDa v-Fos proteins. Rabbit POMC antibody (Phoenix Pharmaceuticals) was raised against the porcine POMC precursor (27–52). The immunogenic sequence is recognized by this antibody in an ELISA at 1:25,600 dilution. Characterization of the HUC/D antibody and the sheep antiserum against α-MSH were as described previously (10).
Results
Refeeding-induced c-Fos expression in the PVN and NTS
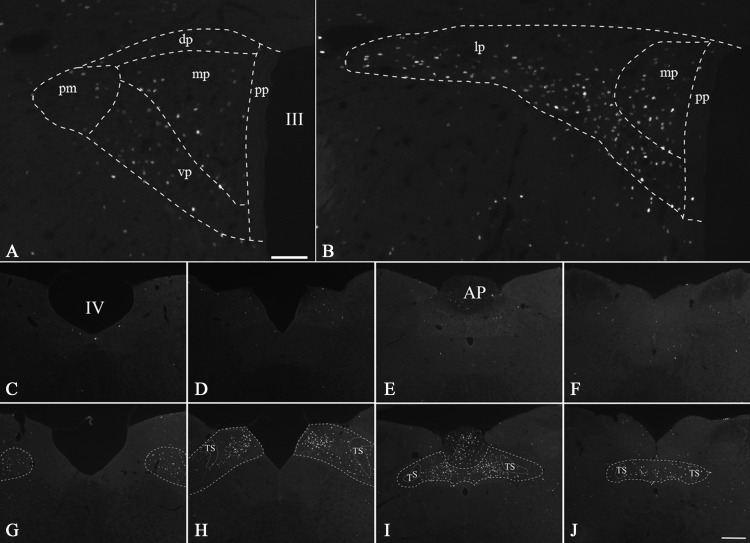
In normally fed and fasted animals, only scattered c-Fos-expressing neurons were present in the PVN as previously observed (6). Two hours after refeeding, a large number of strongly c-Fos-immunoreactive (IR) neurons were detected in specific regions of the PVN (Fig. 1). Most rostrally, at the level of the posterior magnocellular subdivision, c-Fos-expressing neurons were present in the PVNv (Fig. 1A) and in the neighboring ventrolateral areas of the medial parvocellular subdivision. The density of c-Fos-expressing neurons increased caudally, in which c-Fos expressing neurons formed a continuous group that occupied the ventral and lateral parts of the lateral parvocellular subdivision of the hypothalamic PVN (PVNl) (Fig. 1B). Scattered c-Fos-expressing cells were found in the dorsal and periventricular parvocellular subdivisions. In some of the refed animals, c-Fos expression also appeared in the posterior magnocellular subdivision, generally with lighter intensity of immunolabeling (data not shown). In the brainstem, intense c-Fos-expressing neurons were identified through the rostral-caudal extent of the NTS but largely confined to the medial and commissural subdivisions (Fig. 1, G–J). c-Fos immunoreactivity was also present in the area postrema (Fig. 1I). No or minimal c-Fos expression could be detected in the NTS of fasted, control animals (Fig. 1 C–F).
Fig. 1.
Distribution of c-Fos-IR neurons in the middle (A) and caudal (B) levels of the PVN after refeeding and in the lower brainstem after refeeding (G–J) or while fasting (C–F). Note the high number of c-Fos-IR neurons in the ventral (A) and lateral parvocellular (B) subdivisions and in the posterior part of the medial parvocellular subdivision (B). Subdivisions of the PVN and the NTS were outlined based on 4′,6′-diamidino-2-phenylindole (DAPI) staining and dark-field images of the sections. In the brainstem, intense c-Fos-immunoreactivity is observed in the medial (G and H) and commissural (I and J) subdivisions of the NTS. Minimal immunolabeling is observed in the NTS in the fasted animals. III, Third ventricle; IV, fourth ventricle; AP, area postrema; dp, dorsal parvocellular subdivision; lp, lateral parvocellular subdivision; mp, medial parvocellular subdivision; pm, posterior magnocellular subdivision; pp, periventricular parvocellular subdivision; TS, solitary tract; vp, ventral parvocellular subdivision. Scale bar in A, 100 μm, scale bar in C, 250 μm.
Innervation of c-Fos-activated PVNl neurons by POMC-IR axon terminals
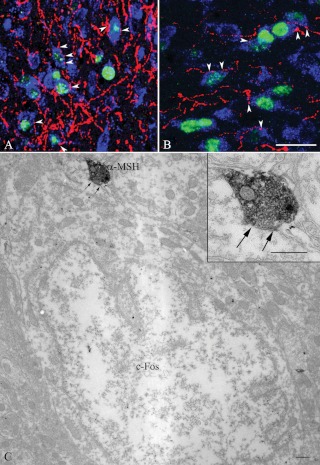
As previously recognized (6), axons of POMC neurons densely innervated c-Fos neurons in the PVNv (Fig. 2A). Similarly, POMC axon terminals densely innervated the PVNl and found in close juxtaposition to c-Fos-containing neurons (Fig. 2B). At the ultrastructural level, α-MSH-IR axon terminals labeled with the electron dense NiDAB were observed to form synaptic associations with the perikarya of neurons containing silver grains in their cytoplasm and nucleus denoting the c-Fos-immunoreactivity (Fig. 2C).
Fig. 2.
Association of POMC-IR axon varicosities (red) with refeeding-activated neurons in the PVNv (A) and PVNl (B). The c-Fos-IR nuclei are labeled in green, and the HUC/D-immunoreactivity (labeling neuronal cytoplasm) is visualized in blue. The majority of c-Fos-containing neurons are contacted by POMC-IR axon varicosities in both subnuclei (arrowheads). C, Electron micrograph showing the synaptic association between an α-MSH-IR axon varicosity (labeled with electron dense NiDAB) and a neuronal perikaryon-containing c-Fos-immunoreactivity (labeled with silver grains) in its cytoplasm and nucleus. Inset shows a higher magnification of the α-MSH-IR varicosity. Arrows point to the synapse. Scale bar on B, 25 μm corresponds to A and B; scale bar on C and the inset, 0.5 μm.
Refeeding-activated neurons of the PVN project to the dorsal vagal complex
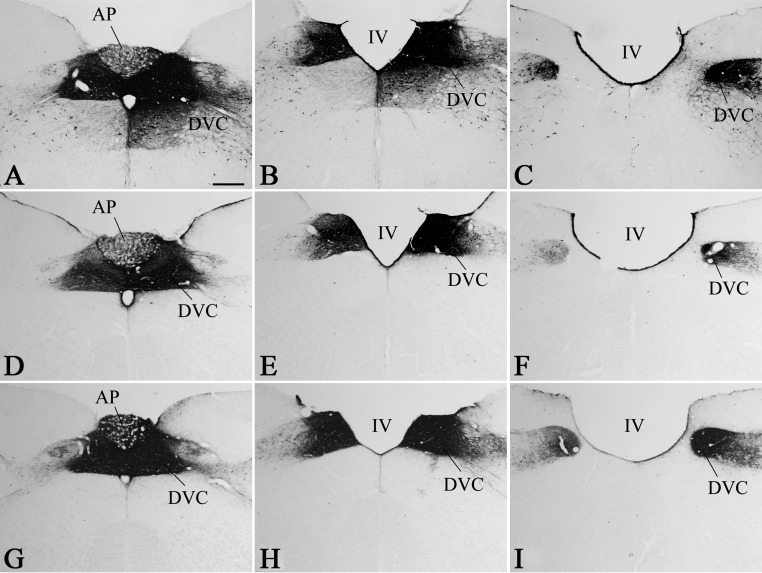
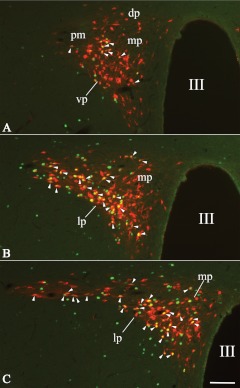
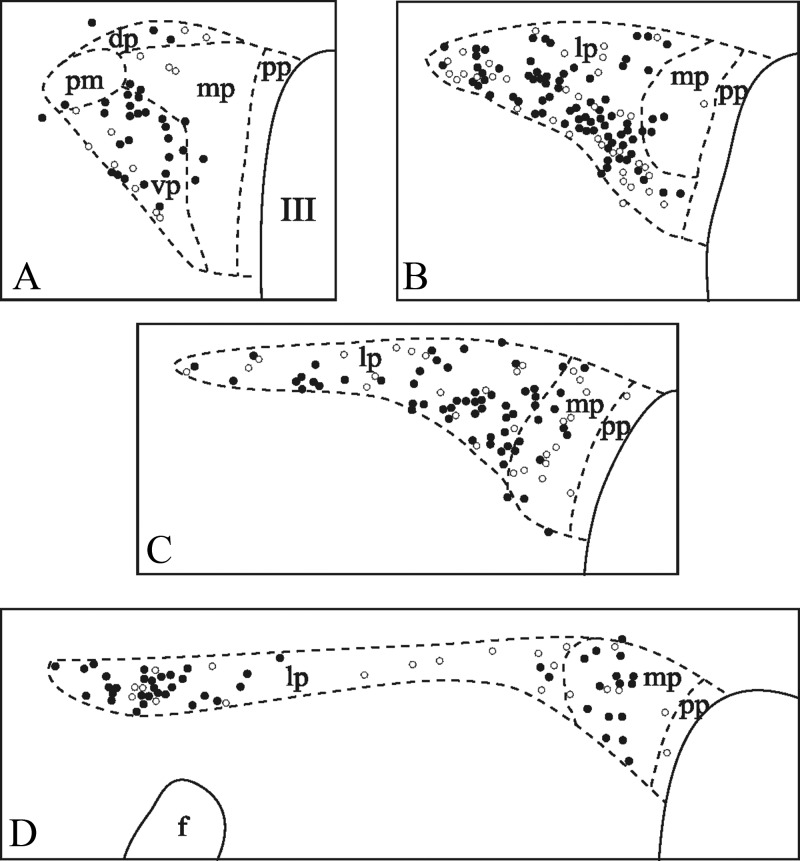
Because refeeding-activated neurons occupy the area of the PVN that is known to send descending projections to the NTS, the retrograde neuronal tracer CTB was injected into the NTS to examine the putative NTS projection of refeeding-activated neurons of the PVN. In all animals, the CTB injection sites covered most of the rostrocaudal extent of the dorsal vagal complex, that is, the NTS and the dorsal motor nucleus of the vagus nerve (Fig. 3). Retrogradely labeled neurons were found on both sides of the PVN in a distribution pattern identical to those reported in previous retrograde tracing studies (11). The distribution of refeeding-activated c-Fos-IR cells in the tracer-injected animals was the same as in intact animals, although the number of c-Fos-expressing cells was slightly reduced. Double-labeled CTB/c-Fos cells were distributed evenly within the c-Fos-expressing cell group in the PVN. The vast majority of these double-labeled neurons were located in the PVNv and PVNl as well as in the ventral and posterior parts of the medial parvocellular subdivision (Figs. 4 and 5). The percentage of c-Fos-expressing neurons containing CTB-immunoreactivity in each subdivision of the PVN was 70.4 ± 4.2% in the PVNv, 65.0 ± 3.2% in the PVNl, and 59.2 ± 8.6% in the medial parvocellular subdivision. Conversely, the percentage of CTB-accumulating neurons containing c-Fos was 22.8 ± 0.64% in the PVNv, 39.4 ± 5.5% in the PVNl, and 13.1 ± 3.2 in the medial parvocellular subdivision. Scattered CTB/c-Fos neurons were also found in the dorsal parvocellular and posterior magnocellular subdivisions and in neurons just outside the border of the PVN (Fig. 5).
Fig. 3.
Location of the CTB injection sites in three animals (A–C, D–F, and G–I). Photomicrographs show the extent of CTB injections at the caudal (A, D, and G), middle (B, E, and H, and rostral (C, F, and I) levels of the NTS. IV, Fourth ventricle; AP, area postrema; DVC, dorsal vagal complex. Scale bar, 100 μm.
Fig. 4.
Distribution of refeeding-activated c-Fos-IR neurons that project to the dorsal vagal complex in three, different, rostrocaudal levels of the PVN. Rats that had been injected with CTB into the dorsal vagal complex were fasted and then refed to induce c-Fos expression in the PVN. The CTB is labeled red and c-Fos is labeled green. Arrowheads point to the double-labeled cells. III, Third ventricle; dp, dorsal parvocellular subdivision; lp, lateral parvocellular subdivision; mp, medial parvocellular subdivision; pm, posterior magnocellular subdivision; vp, ventral parvocellular subdivision. Scale bar, 100 μm.
Fig. 5.
Schematic maps illustrate the distribution of neurons containing c-Fos (open circles) and both CTB and c-Fos (filled circles) in different subdivisions of the PVN of refed rats injected with CTB into the dorsal vagal complex. One circle represents one cell. III, Third ventricle; dp, dorsal parvocellular subdivision; f, fornix; lp, lateral parvocellular subdivision; mp, medial parvocellular subdivision; pm, posterior magnocellular subdivision; pp, periventricular parvocellular subdivision; vp, ventral parvocellular subdivision.
Activation of NTS neurons after injection of α-MSH into the PVN
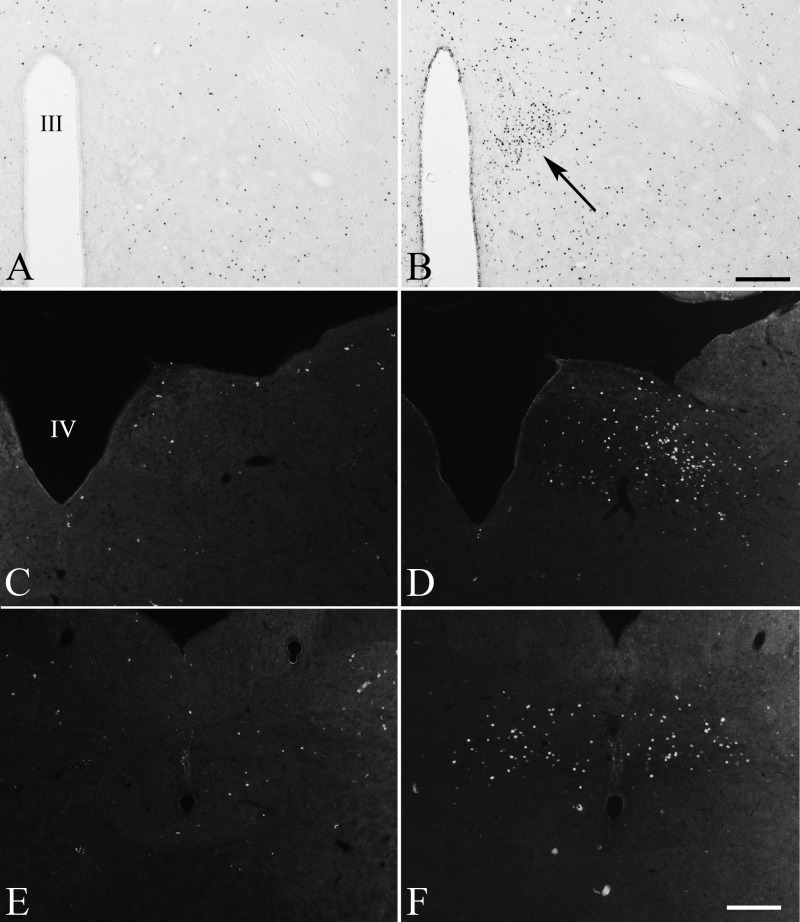
In fasted animals, only minimal c-Fos expression was present in the PVN after the stereotaxic injection of aCSF, but a striking increase was observed after α-MSH administration, particularly in the PVNv (Fig. 6, A and B). Similarly, only a few c-Fos-IR neurons were observed in the NTS after injection of vehicle into the PVN (Fig. 6, C and E), whereas administration of α-MSH markedly increased the number of c-Fos-IR cells, primarily in the medial and commissural parts of the NTS (Fig. 6, D and F). Scattered c-Fos-IR nuclei were also observed in other parts of the NTS.
Fig. 6.
Effect of stereotaxic injection of α-MSH into the PVN of fasted animals on neuronal activation. c-Fos-immunoreactivity is observed in the PVNv (arrow) in animals injected with α-MSH (B) but absent from the PVNv in vehicle-injected controls (A). In the brainstem, c-Fos expression is observed in middle (D) and caudal (F) levels of the NTS in fasted rats receiving intra-PVN administration of α-MSH, but relatively little immunoreactivity is observed in the vehicle-injected controls (C and E). III, Third ventricle; IV, fourth ventricle. Scale bars, 200 μm.
Phenotype of refeeding-activated cells in the PVN
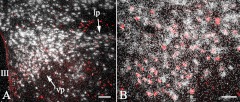
Because we observed that stimulation of PVN neurons by α-MSH-activated neurons in the NTS, we determined whether glutamate, the main excitatory transmitter, is utilized by PVNv and PVNl neurons activated by refeeding, using VGLUT2 mRNA as the glutamatergic marker. A large number of neurons in the PVN were labeled with silver grains, denoting the presence of VGLUT2 mRNA in both fasted and refed animals. Accumulation of silver grains was observed over all c-Fos-IR neurons in the PVN of refed animals, establishing the glutamatergic phenotype of refeeding-activated PVNv and PVNl neurons (Fig. 7). In fasted animals, only scattered c-Fos-IR neurons were observed (data not shown).
Fig. 7.
Colocalization of c-Fos and VGLUT2 in the PVN of animals refed for 2 h after fasting. Silver grains denoting the VGLUT2 mRNA are located over all c-Fos-IR neurons (red) in both the PVNv (vp) and PVNl (lp) (A). Higher-magnification image illustrates the colocalization of c-Fos and VGLUT2 mRNA in the PVNv (B). III, Third ventricle; lp, lateral parvocellular subdivision; vp, ventral parvocellular subdivision. Scale bar on A, 100 μm; scale bar on B, 50 μm.
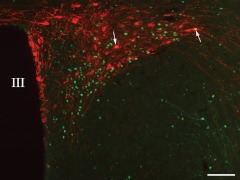
To determine whether refeeding-activated PVN neurons are a homologous population to NTS-projecting, leucine-activated oxytocinergic PVN neurons of the mouse, also believed to be activated via POMC neurons of the arcuate nucleus (12), we examined oxytocin expression in refeeding-activated neurons. The vast majority of c-Fos-IR neurons, however, did not contain oxytocin, and c-Fos was generally absent in oxytocin-IR neurons of the PVNv and PVNl, with only occasional exceptions (Fig. 8).
Fig. 8.
Distribution of c-Fos- (green) and oxytocin immunoreactivity (red) in the PVN of refed rats. Colocalization of c-Fos and oxytocin (arrows) was observed in only rare neurons. III, Third ventricle. Scale bar, 100 μm.
Discussion
To further characterize the neuronal pathways that mediate the effects of melanocortins during refeeding, we studied the projection of refeeding-activated neurons in the PVN to the NTS and their chemical phenotype. In addition to the demonstration that melanocortin-responsive neurons in the PVN activate c-Fos in specific subregions in the NTS and use glutamate as a neurotransmitter, we demonstrate that neurons residing in the PVNl similarly show activation 2 h after refeeding as PVNv neurons and project to the NTS.
In general, the PVNv and PVNl are known to comprise parts of the descending division of the PVN (13). Both subnuclei project to important vegetative centers in the brainstem and spinal cord such as the dorsal vagal complex and interomediolateral column of the thoracic spinal cord (14), suggesting they have an important role in the regulation of autonomic function. Indeed, the PVNv is involved in the regulation of cardiovascular, liver, and adrenal function through polysynaptic pathways involving autonomic centers in the brainstem and spinal cord and mediates activation of the sympathetic nervous system in response to central administration of CRH (15–17). The observation that refeeding activates a subset of PVNv neurons 2 h after fasting animals have been refed when satiety occurs (6), whereas energy expenditure is increased only 24 h after refeeding (18–21), suggests that PVNv neurons are a functionally heterogeneous group and that different subsets of PVNv neurons may be involved in the regulation of the sympathetic nervous system and in the regulation of food intake. Although very little is known about the physiological function of the PVNl, the observation in this study, that like the PVNv, PVNl neurons are innervated by axons containing α-MSH and respond to refeeding, indicates that neurons of PVNv and PVNl are similarly regulated by melanocortin signaling. We propose therefore that together with the PVNv, PVNl neurons are part of a single, functional unit despite anatomical separation by the posterior magnocellular division of the PVN.
To determine whether the brainstem is a major target area for the projection of refeeding-responsive PVNv and PVNl neurons, the retrogradely transported marker substance, CTB, was injected into intermediate and caudal regions of the NTS, in which feeding induces c-Fos activation, even after unilateral cervical vagotomy (22). As anticipated, the majority of c-Fos-labeled neurons in the PVNv and PVNl after refeeding contained CTB, indicative of the importance of the NTS in mediating satiety signals generated by the PVNv and PVNl through melanocortin signaling. These observations are consistent with previous reports that brainstem sites, including the NTS, have a major role in integrating humoral and neuronal signals involved in the termination of food intake (1). In addition, chronically decerebrate rats with complete disconnection of the forebrain and brainstem can still regulate the meal size and respond to experimental manipulations that alter the food intake (2) but are unable to adjust their meal size when the number of daily meals is decreased. Thus, input from forebrain neuronal sites would appear to be an essential component for the regulation of meal size (2).
The NTS is a complex nucleus comprised of a number of subdivisions (23). The main peripheral input to the NTS is through the vagus nerve and is viscerotopically organized throughout the nucleus (23). Thus, inputs from the esophagus and stomach innervate the neurons of the gelatinosus subnucleus, the nucleus commissuralis, and the medial nucleus of the NTS (24), whereas palatal and pharyngeal afferents innervate the interstitial and intermediate subnuclei (25). Pulmonary and cardiovascular afferents primarily innervate the lateral subnuclei (26, 27). To identify subnuclei in the NTS regulated by refeeding-activated PVNv and PVNl neurons by melanocortin signaling, α-MSH was stereotaxically administered into the PVN, and its effects on c-Fos activation in the brainstem were studied 2 h after injection. Two regions of the NTS showed high concentration of c-Fos immunofluorescent neurons: the medial nucleus of the NTS and the nucleus commissuralis. These data indicate, therefore, that the majority of refeeding-responsive neurons in the PVN project primarily to the regions of the brainstem innervated by branches of vagus nerve carrying information from the esophagus and stomach. Because the vagus-NTS pathway has a critical role in the determination of meal size (28), we hypothesize that the medial subnuclei of the NTS functions as a major integrating center for refeeding-related signals from both the hypothalamus and upper gastrointestinal tract. Because brainstem nuclei, alone, have been shown to be sufficient to regulate meal size (2), we further propose that the arcuate nucleus-PVNv/PVNl-NTS pathway modulates the sensitivity of medial subnuclei NTS neurons to satiety signals originating from the gastrointestinal tract during refeeding, in concert with recent observations by Blevins et al. (29), demonstrating that melanocortin signaling in the PVN can attenuate the anorexigenic effects of peripherally administered cholecystokinin (CCK).
In addition to the vagus nerve, the area postrema, a region of the brainstem necessary to relay the anorexic effects of amylin to the central nervous system (30–32), also innervates the medial nucleus of the NTS (33). Furthermore, a subpopulation of neurons in the medial subnucleus of the NTS also expresses leptin receptors (34). Thus, the medial subnucleus of the NTS would appear to be the recipient of multiple converging signals involved in the regulation of food intake and may be positioned to integrate a wide variety of signals involved in the regulation of appetite and satiety.
Recent studies by Blouet et al. (12) have proposed that oxytocin, derived from the PVN, mediates the anorexic effects of leucine through activation of melanocortin-producing neurons in the arcuate nucleus. Furthermore, they have shown the effect of increased melanocortin tone is mediated toward the NTS via NTS-projecting oxytocinergic neurons of the PVN (12). Nevertheless, only rare refeeding-activated PVNv and PVNl neurons were observed to contain oxytocin, indicating that this peptide may not have an important role in transmitting the satiety effects of melanocortin signaling to the NTS during refeeding via the c-Fos-activated PVNv and PVNl neurons. We cannot exclude the possibility, however, that oxytocin may contribute to anorexia associated with refeeding through other pathways or at later time points. Nevertheless, this raises the intriguing possibility that the effects of refeeding and leucine may be mediated through parallel, but different arcuate nucleus-PVN-NTS pathways, despite the fact that both pathways are activated by α-MSH-synthesizing neurons of the arcuate nucleus. Heterogeneity in the regulation of α-MSH-producing neurons in the arcuate nucleus by leptin through the long form of the leptin receptor vs. serotonin through hydroxytryptamine 2c receptors has been previously demonstrated in transgenic animals (35). Further studies are required to determine whether refeeding and leucine target different subsets of α-MSH-producing neurons in the arcuate nucleus or target the same neurons but allow different stimuli to activate either oxytocin or glutamate neurons in the PVN.
Although the mediators relaying melanocortin signaling from refeeding-activated neurons in the PVNv/PVNl to the NTS require further characterization, it is of particular interest that all of these neurons express VGLUT2 mRNA, indicating that they are glutamatergic. This observation is particularly intriguing because the vagus nerve uses glutamate as its main neurotransmitter on NTS neurons (36), and antagonizing glutamate signaling in the brainstem has been reported to increase food intake (37). In addition, the satiety peptide, CCK-8, is believed to exert its effects on the NTS by modulating glutamate release from the vagus nerve (38), and area postrema projecting neurons to the NTS are largely glutamatergic (39) and activate glutamate receptors in the NTS upon stimulation (40). Furthermore, recent evidence suggests that satiety effects of POMC neurons intrinsic to the brainstem on the NTS also occurs by modulating glutamate release from the vagus (41), raising the interesting possibility that the effects of α-MSH on satiety both in the PVN and in the brainstem are mediated indirectly through the release of glutamate. It is intriguing to hypothesize therefore that glutamate not only mediates satiety effects of mechanical distension of the gastrointestinal tract and a variety of circulating, gut-derived peptides such as CCK and amylin, but also contributes the satiety effects of the descending inputs to the medial nucleus of the NTS from melanocortin-sensitive PVNv neurons.
In conclusion, these data demonstrate the existence of a melanocortin-responsive arcuate nucleus-PVNv/PVNl-NTS pathway that may have an important role in the determination of meal size in fasting animals that have been refed. We propose that PVNv/PVNl neurons influence the set point of NTS neurons to peripheral feeding-related signals carried by the vagus nerve, area postrema, and leptin signaling, using glutamate or other yet-unknown peptidergic transmitters.
Acknowledgments
This work was supported by National Institutes of Health Grant DK-37021, Grant OTKA K81845 from the Hungarian Science Foundation, Grant Health-F2-2010-259772 from the Seventh European Union Research Framework Program, and a Lendület Award of the Hungarian Academy of Sciences. G.W. is a recipient of a postdoctoral fellowship from the Hilda and Preston Davis Foundation for Eating Disorders Research.
Present address for P.S.S.: School of Biological Sciences, National Institute of Science Education and Research, Institute of Physics Campus, Sachivalaya Marg, P. O. Sainik School, Bhubaneswar 751 005, India.
Disclosure Summary: The authors have nothing to declare.
Footnotes
- ABC
- Avidin-biotin-peroxidase complex
- aCSF
- artificial cerebrospinal fluid
- CCK
- cholecystokinin
- CTB
- cholera toxin-β subunit
- IR
- immunoreactive
- NTS
- nucleus tractus solitarius
- POMC
- proopiomelanocortin
- PVN
- hypothalamic paraventricular nucleus
- PVNl
- lateral parvocellular subdivision of the PVN
- PVNv
- ventral parvocellular subdivision of the PVN
- SSC
- standard sodium citrate
- VGLUT2
- type 2 vesicular glutamate transporter.
References
- 1. Grill HJ, Kaplan JM. 2002. The neuroanatomical axis for control of energy balance. Front Neuroendocrinol 23:2–40 [DOI] [PubMed] [Google Scholar]
- 2. Kaplan JM, Seeley RJ, Grill HJ. 1993. Daily caloric intake in intact and chronic decerebrate rats. Behav Neurosci 107:876–881 [PubMed] [Google Scholar]
- 3. Berthoud HR, Earle T, Zheng H, Patterson LM, Phifer C. 2001. Food-related gastrointestinal signals activate caudal brainstem neurons expressing both NMDA and AMPA receptors. Brain Res 915:143–154 [DOI] [PubMed] [Google Scholar]
- 4. Phillips RJ, Powley TL. 2000. Tension and stretch receptors in gastrointestinal smooth muscle: re-evaluating vagal mechanoreceptor electrophysiology. Brain Res Brain Res Rev 34:1–26 [DOI] [PubMed] [Google Scholar]
- 5. Schwartz GJ, Moran TH. 1994. CCK elicits and modulates vagal afferent activity arising from gastric and duodenal sites. Ann NY Acad Sci 713:121–128 [DOI] [PubMed] [Google Scholar]
- 6. Singru PS, Sánchez E, Fekete C, Lechan RM. 2007. Importance of melanocortin signaling in refeeding-induced neuronal activation and satiety. Endocrinology 148:638–646 [DOI] [PubMed] [Google Scholar]
- 7. Paxinos G, Watson C. 1998. The rat brain in stereotaxic coordinates. 4th ed San Diego: Academic Press [Google Scholar]
- 8. Hrabovszky E, Turi GF, Kalló I, Liposits Z. 2004. Expression of vesicular glutamate transporter-2 in gonadotropin-releasing hormone neurons of the adult male rat. Endocrinology 145:4018–4021 [DOI] [PubMed] [Google Scholar]
- 9. Ben-Barak Y, Russell JT, Whitnall MH, Ozato K, Gainer H. 1985. Neurophysin in the hypothalamo-neurohypophysial system. I. Production and characterization of monoclonal antibodies. J Neurosci 5:81–97 [DOI] [PMC free article] [PubMed] [Google Scholar]
- 10. Takeda A, Nakano M, Goris RC, Funakoshi K. 2008. Adult neurogenesis with 5-HT expression in lesioned goldfish spinal cord. Neuroscience 151:1132–1141 [DOI] [PubMed] [Google Scholar]
- 11. Füzesi T, Sánchez E, Wittmann G, Singru PS, Fekete C, Lechan RM. 2008. Regulation of cocaine- and amphetamine-regulated transcript-synthesising neurons of the hypothalamic paraventricular nucleus by endotoxin; implications for lipopolysaccharide-induced regulation of energy homeostasis. J Neuroendocrinol 20:1058–1066 [DOI] [PMC free article] [PubMed] [Google Scholar]
- 12. Blouet C, Jo YH, Li X, Schwartz GJ. 2009. Mediobasal hypothalamic leucine sensing regulates food intake through activation of a hypothalamus-brainstem circuit. J Neurosci 29:8302–8311 [DOI] [PMC free article] [PubMed] [Google Scholar]
- 13. Simmons DM, Swanson LW. 2008. High-resolution paraventricular nucleus serial section model constructed within a traditional rat brain atlas. Neurosci Lett 438:85–89 [DOI] [PMC free article] [PubMed] [Google Scholar]
- 14. Swanson LW, Kuypers HG. 1980. The paraventricular nucleus of the hypothalamus: cytoarchitectonic subdivisions and organization of projections to the pituitary, dorsal vagal complex, and spinal cord as demonstrated by retrograde fluorescence double-labeling methods. J Comp Neurol 194:555–570 [DOI] [PubMed] [Google Scholar]
- 15. Montanaro MS, Allen AM, Oldfield BJ. 2005. Structural and functional evidence supporting a role for leptin in central neural pathways influencing blood pressure in rats. Exp Physiol 90:689–696 [DOI] [PubMed] [Google Scholar]
- 16. Kerman IA. 2008. Organization of brain somatomotor-sympathetic circuits. Exp Brain Res 187:1–16 [DOI] [PubMed] [Google Scholar]
- 17. Stanley S, Pinto S, Segal J, Pérez CA, Viale A, DeFalco J, Cai X, Heisler LK, Friedman JM. 2010. Identification of neuronal subpopulations that project from hypothalamus to both liver and adipose tissue polysynaptically. Proc Natl Acad Sci USA 107:7024–7029 [DOI] [PMC free article] [PubMed] [Google Scholar]
- 18. Evans SA, Messina MM, Knight WD, Parsons AD, Overton JM. 2005. Long-Evans and Sprague-Dawley rats exhibit divergent responses to refeeding after caloric restriction. Am J Physiol Regul Integr Comp Physiol 288:R1468–R1476 [DOI] [PubMed] [Google Scholar]
- 19. Dulloo AG, Jacquet J. 2001. An adipose-specific control of thermogenesis in body weight regulation. Int J Obes Relat Metab Disord 25(Suppl 5):S22–S29 [DOI] [PubMed] [Google Scholar]
- 20. Rothwell NJ, Saville ME, Stock MJ. 1983. Role of insulin in thermogenic responses to refeeding in 3-day-fasted rats. Am J Physiol 245:E160–E165 [DOI] [PubMed] [Google Scholar]
- 21. Rothwell NJ, Saville ME, Stock MJ. 1983. Metabolic responses to fasting and refeeding in lean and genetically obese rats. Am J Physiol 244:R615–R620 [DOI] [PubMed] [Google Scholar]
- 22. Timofeeva E, Baraboi ED, Richard D. 2005. Contribution of the vagus nerve and lamina terminalis to brain activation induced by refeeding. Eur J Neurosci 22:1489–1501 [DOI] [PubMed] [Google Scholar]
- 23. Loewy AD, Spyer KM. 1990. Central regulation of autonomic functions. Oxford, UK: Oxford University Press [Google Scholar]
- 24. Shapiro RE, Miselis RR. 1985. The central organization of the vagus nerve innervating the stomach of the rat. J Comp Neurol 238:473–488 [DOI] [PubMed] [Google Scholar]
- 25. Altschuler SM, Bao XM, Bieger D, Hopkins DA, Miselis RR. 1989. Viscerotopic representation of the upper alimentary tract in the rat: sensory ganglia and nuclei of the solitary and spinal trigeminal tracts. J Comp Neurol 283:248–268 [DOI] [PubMed] [Google Scholar]
- 26. Kalia M, Mesulam MM. 1980. Brain stem projections of sensory and motor components of the vagus complex in the cat: II. Laryngeal, tracheobronchial, pulmonary, cardiac, and gastrointestinal branches. J Comp Neurol 193:467–508 [DOI] [PubMed] [Google Scholar]
- 27. Kalia M, Mesulam MM. 1980. Brain stem projections of sensory and motor components of the vagus complex in the cat: I. The cervical vagus and nodose ganglion. J Comp Neurol 193:435–465 [DOI] [PubMed] [Google Scholar]
- 28. Blevins JE, Baskin DG. 2010. Hypothalamic-brainstem circuits controlling eating. Forum Nutr 63:133–140 [DOI] [PMC free article] [PubMed] [Google Scholar]
- 29. Blevins JE, Morton GJ, Williams DL, Caldwell DW, Bastian LS, Wisse BE, Schwartz MW, Baskin DG. 2009. Forebrain melanocortin signaling enhances the hindbrain satiety response to CCK-8. Am J Physiol Regul Integr Comp Physiol 296:R476–R484 [DOI] [PMC free article] [PubMed] [Google Scholar]
- 30. Lutz TA, Mollet A, Rushing PA, Riediger T, Scharrer E. 2001. The anorectic effect of a chronic peripheral infusion of amylin is abolished in area postrema/nucleus of the solitary tract (AP/NTS) lesioned rats. Int J Obes Relat Metab Disord 25:1005–1011 [DOI] [PubMed] [Google Scholar]
- 31. Lutz TA, Senn M, Althaus J, Del Prete E, Ehrensperger F, Scharrer E. 1998. Lesion of the area postrema/nucleus of the solitary tract (AP/NTS) attenuates the anorectic effects of amylin and calcitonin gene-related peptide (CGRP) in rats. Peptides 19:309–317 [DOI] [PubMed] [Google Scholar]
- 32. Rowland NE, Richmond RM. 1999. Area postrema and the anorectic actions of dexfenfluramine and amylin. Brain Res 820:86–91 [DOI] [PubMed] [Google Scholar]
- 33. Shapiro RE, Miselis RR. 1985. The central neural connections of the area postrema of the rat. J Comp Neurol 234:344–364 [DOI] [PubMed] [Google Scholar]
- 34. Ellacott KL, Halatchev IG, Cone RD. 2006. Characterization of leptin-responsive neurons in the caudal brainstem. Endocrinology 147:3190–3195 [DOI] [PubMed] [Google Scholar]
- 35. Wang B, Chehab FF. 2006. Deletion of the serotonin 2c receptor from transgenic mice overexpressing leptin does not affect their lipodystrophy but exacerbates their diet-induced obesity. Biochem Biophys Res Commun 351:418–423 [DOI] [PMC free article] [PubMed] [Google Scholar]
- 36. Allchin RE, Batten TF, McWilliam PN, Vaughan PF. 1994. Electrical stimulation of the vagus increases extracellular glutamate recovered from the nucleus tractus solitarii of the cat by in vivo microdialysis. Exp Physiol 79:265–268 [DOI] [PubMed] [Google Scholar]
- 37. Hung CY, Covasa M, Ritter RC, Burns GA. 2006. Hindbrain administration of NMDA receptor antagonist AP-5 increases food intake in the rat. Am J Physiol Regul Integr Comp Physiol 290:R642–R651 [DOI] [PubMed] [Google Scholar]
- 38. Wright J, Campos C, Herzog T, Covasa M, Czaja K, Ritter RC. 2011. Reduction of food intake by cholecystokinin requires activation of hindbrain NMDA-type glutamate receptors. Am J Physiol Regul Integr Comp Physiol 301:R448–R455 [DOI] [PMC free article] [PubMed] [Google Scholar]
- 39. Walberg F, Ottersen OP. 1992. Neuroactive amino acids in the area postrema. An immunocytochemical investigation in rat with some observations in cat and monkey (Macaca fascicularis). Anat Embryol (Berl) 185:529–545 [DOI] [PubMed] [Google Scholar]
- 40. Aylwin ML, Horowitz JM, Bonham AC. 1998. Non-NMDA and NMDA receptors in the synaptic pathway between area postrema and nucleus tractus solitarius. Am J Physiol 275:H1236–H1246 [DOI] [PubMed] [Google Scholar]
- 41. Wan S, Browning KN, Coleman FH, Sutton G, Zheng H, Butler A, Berthoud HR, Travagli RA. 2008. Presynaptic melanocortin-4 receptors on vagal afferent fibers modulate the excitability of rat nucleus tractus solitarius neurons. J Neurosci 28:4957–4966 [DOI] [PMC free article] [PubMed] [Google Scholar]


