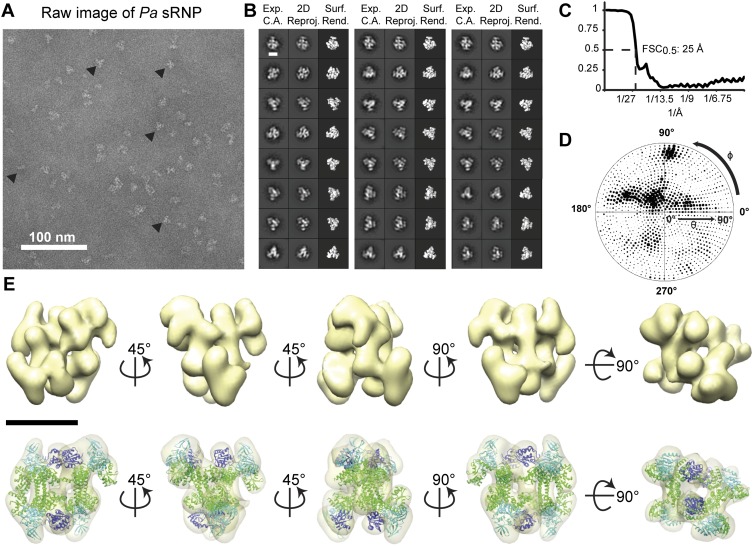
FIGURE 5.
3D single-particle EM reconstruction of the Pa box C/D di-sRNP. (A) Electron micrograph of negatively stained Pa box C/D sRNPs from glycerol gradient peak fractions. (▸) Examples of particles chosen for analysis. (B) Comparison of experimentally determined class averages (Exp. C.A.) to 2D reprojections of the reconstructed 3D volume (2D Reproj.) and to surface renderings (Surf. Rend.) of the 3D volume. Scale bar, 10 nm. (C) FSC curve of the reconstructed Pa box C/D sRNP EM volume. The resolution at 0.5 FSC is indicated. (D) Distribution of the Euler angles assigned to particle images included in the 3D EM reconstruction of the Pa box C/D sRNP. Circle radii are proportional to the number of images assigned to the particular Euler angles. (E) Isodensity of the 3D volume and docking of the crystal structures of the Pa core proteins (PDB 3NMU) (Xue et al. 2010) into the isodensity map at the 3σ threshold. Colors are as in Figure 4. Scale bar, 10 nm.

