

Abstract
We have examined the level of 8-hydroxyguanosine (8-oxo-G), an oxidized form of guanosine, in RNA in Escherichia coli under normal and oxidative stress conditions. The level of 8-oxo-G in RNA rises rapidly and remains high for hours in response to hydrogen peroxide (H2O2) challenge in a dose-dependent manner. H2O2 induced elevation of 8-oxo-G content is much higher in RNA than that of 8-hydroxydeoxyguanosine (8-oxo-dG) in DNA. Under normal conditions, the 8-oxo-G level is low in RNA isolated from the ribosome and it is nearly three times higher in non-ribosomal RNAs. In contrast, 8-oxo-G generated by a short exposure to H2O2 is almost equally distributed in various RNA species, suggesting that although ribosomal RNAs are normally less oxidized, they are not protected against exogenous H2O2. Interestingly, highly folded RNA is not protected from oxidation because 8-oxo-G generated by H2O2 treatment in vitro increases to approximately the same levels in tRNA and rRNA in both native and denatured forms. Lastly, increased RNA oxidation is closely associated with cell death by oxidative stress. Our data suggests that RNA is a primary target for reactive oxygen species and RNA oxidation is part of the paradox that cells have to deal with under oxidative stress.
Keywords: cell viability, 8-hydroxyguanosine (8-oxo-G), oxidative stress, RNA damage, RNA oxidation
Introduction
Many studies have revealed that DNA damaging agents also cause RNA damage (Li et al., 2006; Wurtmann and Wolin, 2009). Reactive oxygen species (ROS), which become more abundant under oxidative stress (OS), are common nucleic acid damaging agents. In the few cases when oxidative damages to DNA and RNA were compared by measuring the content of 8-hydroxyguanosine (8-oxo-G), oxidation was much greater in RNA than in DNA in mammalian cells and tissues, especially when exogenous oxidants such as hydrogen peroxide (H2O2), were introduced to cause oxidative stress (Fiala et al., 1989; Shen et al., 2000; Hofer et al., 2005, 2006). In a study using reverse-transcriptase PCR to measure the damage of Escherichia coli 16S rRNA, H2O2 treatment caused RNA damage that stopped reverse transcription up to 50% in 1 kilobase distance (Gong et al., 2006). These findings suggest that RNA oxidation is a pre-dominant feature under conditions of ROS attack.
There is increasing evidence regarding RNA dysfunction caused by oxidation. mRNA oxidized in vitro causes a reduction in protein synthesis and the formation of aggregated protein products (Shan et al., 2003, 2007). Oxidative damage of mRNA could cause ribosome stalling during translation elongation (Shan et al., 2007). Consistent with these observations, truncated proteins were made from oxidized mRNA (Tanaka et al., 2007). Oxidation also causes ribosome dysfunction (Ding et al., 2005; Honda et al., 2005). Cells must have developed various mechanisms that control the quality of RNA and minimize the deleterious effect of RNA oxidation. RNA surveillance activities could reduce the incorporation of damaged nucleotides into RNA (Taddei et al., 1997; Hayakawa et al., 1999; Ishibashi et al., 2005) and degrade or repair damaged RNA (Li et al., 2006; Wurtmann and Wolin, 2009, Kong and Lin, 2010). Consistent with this notion, an important RNA degrading exoribonuclease, polynucleotide phosphorylase, was shown to reduce RNA oxidation and protect E. coli and HeLa cells under oxidative stress (Wu and Li, 2008; Wu et al., 2009).
Despite the increasing interest in studying RNA oxidative damage and quality control, little is known about the level of RNA damage under oxidative stress and whether different RNA species and structures are differentially oxidized by ROS. In a growing E. coli cell, highly structured rRNA and tRNA account for nearly 80% and 15% of the total RNA, respectively. In addition, most of the rRNA molecules are present in ribosomes where rRNAs are tightly bound with ribosomal proteins. One would expect that RNA would be protected from oxidation by the presence of highly folded structures or by association with proteins. In this work, we examined the level and distribution of oxidized RNA in E. coli under normal and oxidative stress conditions to answer these questions.
Results
H2O2 causes a quick and dosage-dependent increase of 8-oxo-G in cellular RNA
In order to determine the level of RNA oxidation in response to H2O2 treatment, we have measured 8-oxo-G content in cellular RNA in a time course after addition of H2O2 in E. coli cultures. Under conditions described in Materials and methods, the basal level of 8-oxo-G in E. coli RNA is slightly lower than one 8-oxo-G per 105 G. After adding H2O2 to the cultures, the 8-oxo-G level increases in only minutes and remains high for hours (Figure 1A). It should be noted that the concentration of H2O2 reduces rapidly in the culture media, becoming close to the basal level 5 min after addition of the oxidant (Wu et al., 2009). Interestingly, after a pulse treatment with H2O2, the level of 8-oxo-G initially rises and then quickly drops to almost normal level when the cells were subsequently grown in fresh medium (Figure 1A). This observation suggests that the sustained high level of 8-oxo-G in cultures of continuous H2O2 treatment is likely caused by oxidized components of the medium.
Figure 1.
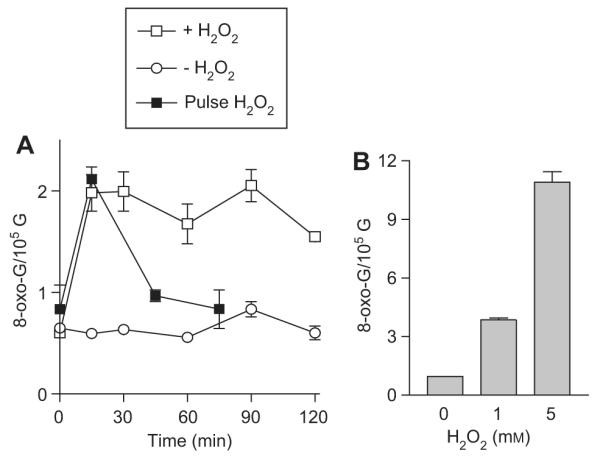
H2O2 treatment causes quick, dosage-dependent increase of 8-oxo-G content in cellular RNA.
(A) 8-oxo-G levels in RNA in a time course after addition of H2O2 or H2O. Exponentially grown cultures of E. coli CA244 rna strain (OD550=0.5) were treated with 1 mm H2O2 or an equal volume of H2O at 0 min. Total RNA was extracted and 8-oxo-G levels were analyzed as described in Materials and methods. Pulse treatment was carried out by exposing the cultures to H2O2 for 10 min. Cells were pelleted and grown in fresh H2O2 -free medium for the rest of the time course. (B) Increase of 8-oxo-G levels in RNA depends on the dose of H2O2. Exponentially grown cultures were treated with indicated concentrations of H2O2 for 15 min. Total RNA was isolated and 8-oxo-G level was measured.
The increase of 8-oxo-G in RNA depends on the dosage of H2O2, from three 8-oxo-G/105 G when treated with 1 mm H2O2 to nearly ten 8-oxo-G/105 G in the presence of 5 mm H2O2 (Figure 1B). Cells grown in rich and minimal media contain similar levels of basal and H2O2 induced 8-oxo-G in RNA (data not shown).
H2O2 induces higher levels of 8-hydroxyguanine in RNA than in DNA
To compare the level of oxidation in DNA and RNA, we measured 8-oxo-G content in RNA and 8-hydroxydeoxyguanosine (8-oxo-dG) in DNA simultaneously in the same culture treated with or without H2O2. This was done by a modified procedure that enabled us to extract the DNA and RNA together. The nucleic acids were digested and the resulting nucleosides were applied to HPLC analysis under conditions that guanosine (G), deoxyguanosine (dG), 8-oxo-G and 8-oxo-dG were separately detected in a single sample. As shown (Figure 2), this modified procedure caused an elevation in the basal level of 8-oxo-G in RNA to above three 8-oxo-G/105 G, probably due to spurious oxidation during preparation of the nucleic acids (de Souza-Pinto and Bohr, 2002). Nonetheless, treatment with 5 mm H2O2 for 15 min increases 8-oxo-G to approximately ten per 105 G in RNA when both RNA and DNA were prepared simultaneously (Materials and methods). This result is consistent with the level of 8-oxo-G induction by the same H2O2 concentration following the procedure for RNA isolation only (Figure 1B).
Figure 2.

H2O2 treatment causes a higher elevation of 8-oxo-G in RNA than that of 8-oxo-dG in DNA.
Exponential phase (OD550=0.5) cell culture was treated with and without 5 mm H2O2 for 15 min. RNA and DNA were isolated together, then 8-oxo-G in RNA and 8-oxo-dG in DNA were measured as described (Wu et al., 2009). Treatment with lower concentrations of H2O2 does not cause a detectable increase of 8-oxo-dG in DNA under these conditions (data not shown).
The basal level of 8-oxo-dG in DNA is lower than 8-oxo-G in RNA (Figure 2). However, it must still be higher than the actual level in DNA due to the same spurious oxidation observed in RNA. Importantly, the level of 8-oxo-dG in DNA only increases slightly after treatment with 5 mm H2O2, contrasting the large increase of 8-oxo-G in RNA. Similarly, treatment with 1 mm H2O2 causes moderate increase of 8-oxo-G in RNA but no change of 8-oxo-dG in DNA (data not shown). This data suggests that at a steady state, OS induced oxidative damage of RNA is higher than that of DNA, consistent with the results from similar studies using mammalian samples (Fiala et al., 1989; Shen et al., 2000; Hofer et al., 2005, 2006).
The distribution of 8-oxo-G in various RNA species
We first tried to understand the oxidation level of RNA of different sizes. Long and short RNAs were isolated from total RNA. The long RNA is predominantly composed of rRNA, and the short RNA is almost pure tRNA. Under normal conditions, 8-oxo-G level in the long RNA fraction is slightly lower than that in the short RNA. After cells were treated with 3 mm H2O2, both RNA fractions contain elevated levels of 8-oxo-G (Figure 3A). These results suggest that RNA size does not significantly affect oxidation level and that structured RNA species can be oxidized efficiently. The latter point was examined further below.
Figure 3.

The levels of 8-oxo-G in various cellular RNA species under normal conditions and in response to H2O2 treatment.
(A) 8-oxo-G levels in long and short RNA fractions of total RNA isolated from cultures that were treated with and without 3 mm H2O2. (B) 8-oxo-G levels in RNA from ribosome, non-ribosome and long and short non-ribosome fractions. Exponentially grown cells were treated with 0.5 or 1 mm H2O2 for 15 min. Various RNA fractions were prepared and 8-oxo-G level was measured as described in Materials and methods. The mean and standard error of triplicates were plotted.
The rRNA species present in ribosomes constitute the majority of cellular RNA. In order to understand if the rRNAs’ highly folded structure and tight association with ribosomal proteins protect RNA from oxidation, we have determined 8-oxo-G levels in RNA from ribosome and nonribosome fractions. In order to isolate the RNAs, cells were opened by freeze and thaw, after which, the ribosome was pelleted as described in Materials and methods. RNA samples were prepared from both ribosomal and non-ribosomal (supernatant) fractions and were examined by gel electrophoresis. The RNA from ribosome fractions contains essentially pure rRNA. RNA from the non-ribosomal fraction contains all RNA species including rRNAs that are not incorporated into ribosomes in addition to RNA degradation intermediates. Non-ribosomal RNAs can also be further fractionated to long and short RNAs; the latter is almost pure tRNA (Deutscher and Hilderman, 1974; Li and Deutscher, 2009).
Under normal conditions, RNA isolated from ribosomes contains approximately 0.4 8-oxo-G per 105 G (Figure 3B). This is significantly lower than the level of 8-oxo-G in total RNA (Figure 1). In contrast, the level of 8-oxo-G in RNA from the non-ribosomal fraction is almost three times higher than the level in ribosomal RNA and is also higher than the level in total RNA (Figure 3B). There is no difference between the long and short RNAs in the non-ribosomal RNA fraction. In various experiments, RNA isolated from ribosomes is approximately 60% of total RNA and RNA from non-ribosomal fractions constitute the remaining 40%.
After cells are exposed to H2O2 for 15 min, 8-oxo-G levels increase in all RNA fractions. Interestingly, RNA from ribosomes contains 8-oxo-G at the same and in some cases higher levels as non-ribosomal RNA depending on the H2O2 dosage (Figure 3B). The results suggest that the exceeding complex structures do not protect rRNA from oxidation, nor do the surrounding ribosomal proteins. 8-oxo-Gs were also generated in non-ribosomal RNAs, without showing differences in the long and short RNA fractions. Note that in the experiments shown in Figure 3B, the levels of 8-oxo-G are generally higher than those shown in Figure 1, presumably due to differences in cell growth and treatment conditions.
Highly folded structure does not protect RNA from being oxidized in vitro
In order to examine if RNA structure has any protective role against oxidation, we have determined the levels of 8-oxo-G generated by H2O2 treatment in vitro of tRNA and rRNA in either native or denatured forms. Such treatment introduces hundreds of 8-oxo-G per 105 G using mm levels of H2O2 (Figure 4). Surprisingly, native tRNA contains slightly more 8-oxo-G than denatured tRNA at every concentration of H2O2 used in this experiment (Figure 4A). As for rRNA, 8-oxo-G level in the native form is not significantly different from that in the denatured form, although the latter appears slightly lower at the 1 mm and 10 mm H2O2 dosages (Figure 4B). The results are consistent with the observation of RNA oxidation in ribosomes in vivo (Figure 3) and are against the notion that RNA structure can protect RNA from oxidative damage.
Figure 4.

Native RNA structures do not protect RNA from H2O2-mediated oxidation in vitro.
(A) tRNA was isolated from total RNA by isopropanol differential precipitation (see Figure 3). Native and denatured tRNA samples were incubated with indicated concentrations of H2O2 in vitro and 8-oxo-G levels were determined as described in the Materials and methods section. (B) rRNA was prepared from ribosomes as shown in Figure 3. Native and denatured rRNAs were treated with indicated concentrations of H2O2 in vitro and 8-oxo-G level was determined. The mean and standard error of at least three replicates were plotted.
RNA fragmentation upon H2O2 treatment
Oxidation is also able to cause RNA strand breaks (Li et al., 2006). Alternatively, oxidized RNA might undergo degradation. These processes could cause elevated levels of RNA fragments. Here, we have examined if such fragments are produced and accumulated upon H2O2 treatment. After cells were treated with H2O2, RNA products increased below the full length 16S rRNA band (Figure 5, left panel). These can be fragments of 23S or 16S rRNAs. We analyzed 23S rRNA, 16S rRNA and their fragments by Northern Blotting as described in Materials and methods. As shown (Figure 5), middle and right panels, short products of 23S and 16S rRNAs are increased by H2O2 treatment, especially in areas below the full-length 16S rRNA band. Note that the increase of fragmentation by H2O2 treatment is not dramatic. Considering that most cells are viable under this condition (see below) and that some fragments of the rRNAs might be degraded, the detectable increase in rRNA fragmentation does present another problem that cells have to handle under OS.
Figure 5.
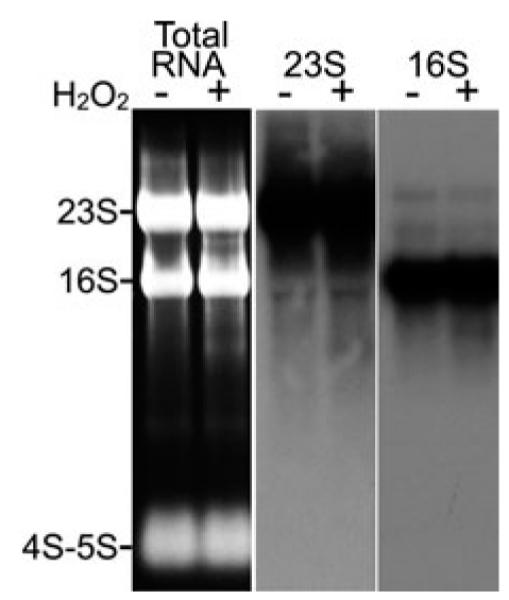
RNA fragmentation induced by oxidative stress.
Left panel, H2O2 treatment causes a slight increase in the amount of RNA products that are shorter than 23S or 16S rRNAs. Total RNA was prepared using TRI Reagent from exponential cultures treated with and without 1 mm H2O2 for 15 min and was separated by electrophoresis on a 1.5 % agarose gel. The major RNA species are marked on the left. Middle panel, Northern blot of 23S rRNA showed a slightly darker smear under the full-length 23S upon H2O2 treatment, representing a slight increase in 23S rRNA fragments. Right panel, Northern blot of 16S rRNA showing increased levels of 16S fragments in response to H2O2 treatment.
Cell death in response to H2O2 challenge
Escherichia coli cell viability under H2O2 treatment was studied by measuring optical density of cultures and by determining colony forming unit (CFU). H2O2 causes reductions of cell density at concentrations of 2 mm or higher (Figure 6A). The slight reduction of density in response to 2 and 4 mm H2O2 mainly occurs in the first 30 min. Very little change in OD 550 was observed when H2O2 was added to 7 or 10 mm, suggesting heavy cell death (Figure 6A).
Figure 6.

H2O2 treatment causes a dose dependent growth reduction of E. coli.
(A) H2O2 was added into exponential-phase cultures (OD550=0.5) at 0 min to final concentrations indicated in the Figure. The cultures were then immediately dispensed into the wells of a 96-well plate. The plate was incubated with shaking and the OD550 was recorded by a plate reader in a time course. Four replicates were read and the mean and standard error were plotted. Note the actual OD550 shown is lower than 0.5 initially due to the thinner cultures in the wells than in a regular cuvette. (B) Colony forming unit in OD550=0.5 cultures in a time course after addition of H2O2 to the indicated final concentrations at 0 min. Colony forming units were determined as described in Materials and methods. The mean and standard error of triplicates were plotted. (C) Colony forming unit in OD550=0.01 cultures in a time course after treatment with indicated concentrations of H2O2. The mean and standard error of triplicates were plotted.
Viable cell count confirms that the reduction of culture density is actually due to cell death, which happens mainly in the first 60 min after H2O2 addition (Figure 6B). Similar to 8-oxo-G levels in RNA, cell death depends on the dosage of H2O2 (Table 1). When H2O2 was added at 1 to 5 mm, cells die at rates that increase depending on H2O2 concentration. A higher rate of cell death was observed at 60 min than at 30 min after H2O2 addition at every concentration. H2O2 at 10 mm kills cells completely, consistent with the results of cell density reduction (Figure 6A). We noted that 1 mm H2O2 causes detectable cell death based on CFU but it does not affect culture density. The difference between CFU and culture density reduction responding to 1 mm H2O2 is pre-sumably due to the fact that dead cells contribute to density reading of the cultures. As expected, H2O2 at 2 mm or higher concentrations caused a reduction to both CFU and density of culture.
Table 1.
Cell death upon H2O2 insult.
| H2O2 (mm) | % of CFU ± standard error |
|
|---|---|---|
| 30 min | 60 min | |
| 0 | 100 ± 1.2 | 100 ± 1.0 |
| 1 | 91.8 ± 0.2 | 83.5 ± 2.5 |
| 2 | 82.0 ± 0.9 | 70.6 ± 1.1 |
| 5 | 57.8 ± 0.2 | 42.4 ± 0.4 |
| 10 | 0.8 ± 0.6 | 0.04 ± 0.04 |
Cultures of OD 550 = 0.5 were treated with the indicated concentration of H2O2 . The CFU of control cultures (0 mm H2O2) was set at 100 % .
CFU analysis also demonstrated that the effect of H2O2 depends on the density of the culture. As shown (Figure 6C), where OD 550 = 0.01 cultures were treated with 2 mm H2O2, only a small percentage of cells (4-5%) survived after 60 min. CFU was also reduced by 60% in the presence of only 0.5 mm H2O2. It is likely that low density cultures hydrolyze H2O2 much slower than high density cultures, resulting in sustained oxidation and more cell death in low density cultures.
Discussion
In this work we have demonstrated that cellular RNAs are quickly and highly oxidized under oxidative stress, as indicated by the rise of 8-oxo-G levels in RNA, which is dependent on H2O2 dosage. Oxidation occurs to all RNA species. RNA structures and association with proteins do not appear to be able to protect RNA from being oxidized by H2O2. In addition, a small amount of ribosomal RNA fragments can be identified upon H2O2 treatment.
Fenton reaction during preparation, storage and processing causes spurious oxidation of nucleic acids, resulting in variations of reported basal levels of oxidized nucleobases in the order of magnitude (ESCODD et al., 2005). This variation could also greatly interfere with the results in response to oxidants (de Souza-Pinto and Bohr, 2002). In order to reduce spurious oxidation in our experiments, we have adopted procedures to minimize exposure to oxygen and to reduce the level of contaminating metal ions (Shen et al., 2000; ESCODD et al., 2005; Hofer et al., 2006; Wu et al., 2009). However, it is likely that the true basal level of 8-oxo-G is lower than reported in this work because spurious oxidation might not be completely avoided during HPLC analysis (ESCODD et al., 2005). In fact, elevated basal levels were occasionally observed when an alternative preparation method was used (Figure 2). Nonetheless, our results demonstrated 8-oxo-G levels that respond well to all dosages of H2O2.
Oxidation of cellular RNA by exogenous H2O2 takes a very short time to happen, suggesting that RNA is a direct target of ROS (Figure 1). After H2O2 addition, 8-oxo-G levels remain increased throughout the entire time course examined (Figure 1A), although H2O2 levels in the culture quickly became undetectable in minutes (Wu et al., 2009; data not shown). A small decrease in the level of 8-oxo-G 60 min after the addition of H2O2 has been consistently observed. The H2O2-induced 8-oxo-G level reduces rapidly after the cells were shifted to fresh H2O2-free medium. It is likely that degradation or repair reduces the level of 8-oxo-G containing RNA, whereas residual ROS derived from H2O2 would cause an increase in the level of 8-oxo-G. The observed steady state levels of 8-oxo-G in RNA induced by continuous H2O2 treatment must reflect the equilibrium of the two processes.
An unexpected observation was that rRNA and tRNA are not protected by their structures or by proteins associated with rRNA (Figure 3). The inability of RNA structure to protect RNA from oxidation was further shown in vitro by exposing purified RNA to H2O2 (Figure 4). These findings are surprising because one would expect that RNA structure and protein binding would limit the accessibility of RNA to ROS. Apparently, ROS can reach the bases in these RNAs efficiently. One possible explanation for the lack of protection is the association of the highly structured RNAs with Fe2+, the ion known to generate oxidative chemicals and free radicals from H2O2 by Fenton chemistry (Wardman and Candeias, 1996). Indeed, such association of rRNA with Fe2+ has been reported to play a role in promoting rRNA oxidation and inactivation in translation (Honda et al., 2005).
Importantly, under normal conditions rRNAs isolated from the ribosomes contain much lower levels of 8-oxo-G than the rest of the cellular RNA (Figure 3), suggesting that rRNA in ribosomes are normally kept with low oxidative damage. This phenomenon could be important for optimal ribosome function to support cell growth because oxidative damage might hinder protein synthesis or generate errors in the protein products.
A number of the observations in this work also suggest the existence of RNA quality control activities that remove oxidized RNA and support cells surviving OS insults. First, the high levels of 8-oxo-G generated by H2O2 treatment must eventually be reduced to a normal level, at least in the viable cells. Second, given the fact that ribosomal RNA normally contains low 8-oxo-G but is efficiently oxidized by H2O2, oxidized rRNA species might be identified and removed from ribosomes. Such mechanism(s) might not only be responsible for the removal of 8-oxo-G in ribosomes (Min Liu and Zhongwei Li, unpublished observations) but could also be used for reducing 8-oxo-G in rRNA under normal conditions.
Degradation of oxidized RNA can be a major quality control pathway because until now a repairing mechanism is only found on the alkylated RNA. As reported previously, E. coli polynucleotide phosphorylase (PNPase) plays a pivotal role in controlling 8-oxo-G levels and supporting cell viability under OS (Wu et al., 2009). In addition, other RNA degradation activities also are important for reducing 8-oxo-G and protecting cells under OS (unpublished results from our laboratory). In addition to elevated levels of 8-oxo-G, we have also observed increased fragmentation of rRNA in response to H2O2 treatment (Figure 5). These rRNA fragments might be removed from ribosomes and eventually degraded. The detailed molecular mechanisms for the elimination of oxidized RNA, possibly involving specific recognition and targeted degradation of such RNA molecules, are yet to be elucidated in future work.
Under the same conditions that H2O2 cause ~0.7 8-oxo-dG/105 G in DNA, 8-oxo-G rises by 6-7 per 105 G in RNA at steady state (Figure 2). The relatively lower level of H2O2 induced 8-oxo-dG in DNA might be due to strong DNA repair activities that quickly remove 8-oxo-dG after its formation. Such repair activities have not yet been reported for RNA. In contrast, oxidized RNA might undergo rapid degradation resulting in the observed steady state level of 8-oxo-G in RNA. Considering that the amount of RNA is approximately four times that of DNA, the oxidized guanine in RNA can be much higher than that in DNA under OS conditions used in this work. The presence of such large amount of oxidized nucleotides in RNA and the possible turnover of oxidized RNA might be an important antioxidant mechanism which consumes the majority of nucleotide oxidizing agents and reduces DNA damage (Radak and Boldogh, 2010). These potential mechanisms should be defined in further studies.
Moreover, increased RNA damage might attenuate cell growth. A correlation between the levels of RNA oxidation and cell growth reduction is proposed (Table 2). Assuming that RNA is oxidized randomly and that total damage in RNA is approximately ten times higher than the levels of 8-oxo-G (Gajewski et al., 1990; Rhee et al., 1995; Cooke et al., 2003; Li et al., 2006), a significant fraction of RNA molecules might be damaged by H2O2 at mm concentrations at steady state. It is likely that RNA oxidative damage contributes, at least partly, to the observed cell death under the same OS conditions (Table 2). Currently, there is no clear explanation about how oxidized RNA would reduce cell viability under oxidative stress conditions. It was previously reported that oxidized rRNA and mRNA are defective in protein synthesis in vitro or in cells transfected by oxidized RNA (Ding et al., 2005; Honda et al., 2005, Tanaka et al., 2007; Shan et al., 2007). Lack of protein synthesis and production of aberrant proteins due to RNA oxidation are likely a main cause of cell death. We have reported that PNPase, an exoribonuclease that binds to 8-oxo-G RNA with specificity (Hayakawa et al., 2001) and degrades defective RNA (Li et al., 2002), is important for controlling the level of 8-oxo-G in RNA and for protecting E. coli cells under OS (Wu et al., 2009). In the absence of this enzyme, E. coli cells become hypersensitive of H2O2 and other oxidants, and contain elevated levels of 8-oxo-G in RNA (Wu et al., 2009). These findings strongly support the notion that oxidized RNA is deleterious to cell.
Table 2.
Steady-state levels of RNA oxidative damage in E. coli in response to H2O2 treatment.
| Growth condition | 8-oxoG/105 Ga | 8-oxo-G RNA b | Damaged RNA c | Cell viability (CFU)a |
|---|---|---|---|---|
| Normal aeration | 1.0 ± 0.1 | 0.25 % | 2.4 % | (set to 100 % ) |
| Plus 1 mm H2O2 | 3.9 ± 0.1 | 0.98 % | 9.3 % | 83 % |
| Plus 5 mm H2O2 | 10.9 ± 0.5 | 2.7 % | 24 % | 42 % |
8-oxo-G levels were determined 15 min after addition of H2O2 to exponentially growing cultures. CFU was determined after treatment with H2O2 for 60 min.
Based on the assumption that the length of RNA is 1 kb on average, the GC content is 50 % and 8-oxo-G is randomly distributed so that the percentage of 8-oxo-G containing RNA can be described by Poisson’s distribution.
Based on the assumption that total damage occurrences can be 10 times of 8-oxo-G content.
Knowledge about the nature and effect of RNA oxidation would eventually enhance our understanding of related diseases. In the last decade, a number of reports have demonstrated that increased RNA oxidation is implicated in the development of numerous degenerative disorders (Nunomura et al., 2009; Wurtmann and Wolin, 2009). Other studies suggest that oxidation of RNA, but not of DNA, was increased in diseases such as Alzheimer ’ s (Nunomura et al., 1999; Abe et al., 2002; Ding et al., 2006), Parkinson ’ s, (Zhang et al., 1999; Kikuchi et al., 2002), dementia with Lewy bodies (Nunomura et al., 2002), myopathies (Tateyama et al., 2003), atherosclerosis (Martinet et al., 2004), amyotrophic lateral sclerosis (ALS) (Chang et al., 2008), hemochromatosis (Broedbaek et al., 2009), hepatic encephalopathy (Görg et al., 2010) and schizophrenia (Che et al., 2010). More recently, RNA oxidation adducts were shown to be differentially correlated with insoluble amyloid-β42, a causative factor of Alzheimer disease (Weidner et al., 2011), suggesting that different forms of oxidized RNA might be involved in different stages of this disease (Abe et al., 2002; Weidner et al., 2011). Furthermore, increased RNA oxidation was reported under physiological conditions associated with aging (Liu et al., 2002; Hofer et al., 2008a,b; Seo et al., 2008). These findings suggest that RNA oxidation is a predominant feature under conditions of ROS attack. RNA oxidative damage might contribute to the process of aging and disease development. Whether RNA oxidation damage directly causes diseases or aging and how much it contributes to these processes remains to be revealed.
Materials and methods
Bacterial strain and growth conditions
Escherichia coli K12 strain CA244 rna (lacZ, trp, relA, spot, rna, Tn10::tetR) was used in this study. Cultures were grown in Yeast extract-Trypton (YT) medium (BD Diagnostic Systems, Sparks, Maryland, USA). Tetracycline was added to the medium at 10 μg/ml when needed.
Materials
Guanosine was obtained from Sigma-Aldrich (St. Louis, MO, USA). 8-hydroguanosine (8-oxo-G) was from Calbiochem (La Jolla, CA, USA). Tri Reagent was from Molecular Research Center (Cincinnati, OH, USA). Lysozyme was from Sigma-Aldrich (St. Louis, MO, USA). α-32P-dATP was purchased from GE Healthcare Inc (Piscataway, NJ, USA). dNTPs and Taq DNA polymerase used in PCR reactions were from Invitrogen (Carlsbad, CA, USA). The following DNA oligonucleotides were synthesized at Integrated DNA Technologies (Coralville, IA, USA) and were used as primers for rRNA specific PCR products: 23S-1, 5′-AGC GAC TAA GCG TAC ACG GT-3′; 23S-2, 5′-AAG ACC AAG GGT TCC TGT CC-3′; 23S-3, 5′-TTA GAG GCT TTT CCT GGA AGC-3′; 23S-4, 5′-AGC CTC ACG GTT CAT TAG TAC C-3′; 16S-R, 5′-TAT TCA CCG TCC CAT TCT GA-3′; 16S-F, 5′-TGC AAG TCG AAC GGT AAC AG-3′. All other chemicals are reagent grade. Double distilled water (ddH2O) was treated with diethyl pyrocarbonate (DEPC) and Chelex 100, both from Sigma-Aldrich, Saint Louis, MO, USA. Buffers, phenol (EMD Chemicals, Inc. Gibbstown, NJ, USA), ethanol (Sigma-Aldrich, Saint Louis, MO, USA) and isopropanol (ACROS Organics, Fair Lawn, NJ, USA) were also treated with Chelex 100 as appropriate.
Treatment of E. coli cultures with H2O2
Overnight cultures grown in YT medium with shaking at 37°C were diluted with fresh, pre-warmed YT medium and incubated until OD550 reached 0.5. H2O2 was added to the culture at the desired final concentration. Equal volume of H2O was added in control cultures. The cultures were continually incubated with shaking and samples were collected at various time points.
Isolation of RNA and DNA
Cells were collected and resuspended in lysis buffer [10 mm Tris·Cl, 10 mm EDTA pH 8.0, 1% SDS, 10% glycerol and supplemented with freshly added deferoxamine mesylate (DFOM, Sigma-Aldrich, Saint Louis, MO, USA) to a final concentration of 10 mm]. Total RNA was routinely prepared for 8-oxo-G analysis. The lysates were diluted 10 times with ddH2O and an equal volume of a mixture of liquefied phenol (pH ~4) and chloroform (9:1) was added. The mixture was applied to a vortex intermittently for 10 min at room temperature. After centrifugation, the upper layer of aqueous phase was transferred to a new tube and was extracted one more time with phenol-chloroform. To the recovered aqueous phase, 1/10 volume of 3 m KAc (pH 5.2) and an equal volume of isopropanol were added. The tubes were filled with nitrogen, mixed well and kept at −80°C for 1 h. RNA was precipitated by centrifuging at 20 000 g for 10 min at 4°C. The RNA pellets were washed twice with 75% cold ethanol and were vacuum-dried for 10 min. The dried RNA was directly dissolved in a digestion mixture in which the RNA was converted to nucleosides (Wu et al., 2009). When RNA and DNA were isolated simultaneously, cell lysates were extracted with phenol and chloroform and then the nucleic acids were precipitated by ethanol, as previously described (Wu et al., 2009).
Determination of 8-oxo-G level in RNA and 8-oxo-dG level in DNA
After digestion, the 8-oxo-G level in RNA was determined by HPLC as previously described (Gong et al., 2006 ; Wu et al., 2009). For simultaneous detection of 8-oxo-G in RNA and 8-oxo-dG in DNA, digestion was carried out under the same conditions for RNA. The resolving time of HPLC is 70 min to allow the separation of both DNA and RNA nucleosides. Chemical standards of G, dG, 8-oxo-G and 8-oxo-dG were used. The normalized level 8-oxo-G/105 G in RNA or 8-oxo-dG/105 dG in DNA was calculated.
Preparation of ribosomal and non-ribosomal RNA
Exponentially growing cells were harvested by centrifugation at 10 000 g for 3 min. The cell pellet was resuspended in 1 ml saline solution, transferred into an Eppendorf tube and was pelleted at 10 000 g for 1min. The pellet was resuspended in 800 μl cell extract buffer (10 mm Tris·HCl, pH 7.75, 100 mm NH4Cl and 1 mm DFOM) (Vaidyanathan et al., 2007). The cell suspension was supplemented with 12.5 μl lysozyme (40 mg/ml) and the mixture was incubated for 1 min at room temperature (Ron et al., 1966). The mixture was frozen in dry ice/ethanol bath and then thawed completely in a water bath at 37°C. The freeze-thaw process was repeated three times in order to completely lyse the cells (Ron et al., 1966). To the cell lysate, 30 μl of 10% sodium deoxycholate was added and the solution was incubated in an ice water bath for 3 min (Ron et al., 1966). The lysate was then centrifuged at 25 000 g for 40 min at 4°C. The supernatant was transferred to an ultracentrifuge tube (Microcentrifuge Polyallomer, Part No. 357448, Beckman Coulter, Indianapolis, IN, USA) and centrifuged at 200 000 g using the Beckman TLA-100.4 rotor and ultracentrifuge at 4°C for 2 h to pellet the ribosome (Vaidyanathan et al., 2007, Székely et al., 1973). The supernatant was transferred to an Eppendorf tube. Subsequently, the ribosome pellet was briefly rinsed with cell extract buffer, and re-suspended in the same buffer supplemented with 0.5% SDS (Li and Deutscher, 2009). RNA was isolated from the ribosome suspension and the non-ribosomal supernatant fraction as previously described (Li and Deutscher, 2009).
Separation of long and short RNA species
Long and short RNAs were separated by differential precipitation using isopropanol (Deutscher and Hilderman, 1974; Li and Deutscher, 2009). RNA was added NaAc (pH 7.0) to 0.3 m and DFOM to 1 mm. To the RNA solution, 0.54 volume of isopropanol was added and mixed immediately. The mixture was centrifuged at 21 100 g for 15 min. The RNA pellet contained long RNA, mainly rRNA and mRNA species. The aqueous phase was transferred into a new Eppendorf tube, and additional isopropanol was added to a final 0.98 volume. The mixture was kept at −80°C for at least 1 h. RNA was pelleted by spinning at 21 100 g for 10 min. The resulting small RNA was almost pure tRNA (Deutscher and Hilderman, 1974). The pellets of long and short RNAs were washed twice with pre-cooled 75% ethanol at 21 100 g for 3 min before further analysis.
RNA denaturation and oxidation in vitro
The highly structured rRNA and tRNA were isolated by the method described above. RNA dissolved in ddH2O was denatured by incubating at 95°C for 2 min, followed by chilling immediately in an ice water bath. In vitro oxidation was performed as described previously with modifications (Gong et al., 2006). Briefly, 40 μg of native or denatured RNA were incubated in a buffer containing 100 mM H2PO4/HPO4, pH 7.4, 1 μm CuSO4, 10 μm ascorbic acid and various concentrations of H2O2 at 37°C for 1 h. RNA was then precipitated and washed before analysis of 8-oxo-G level.
Determination of rRNA fragmentation
Total RNA was extracted by TRI Reagent and was dissolved in ddH2O. The RNA solution was added to 1/5 volume of 6× RNA loading buffer containing 0.25 % Bromophenol blue, 0.25 % xylene cyanol, 30 % glycerol, 1.2 % SDS, 60 mm sodium phosphate (Kevil et al., 1997). RNA in the loading mixture was denatured by incubating at 75 °C for 5 min and immediately chilled in an ice water bath (Cheng and Deutscher, 2003). RNA was separated by electrophoresis on a 1.5 % agarose gel in 0.5×TBE buffer, first at 60 V for 10 min and then at 100 V for 1 h. The gel was stained with SYBR Gold and photographed under UV light. Northern analysis was carried out according to the procedure described previously (Cheng and Deutscher, 2003) with some modifications. RNA in the gel was transferred to GeneScreen Plus® membrane (Pall Life Science, Pensacola, FL, USA) by electroblotting at 15 V overnight in 1×TBE buffer. RNA was fixed to the membrane by UV irradiation for 2 min, prehybridized for 2.5 h at 68 °C in 1×Denhardt’s solution and then hybridized overnight at 55 °C with probes specific for 23S or 16S rRNA. The 23S and 16S specific DNA products were generated by PCR using specific primers and E. coli genomic DNA. The PCR products cover the entire rRNA sequences. Because 23S rRNA is nearly 3 kilobases in length, we first made two halves using the two pairs of primers. 23S-1 and 23S-3 oligos were one pair of primers to synthesize the 5′ end part products. 23S-2 and 23s-4 oligos were another pair for 3′ end part. Then labeled [32P]-labeled probes were generated by PCR reactions using the PCR product for specific rRNA as template, the primer complementary to the rRNA (23S-3, 23S-4, and 16S-R) and dNTPs plus α-[32P]-dATP. RNAs in the membrane were hybridized with two 23S probes in one chamber to label the related rRNA products. A 16S rRNA probe was used to hybridize with another membrane and separately labeled the 16S rRNA products. After hybridization, the membrane was washed twice for 10 min at 55 °C, each with 1×SSC and 0.1 % SDS, prior to autoradiography.
Determination of cell viability
When the OD550 of the culture reached 0.5, H2O2 or H2O was added. 100 μl of the cultures were dispensed into each well of a 96-well plate. The plate was incubated at 37 °C by shaking at 150 rpm. The optical density value at 550 nm was detected by a plate reader in a time course.
CFU was determined in a time course after addition of H2O2 to exponentially grown cultures at different densities. 10 % (v/v) AlamarBlue (Life Technologies, Grand Island, NY, USA) stock solution (final concentration of resazurin: 17.5 mm) was made in YT medium. The serially 10-times diluted AlamarBlue was also prepared and kept on ice. 100 μl of each dilution was placed in all wells of a 96-well plate and one well contained 100 μl stock AlamarBlue as the blank. When a desired concentration of H2O2 was added to the cell in the exponential phase, at each time point, a 10 μl culture was transferred into one well containing the supplemented AlamarBlue dilutions. The plate was put in a plate reader (Molecular Devices SpectraMax M5e, Sunnyvale, CA, USA) and the fluorescence was detected (excitation, 544 nm; emission, 590 nm, automix, 5 s) in arbitrary units (FSU). Finally, the cell culture would reach the maximum fluorescence. FSU of each well was normalized by subtracting the fluorescence data of the blank. The linear curve of FSU and time was plotted. On the curve, the time to F50 (half of maximal fluorescence), T50, was pinpointed for each dilution. Then T50 was plotted versus log CFU per ml.
Acknowledgments
This work was supported by National Institutes of Health Grant S06 GM073621 and GM097693 to Z.L. M.L, R.K.A and J.W were supported by the Integrated Biology Ph.D. program at Florida Atlantic University.
References
- Abe T, Tohgi H, Isobe C, Murata T, Sato C. Remarkable increase in the concentration of 8-hydroxyguanosine in cerebrospinal fluid from patients with Alzheimer’s disease. J. Neurosci. Res. 2002;70:447–450. doi: 10.1002/jnr.10349. [DOI] [PubMed] [Google Scholar]
- Broedbaek K, Poulsen HE, Weimann A, Kom GD, Schwedhelm E, Nielsen P, Boger RH. Urinary excretion of biomarkers of oxidatively damaged DNA and RNA in hereditary hemochromatosis. Free Radic. Biol. Med. 2009;47:1230–1233. doi: 10.1016/j.freeradbiomed.2009.08.004. [DOI] [PubMed] [Google Scholar]
- Chang Y, Kong Q, Shan X, Tian G, Ilieva H, Cleveland DW, Rothstein JD, Borchelt DR, Wong PC, Lin CL. Messenger RNA oxidation occurs early in disease pathogenesis and promotes motor neuron degeneration in ALS. PLoS One. 2008;3:e2849. doi: 10.1371/journal.pone.0002849. [DOI] [PMC free article] [PubMed] [Google Scholar]
- Che Y, Wang JF, Shao L, Young T. Oxidative damage to RNA but not DNA in the hippocampus of patients with major mental illness. J. Psych. Neurosci. 2010;35:296–302. doi: 10.1503/jpn.090083. [DOI] [PMC free article] [PubMed] [Google Scholar]
- Cheng ZF, Deutscher MP. Quality control of ribosomal RNA mediated by polynucleotide phosphorase and RNase R. Proc. Natl. Acad. Sci. USA. 2003;100:6388–6393. doi: 10.1073/pnas.1231041100. [DOI] [PMC free article] [PubMed] [Google Scholar]
- Cooke MS, Evans MD, Dizdaroglu M, Lunec J. Oxidative DNA damage: mechanisms, mutation, and disease. FASEB J. 2003;17:1195–1214. doi: 10.1096/fj.02-0752rev. [DOI] [PubMed] [Google Scholar]
- de Souza-Pinto NC, Bohr VA. The mitochondrial theory of aging: involvement of mitochondrial DNA damage and repair. Int. Rev. Neurobiol. 2002;53:519–534. doi: 10.1016/s0074-7742(02)53018-x. [DOI] [PubMed] [Google Scholar]
- Deutscher MP, Hilderman RH. Isolation and partial characterization of Escherichia coli mutants with low levels of transfer ribonucleic acid nucleotidyltransferase. J. Bacteriol. 1974;118:621–627. doi: 10.1128/jb.118.2.621-627.1974. [DOI] [PMC free article] [PubMed] [Google Scholar]
- Ding Q, Markesbery WR, Chen Q, Li F, Keller JN. Ribosome dysfunction is an early event in Alzheimer’s disease. J. Neurosci. 2005;25:9171–9175. doi: 10.1523/JNEUROSCI.3040-05.2005. [DOI] [PMC free article] [PubMed] [Google Scholar]
- Ding Q, Markesbery WR, Cecarinj V, Keller JN. Decreased RNA, and increased RNA oxidation, in ribosomes from early Alzheimer’s disease. Neurochem. Res. 2006;31:705–710. doi: 10.1007/s11064-006-9071-5. [DOI] [PubMed] [Google Scholar]
- ESCODD (European Standards Committee on Oxidative DNA Damage) Gedik CM, Collins A. Establishing the background level of base oxidation in human lymphocyte DNA : results of an interlaboratory validation study. FASEB J. 2005;19:82–84. doi: 10.1096/fj.04-1767fje. [DOI] [PubMed] [Google Scholar]
- Fiala ES, Conaway CC, Mathis JE. Oxidative DNA and RNA damage in the livers of Sprague-Dawley rats treated with the hepatocarcinogen 2-nitropropane. Cancer Res. 1989;49:5518–5522. [PubMed] [Google Scholar]
- Gajewski E, Rao G, Nackerdien Z, Dizdaroglu M. Modification of DNA bases in mammalian chromatin by radiation-generated free radicals. Biochemistry. 1990;29:7876–7882. doi: 10.1021/bi00486a014. [DOI] [PubMed] [Google Scholar]
- Gong X, Tao R, Li Z. Quantification of RNA damage by reverse transcription polymerase chain reactions. Anal. Biochem. 2006;357:58–67. doi: 10.1016/j.ab.2006.06.025. [DOI] [PubMed] [Google Scholar]
- Görg B, Qvartskhava N, Bidmon HJ, Palomero-Gallagher N, Kircheis G, Zilles K, Häussinger D. Oxidative stress markers in the brain of patients with cirrhosis and hepatic encephalopathy. Hepatology. 2010;52:256–265. doi: 10.1002/hep.23656. [DOI] [PMC free article] [PubMed] [Google Scholar]
- Hayakawa H, Hofer A, Thelander L, Kitajima S, Cai Y, Oshiro S, Yakushiji H, Nakabeppu Y, Kuwano M, Sekiguchi M. Metabolic fate of oxidized guanine ribonucleotides in mammalian cells. Biochemistry. 1999;38:3610–3614. doi: 10.1021/bi982361l. [DOI] [PubMed] [Google Scholar]
- Hayakawa H, Kuwano M, Sekiguchi M. Specific binding of 8-oxoguanine-containing RNA to polynucleotide phosphorylase protein. Biochemistry. 2001;40:9977–9982. doi: 10.1021/bi010595q. [DOI] [PubMed] [Google Scholar]
- Hofer T, Badouard C, Bajak E, Ravanat JL, Mattsson A, Cotgreave IA. Hydrogen peroxide causes greater oxidation in cellular RNA than in DNA. Biol. Chem. 2005;386:333–337. doi: 10.1515/BC.2005.040. [DOI] [PubMed] [Google Scholar]
- Hofer T, Seo AY, Prudencio M, Leeuwenburgh C. A method to determine RNA and DNA oxidation simultaneously by HPLC-ECD: greater RNA than DNA oxidation in rat liver after doxorubicin administration. Biol. Chem. 2006;387:103–111. doi: 10.1515/BC.2006.014. [DOI] [PubMed] [Google Scholar]
- Hofer T, Fontana L, Anton SD, Weiss EP, Villareal D, Malayappan B, Leeuwenburgh C. Long-term effects of caloric restriction or exercise on DNA and RNA oxidation levels in white blood cells and urine in humans. Rejuvenation Res. 2008a;11:793–799. doi: 10.1089/rej.2008.0712. [DOI] [PMC free article] [PubMed] [Google Scholar]
- Hofer T, Marzetti E, Xu J, Seo AY, Gulec S, Knutson MD, Leeuwenburgh C, Dupont-Versteegden EE. Increased iron content and RNA oxidative damage in skeletal muscle with aging and disuse atrophy. Exp. Gerontol. 2008b;43:563–570. doi: 10.1016/j.exger.2008.02.007. [DOI] [PMC free article] [PubMed] [Google Scholar]
- Honda K, Smith MA, Zhu X, Baus D, Merrick WC, Tartakoff AM, Hattier T, Harris PL, Siedlak SL, Fujioka H, et al. Ribosomal RNA in Alzheimer disease is oxidized by bound redox-active iron. J. Biol. Chem. 2005;280:20978–20986. doi: 10.1074/jbc.M500526200. [DOI] [PubMed] [Google Scholar]
- Ishibashi T, Hayakawa H, Ito R, Miyazawa M, Yamagata Y, Sekiguchi M. Mammalian enzymes for preventing transcriptional errors caused by oxidative damage. Nucleic Acids Res. 2005;33:3779–3784. doi: 10.1093/nar/gki682. [DOI] [PMC free article] [PubMed] [Google Scholar]
- Kevil CG, Walsh L, Laroux FS, Kalogeris T, Grisham MB, Alexander JS. An improved, rapid Northern protocol. Biochem. Biophys. Res. Commun. 1997;238:277–279. doi: 10.1006/bbrc.1997.7284. [DOI] [PubMed] [Google Scholar]
- Kikuchi A, Takeda A, Onodera H, Kimpara T, Hisanaga K, Sato N, Nunomura A, Castellani RJ, Perry G, Smith MA, et al. Systemic increase of oxidative nucleic acid damage in Parkinson’s disease and multiple system atrophy. Neurobiol. Dis. 2002;9:244–248. doi: 10.1006/nbdi.2002.0466. [DOI] [PubMed] [Google Scholar]
- Kong Q, Lin CL. Oxidative damage to RNA: mechanisms, consequences, and diseases. Cell Mol. Life Sci. 2010;67:1817–1829. doi: 10.1007/s00018-010-0277-y. [DOI] [PMC free article] [PubMed] [Google Scholar]
- Li Z, Deutscher MP. Analyzing the Decay of stable RNAs in E.coli. Methods Enzymol. 2009;447:31–45. doi: 10.1016/S0076-6879(08)02202-7. [DOI] [PMC free article] [PubMed] [Google Scholar]
- Li Z, Reimers S, Pandit S, Deutscher MP. RNA quality control: degradation of defective transfer RNA. EMBO J. 2002;21:1132–1138. doi: 10.1093/emboj/21.5.1132. [DOI] [PMC free article] [PubMed] [Google Scholar]
- Li Z, Wu J, Deleo CJ. RNA damage and surveillance under oxidative stress. IUBMB Life. 2006;58:581–588. doi: 10.1080/15216540600946456. [DOI] [PubMed] [Google Scholar]
- Liu J, Head E, Gharib AM, Yuan W, Ingersoll RT, Hagen TM, Cotman CW, Ames BN. Memory loss in old rats is associated with brain mitochondrial decay and RNA/DNA oxidation: partial reversal by feeding acetyl-L-carnitine and/or R-alpha-lipoic acid. Proc. Natl. Acad. Sci. USA. 2002;99:2356–2361. doi: 10.1073/pnas.261709299. [DOI] [PMC free article] [PubMed] [Google Scholar]
- Martinet W, de Meyer GR, Herman AG, Kockx MM. Reactive oxygen species induce RNA damage in human atherosclerosis. Eur. J. Clin. Invest. 2004;34:323–327. doi: 10.1111/j.1365-2362.2004.01343.x. [DOI] [PubMed] [Google Scholar]
- Nunomura A, Perry G, Pappolla MA, Wade R, Hirai K, Chiba S, Smith MA. RNA oxidation is a prominent feature of vulnerable neurons in Alzheimer’s disease. J. Neurosci. 1999;19:1959–1964. doi: 10.1523/JNEUROSCI.19-06-01959.1999. [DOI] [PMC free article] [PubMed] [Google Scholar]
- Nunomura A, Chiba S, Kosaka K, Takeda A, Castellani RJ, Smith MA, Perry G. Neuronal RNA oxidation is a prominent feature of dementia with Lewy bodies. Neuroreport. 2002;13:2035–2039. doi: 10.1097/00001756-200211150-00009. [DOI] [PubMed] [Google Scholar]
- Nunomura A, Hofer T, Moreira PI, Castellani RJ, Smith MA, Perry G. RNA oxidation in Alzheimer disease and related neurodegenerative disorders. Acta Neuropathol. 2009;118:151–166. doi: 10.1007/s00401-009-0508-1. [DOI] [PubMed] [Google Scholar]
- Radak Z, Boldogh I. 8-Oxo-7,8-dihydroguanine: links to gene expression, aging, and defense against oxidative stress. Free Radic. Biol. Med. 2010;49:587–596. doi: 10.1016/j.freeradbiomed.2010.05.008. [DOI] [PMC free article] [PubMed] [Google Scholar]
- Rhee Y, Valentine MR, Termini J. Oxidative base damage in RNA detected by reverse transcriptase. Nucleic Acids Res. 1995;23:3275–3282. doi: 10.1093/nar/23.16.3275. [DOI] [PMC free article] [PubMed] [Google Scholar]
- Ron E, Kohler R, Davis B. Polysomes extracted from Escherichia coli by freeze-thaw-lysozyme lysis. Science. 1966;153:1119–1120. doi: 10.1126/science.153.3740.1119. [DOI] [PubMed] [Google Scholar]
- Seo AY, Xu J, Servais S, Hofer T, Marzetti E, Wohlgemuth SE, Knutson MD, Chung HY, Leeuwenburgh C. Mitochondrial iron accumulation with age and functional consequences. Aging Cell. 2008;7:706–716. doi: 10.1111/j.1474-9726.2008.00418.x. [DOI] [PMC free article] [PubMed] [Google Scholar]
- Shan X, Tashiro H, Lin CL. The identification and characterization of oxidized RNAs in Alzheimer’s disease. J. Neurosci. 2003;23:4913–4921. doi: 10.1523/JNEUROSCI.23-12-04913.2003. [DOI] [PMC free article] [PubMed] [Google Scholar]
- Shan X, Chang Y, Lin CL. Messenger RNA oxidation is an early event preceding cell death and causes reduced protein expression. FASEB J. 2007;21:2753–2764. doi: 10.1096/fj.07-8200com. [DOI] [PubMed] [Google Scholar]
- Shen Z, Wu W, Hazen SL. Activated leukocytes oxidatively damage DNA, RNA, and the nucleotide pool through halide-dependent formation of hydroxyl radical. Biochemistry. 2000;39:5474–5482. doi: 10.1021/bi992809y. [DOI] [PubMed] [Google Scholar]
- Székely M, Brimacombe R, Morgan J. A specific ribonucleoprotein fragment from Escherichia coli 30-S ribosomes. Location of the RNA component in 16-S RNA. Eur. J. Biochem. 1973;35:574–581. doi: 10.1111/j.1432-1033.1973.tb02875.x. [DOI] [PubMed] [Google Scholar]
- Taddei F, Hayakawa H, Bouton M, Cirinesi A, Matic I, Sekiguchi M, Radman M. Counteraction by MutT protein of transcriptional errors caused by oxidative damage. Science. 1997;278:128–130. doi: 10.1126/science.278.5335.128. [DOI] [PubMed] [Google Scholar]
- Tanaka M, Chock PB, Stadtman ER. Oxidized messenger RNA induces translation errors. Proc. Natl. Acad. Sci. USA. 2007;104:66–71. doi: 10.1073/pnas.0609737104. [DOI] [PMC free article] [PubMed] [Google Scholar]
- Tateyama M, Takeda A, Onodera Y, Matsuzaki M, Hasegawa T, Nunomura A, Hirai K, Perry G, Smith MA, Itoyama Y. Oxidative stress and predominant Abeta42(43) deposition in myopathies with rimmed vacuoles. Acta Neuropathol. (Berl.) 2003;105:581–585. doi: 10.1007/s00401-003-0685-2. [DOI] [PubMed] [Google Scholar]
- Vaidyanathan PP, Deutscher MP, Malhotra A. RluD, a highly conserved pseudouridine synthase, modifies 50S subunits more specifically and efficiently than free 23S rRNA. RNA. 2007;13:1868–1876. doi: 10.1261/rna.711207. [DOI] [PMC free article] [PubMed] [Google Scholar]
- Wardman P, Candeias LP. Fenton chemistry: an introduction. Radiat. Res. 1996;145:523–531. [PubMed] [Google Scholar]
- Weidner AM, Bradley MA, Beckett TL, Niedowicz DM, Dowling AL, Matveev SV, Levine H, III, Lovell MA, Murphy MP. RNA oxidation adducts 8-OHG and 8-OHA change with Aβ(42) levels in late-stage Alzheimer’s disease. PLoS One. 2011;6:e24930. doi: 10.1371/journal.pone.0024930. [DOI] [PMC free article] [PubMed] [Google Scholar]
- Wu J, Li Z. Human polynucleotide phosphorylase reduces oxidative RNA damage and protects HeLa cell against oxidative stress. Biochem. Biophys. Res. Commun. 2008;372:288–292. doi: 10.1016/j.bbrc.2008.05.058. [DOI] [PMC free article] [PubMed] [Google Scholar]
- Wu J, Jiang Z, Liu M, Gong X, Wu S, Burns CM, Li Z. Polynucleotide phosphorylase protects Escherichia coli against oxidative stress. Biochemistry. 2009;48:2012–2020. doi: 10.1021/bi801752p. [DOI] [PMC free article] [PubMed] [Google Scholar]
- Wurtmann EJ, Wolin SL. RNA under attack: cellular handling of RNA damage. Crit. Rev. Biochem. Mol. Biol. 2009;44:34–49. doi: 10.1080/10409230802594043. [DOI] [PMC free article] [PubMed] [Google Scholar]
- Zhang J, Perry G, Smith MA, Robertson D, Olson SJ, Graham DG, Montine TJ. Parkinson’s disease is associated with oxidative damage to cytoplasmic DNA and RNA in substantia nigra neurons. Am. J. Pathol. 1999;154:1423–1429. doi: 10.1016/S0002-9440(10)65396-5. [DOI] [PMC free article] [PubMed] [Google Scholar]