Abstract
Kupffer cells are a key source of mediators of alcohol-induced liver damage such as reactive oxygen species, chemokines, growth factors, and eicosanoids. Since diets rich in polyunsaturated fatty acids are a requirement for the development of alcoholic liver disease, we hypothesized that polyunsaturated fatty acids could synergize with ethanol to promote Kupffer cell activation and TNFα production, hence, contributing to liver injury. Primary Kupffer cells from control and from ethanol-fed rats incubated with arachidonic acid showed similar proliferation rates than nontreated cells; however, arachidonic acid induced phenotypic changes, lipid peroxidation, hydroperoxides, and superoxide radical generation. Similar effects occurred in human Kupffer cells. These events were greater in Kupffer cells from ethanol-fed rats, and antioxidants and inhibitors of arachidonic acid metabolism prevented them. Arachidonic acid treatment increased NADPH oxidase activity. Inhibitors of NADPH oxidase and of arachidonic acid metabolism partially prevented the increase in oxidant stress. Upon arachidonic acid stimulation, there was a rapid and sustained increase in TNFα, which was greater in Kupffer cells from ethanol-fed rats than in Kupffer cells from control rats. Arachidonic acid induced ERK1/2 phosphorylation and nuclear translocation of early growth response-1 (Egr1), and ethanol synergized with arachidonic acid to promote this effect. PD98059, a mitogen extracellular kinase 1/2 inhibitor, and curcumin, an Egr1 inhibitor, blocked the arachidonic acid-mediated upregulation of TNFα in Kupffer cells. This study unveils the mechanism whereby arachidonic acid and ethanol increase TNFα production in Kupffer cells, thus contributing to alcoholic liver disease.
Keywords: polyunsaturated fatty acids, alcoholic liver disease, reduced nicotinamide adenine dinucleotide phosphatase oxidase, oxidative stress, antioxidants, early growth response-1, tumor necrosis factor-α, extracellular signal-regulated kinase
alcoholic liver disease (ALD) is mediated, among others, by activation of Kupffer cells (KC; Refs. 2, 12, 20, 39, 44–45, 48). It has been demonstrated that alcohol-induced liver injury occurs only in rodents fed ethanol with polyunsaturated (PUFAs) but not with saturated fatty acids. Enhanced oxidative stress, circulating endotoxin, and proinflammatory chemokines also play a major role in the pathogenesis of ALD (24–25). In addition, PUFAs are precursors for the synthesis of eicosanoids and monohydroxy eicosatetraenoic acids, contributing to the inflammatory response.
KC are resident macrophages recruited upon the onset of liver injury and are known to play a central role in the homeostatic response to hepatic damage. Upon stimulation, they immediately respond to the insult and release mediators that drive inflammatory and reparative responses, and they defend against invading microorganisms and function as the major site for endotoxin clearance (43). Once activated, KC release a wide array of soluble mediators such as reactive oxygen species (ROS), nitric oxide, chemokines, growth factors, cyclooxygenase (COX), and lipoxygenase (LOX) metabolites, all of which provide pivotal paracrine effects on other liver cells (10, 27, 43).
In ALD, the cascade of events activating KC initiates in response to enhanced translocation of Gram-negative bacteria from the gut into the portal circulation, leading to increased endotoxin levels and stimulation of KC to produce TNFα and other proinflammatory mediators. TNFα is the master initiator of the hepatic inflammatory response (3, 17, 43), and it induces the expression of chemokines, facilitating the transmigration of inflammatory cells into the subendothelial space (17, 43, 45). KC-derived TNFα also affects hepatocyte viability, hence, contributing to alcohol-induced liver injury (1, 4, 35). Thus the homeostatic responses are initiated by KC-derived mediators to promote reparative mechanisms against damage (42).
A key source of ROS in KC is NADPH oxidase. During the oxidative burst of KC phagocytic activity, NADPH oxidase catalyzes a one-electron reduction of O2 to generate superoxide radical (O2·−) at the expense of NADPH. Under normal conditions, KC have limited ability to generate ROS; however, after a “priming” event, such as that mediated by endotoxin or chemokines, they increase ROS production, which becomes maximal during phagocytosis.
PUFAs are a requirement for the development of ALD, and TNFα plays a significant role in the pathogenesis of ALD. We (10) previously demonstrated that ethanol in combination with PUFAs upregulates two powerful antifibrogenic molecules such as TNFα and glutathione (GSH). In the current work, we focused on analyzing the underlying mechanisms by which PUFAs and ethanol promote KC activation and TNFα production, thus contributing to liver injury. This study identified a key role for NADPH oxidase-derived ROS, extracellular ERK1/2 phosphorylation, and early growth response-1 (Egr1) nuclear translocation to the mechanism whereby ethanol and PUFAs synergize to upregulate TNFα production in KC.
MATERIALS AND METHODS
Isolation of primary KC.
Primary rat KC were isolated using pronase and liberase blendzyme-3 (Roche, Indianapolis, IN) followed by density gradient in Optiprep (11% over 17%) and elutriation according to previously established protocols (28). Primary human KC were isolated from normal liver margin of patients undergoing hepatic tumor resection following the same procedure albeit using higher concentration of enzymes (28). Human KC were kindly donated by Dr. Hong (Mount Sinai School of Medicine, New York, NY). Cells were further purified by cell sorting using CD163-FITC as a KC-specific marker. KC can be maintained up to 14 days in culture preserving their ultrastructural and cytochemical characteristics while becoming activated over time. KC (5 × 10⁵ cells) were seeded on sixwell plates using DMEM-F12 with 10% FBS. The medium was replaced every 2 days, 0–10 μM arachidonic acid (AA) were added 6 days later, and the cell culture medium and cell lysates were collected at selected time points, depending on the experiment, for subsequent assays.
Chronic alcohol feeding model.
Rats (300 g female Sprague-Dawley; n = 10/group) were fed either the control or the ethanol Lieber-DeCarli diets (21) (Bio-Serv, Frenchtown, NJ) for 8 mo with progressive increase in ethanol-derived calories (1 wk with 10%, 1 wk with 20%, and 7.5 mo with 35%). Rats were pair fed throughout the experiment. All animals received humane care according to the criteria outlined in the Guide for the Care and Use of Laboratory Animals prepared by the National Academy of Sciences and published by the National Institutes of Health. The protocol was approved by the IACUC office at our institution.
General methodology.
Endotoxin-free AA, to avoid KC activation, was conjugated to BSA as previously described (10). Cell viability under each treatment was monitored by the 3-(4,5-dimethylthiazol-2-yl)-2,5-diphenyltetrazolium bromide (MTT) assay. Cell proliferation was calculated from the rate of incorporation of methyl[3H]thymidine into the DNA of KC (29). Secreted TNFα was measured by ELISA (Invitrogen, Carlsbad, CA) and intracellular TNFα by flow cytometry using a TNFα-PE Ab (BD Biosciences, San Diego, CA). ATP levels were determined using the luciferase ATP assay kit (Sigma, St. Louis, MO).
Oxidant stress measurements.
Intracellular lipid peroxidation (LPO) was determined by addition of 10 μM cis-parinaric acid (Invitrogen) for 1 h and measurement of the fluorescence signal at 405 nm, based on the method of Hedley and Chow (16). Thiobarbituric acid reactive substances (TBARS) were assayed to measure extracellular lipid peroxidation according to the method of Fraga et al. (13) calculating the concentration of malondialdehyde from a standard curve of malondialdehyde bis-dimethylacetal. Intracellular hydroperoxides [mostly hydrogen peroxide (H2O2)] and O2·− were assessed by flow cytometry using the fluorescent probes 2′,7′-dichlorodihydrofluorescein diacetate and dihydroethidium, respectively (Invitrogen). Extracellular hydroperoxides (mostly H2O2) were measured using the ferrous oxidation-xylenol orange assay (22). GSH levels, catalase, and SOD activities were measured according to published methods (6, 9, 15, 30, 33).
Enzymatic activities.
CYP2E1 activity was measured using the fluorescent substrate 7-methoxy-4-trifluoromethyl coumarin (Sigma) (11). Xanthine oxidase activity was calculated from the rate of formation of urate from hypoxanthine. NADPH oxidase activity was determined by the lucigenin assay as described previously (7).
Quantitative RT-PCR.
Total RNA was extracted from KC using the PureLink micro-to-midi total RNA purification system (Invitrogen). cDNA was synthesized using the FastStart PCR Master Mix (Roche), and quantitative RT-PCR reactions were performed with the Roche Light Cycler. Primers for the Light Cycler reaction are listed on Table 1. The specific target expression was calculated using the cycle threshold method. Each sample was amplified in triplicate, and each gene was analyzed on samples from at least three individual experiments.
Table 1.
Primers for quantitative RT-PCR
| Gene | Forward (5′ → 3′) | Reverse (5′ → 3′) |
|---|---|---|
| Rat TNFα | CTCCCAGGTTCTCTTCAAGG | TGGAAGACTCCTCCCAGGTA |
| Human TNFα | TCTTCTCGAACCCCGAGTGA | CCTCTGATGGCACCACCAG |
| Rat GAPDH | GGCATGGTGGAAGGGCTCAT | AGGGATGATGTTCTGGGCTGC |
| Human GAPDH | CAATGACCCCTTCATTGACC | GATCTCGCTCCTGGATG |
Western blot analysis.
Western blot analysis was performed with proteins from cell lysate or from nuclear extracts as previously described (23). Primary antibodies (1/2,000 to 1/5,000) for total ERK1/2 and pERK1/2 were purchased from Cell Signaling (Danvers, MA). Antibodies for Egr1, GAPDH, and β-tubulin were from Santa Cruz Biotechnology (Santa Cruz, CA). Goat anti-rabbit IgG and goat anti-mouse IgG (1/5,000; Chemicon, Billerica, MA) were used as secondary antibodies. The signal was detected using the ECL system (GE Healthcare, Princeton, NJ) using a Laser4000 (Fujitsu, Stamford, CT). Quantification of the intensity of the Western blot bands was carried out using NIH ImageJ software.
Statistical analysis.
Data were analyzed by a two-factor ANOVA. Results are expressed as means ± SE (n > 6).
RESULTS
As previously reported (10), our initial experiments involved dose-response and a time-course studies to determine the dose of AA and the time of incubation of KC from control (KCControl) and from ethanol-fed rats (KCEthanol) that did not alter cell viability but caused a modest increase in cell proliferation in primary KCEthanol.
AA induces oxidant stress in KC.
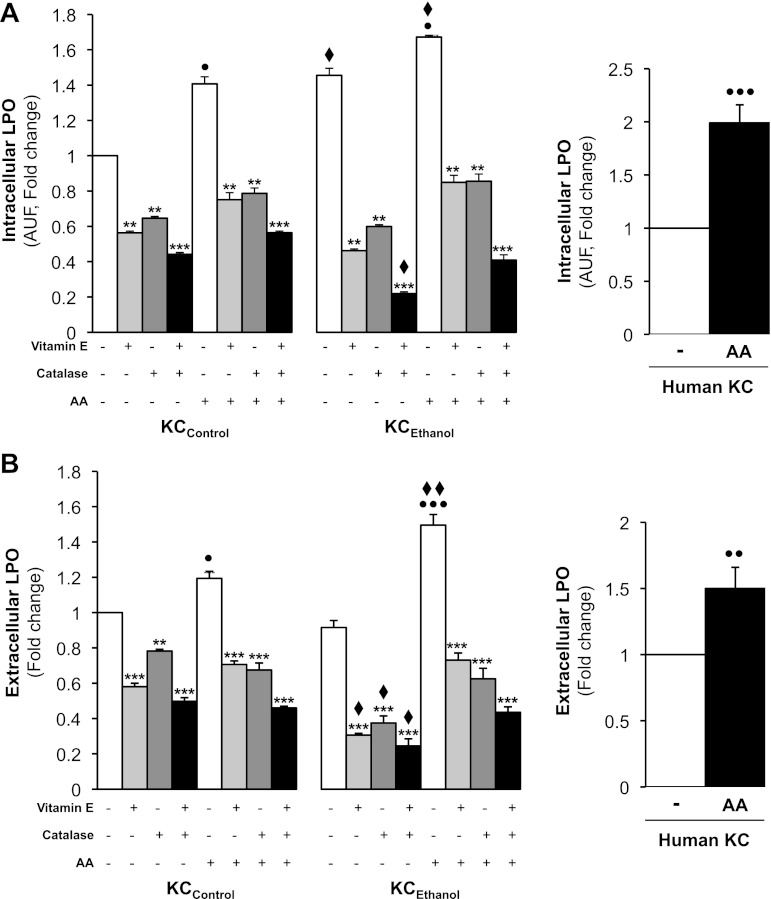
Since the AA challenge induced phenotypic changes indicative of KC activation, we next measured the levels of candidate mediators that could affect key downstream targets in KC, such as TNFα, due to its role in ALD. Intracellular LPO end products, hydroperoxides (mostly H2O2), and O2·− as well as extracellular TBARS and hydroperoxides (mainly H2O2) were measured. There was a 40% increase in intracellular LPO over KCControl and a 25% increase over KCEthanol after AA treatment (Fig. 1A, left). A twofold increase was observed in control human KC (Fig. 1A, right). Secreted LPO-derived products increased by 20% in KCControl and by 60% in KCEthanol due to AA treatment (Fig. 1B, left). Extracellular LPO was 50% higher in AA-treated control human KC than in nontreated cells (Fig. 1B, right). The effects in rat KC were blocked by either vitamin E, which prevents LPO; catalase, which decomposes H2O2; or by the combination of both (Fig. 1, A and B, left). Thus these experiments suggest that AA induces LPO more in KCEthanol than in KCControl.
Fig. 1.
Arachidonic acid (AA) exposure increases intra- and extracellular lipid peroxidation (LPO) in Kupffer cells (KC). KC from control (KCControl) and from ethanol-fed rats (KCEthanol) and human KC were incubated with 0–10 μM AA for 24 h. Intracellular LPO measured by cis-parinaric acid fluorescence in KCControl and KCEthanol (A, left) and in human KC (A, right). Extracellular LPO end products analyzed by thiobarbituric acid reactive substances (TBARS) in KCControl and KCEthanol (B, left) and in human KC (B, right) were determined. KCControl and KCEthanol were also cotreated with 0–50 μM vitamin E, 0–200 U/ml catalase, or the combination of both. Results are calculated as fold change over the nontreated KCControland are expressed as means ± SE for n = 6. AUF, arbitrary units of fluorescence. ●P < 0.05, ●●P < 0.01, and ●●●P < 0.001 for AA treated vs. control; **P < 0.01 and ***P < 0.001 for antioxidant treated or cotreated vs. control; ♦P < 0.05 and ♦♦P < 0.01 for KCEthanol vs. KCControl.
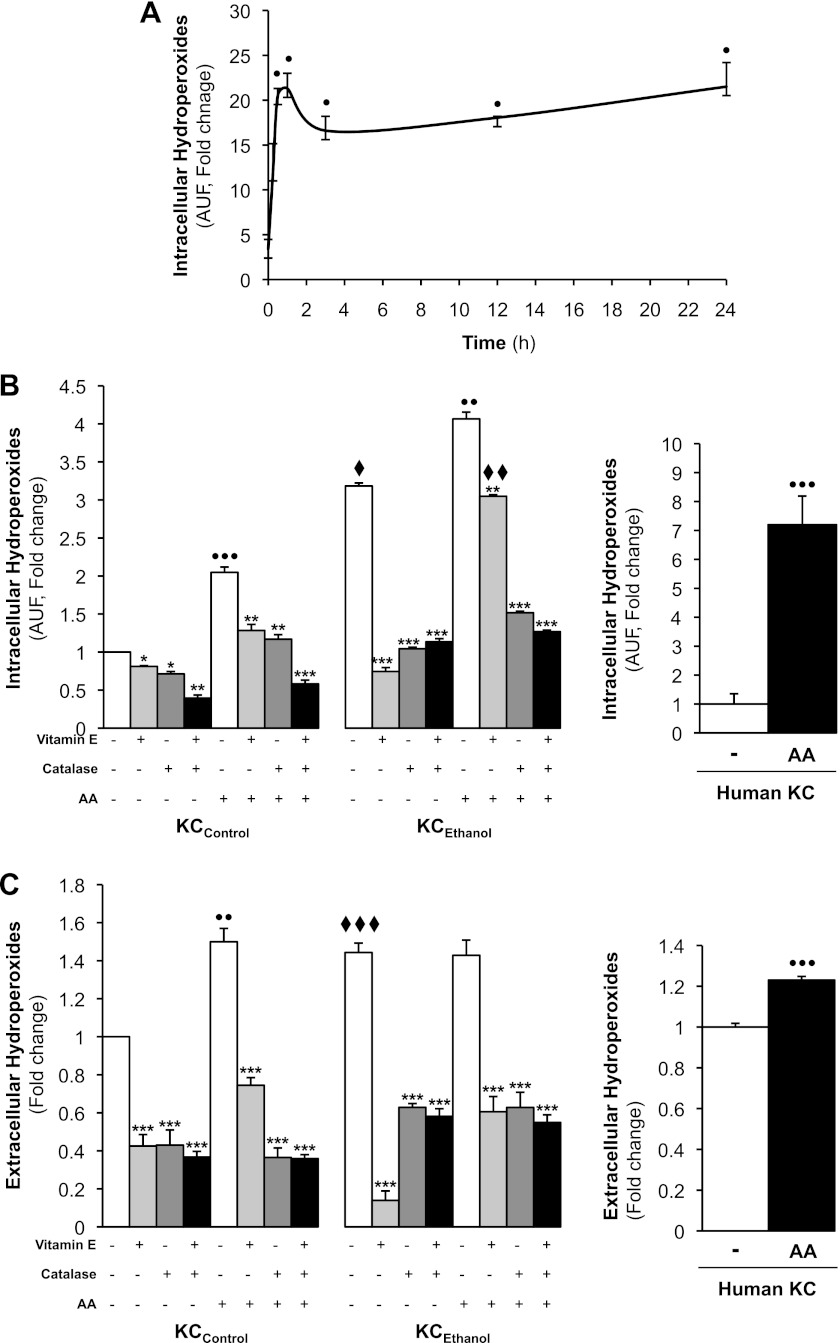
Since hydroperoxides participate in alcohol-mediated liver injury, we next determined the effects of AA on the generation of hydroperoxides. Because AA caused a rapid and sustained induction of intracellular hydroperoxides in KCControl (Fig. 2A), we then compared the AA-mediated generation of hydroperoxides in KCControland KCEthanol at the 24-h time point. AA increased intracellular hydroperoxides generation by 100% in KCControl and by 40% in KCEthanol (Fig. 2B, left) as well as by sevenfold in control human KC (Fig. 2B, right) compared with their respective controls. Likewise, extracellular hydroperoxides increased by 50% in KCControl (Fig. 2C, left) and by 20% in control human KC (Fig. 2C, right) by AA compared with their respective controls. The induction of both intra- and extracellular hydroperoxides in KCControl and KCEthanol in rat KC was blunted by vitamin E, by catalase, or by the combination of both (Fig. 2, B and C, left). Overall, the data indicate that AA induces the generation of hydroperoxides, mainly intracellular, more in KCEthanol than in KCControl.
Fig. 2.
AA treatment increases intra- and extracellular hydroperoxides in KC. A time-course experiment was carried out with KCControl in the presence of 0–10 μM AA from 0 to 24 h and intracellular hydroperoxides were measured by 2′,7′-dichlorodihydrofluorescein diacetate (DCFDA) fluorescence (A). KCControl, KCEthanol, and human KC were incubated with 0–10 μM AA for 24 h. Intracellular hydroperoxides (mostly H2O2) were assessed by DCFDA fluorescence in KCControl and KCEthanol (B, left) and in human KC (B, right). Hydroperoxides secreted to the culture medium were measured by the ferrous oxidation-xylenol orange method in KCControl and KCEthanol (C, left) and in human KC (C, right). KCControl and KCEthanol were also cotreated with 0–50 μM vitamin E, 0–200 U/ml catalase, or the combination of both. Results are calculated as fold change over the nontreated KCControland are expressed as means ± SE for n = 6. ●P < 0.05, ●●P < 0.01 and ●●●P < 0.001 for AA treated vs. control; *P < 0.05, **P < 0.01, and ***P < 0.001 for antioxidant treated or cotreated vs. control; ♦P < 0.05, ♦♦P < 0.01, and ♦♦♦P < 0.001 for KCEthanol vs. KCControl.
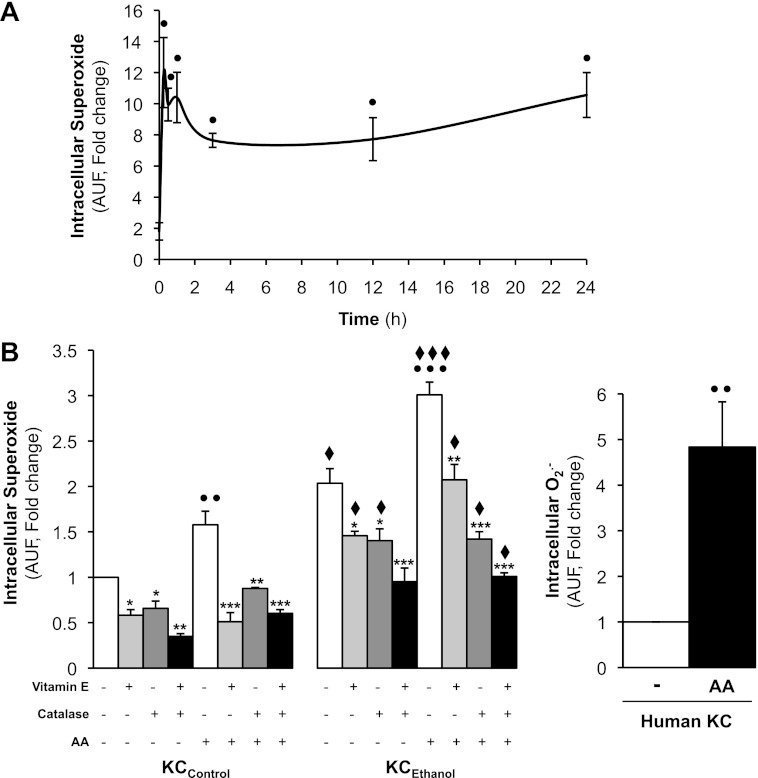
Lastly, we measured the effects of AA on O2·− generation, a highly reactive nondiffusible species involved in ALD. Because AA caused a rapid and sustained induction of intracellular O2·− in KCControl (Fig. 3A), we then compared the effect of the AA-driven O2·− generation in KCControland KCEthanol at the 24-h time point. Intracellular levels of O2·− were elevated by 60% both in KCControland in KCEthanol (Fig. 3B, left) and by fivefold in control human KC (Fig. 3B, right) treated with AA compared with their respective controls. The effects on rat KC were prevented by addition of vitamin E, by catalase, or by the combination of both (Fig. 3B, left). In aggregate, these results demonstrate that AA elevates O2·− more in KCEthanol than in KCControl.
Fig. 3.
AA increases intracellular O2·− in KC. A time-course experiment was carried out with KCControl in the presence of 0–10 μM AA from 0 to 24 h, and intracellular O2·− was measured by dihydroethidium (DHE) fluorescence (A). KCControl, KCEthanol(B, left), and human KC (B, right) were incubated with 0–10 μM AA for 24 h, and intracellular O2·− was assessed by DHE fluorescence. KCControl and KCEthanol were cotreated with 0–50 μM vitamin E, 0–200 U/ml catalase, or the combination of both. Results are calculated as fold change over nontreated KCControland are expressed as means ± SE for n = 6. ●P < 0.05, ●●P < 0.01, and ●●●P < 0.001 for AA treated vs. control; *P < 0.05, **P < 0.01, and ***P < 0.001 for antioxidant treated or cotreated vs. control; ♦P < 0.05 and ♦♦♦P < 0.001 for KCEthanol vs. KCControl.
Since AA elevated LPO and ROS more in KCEthanolthan in KCControl, we next determined whether additional changes occurred in the cellular antioxidant defense by analyzing the activity of antioxidant enzymes as well as GSH levels. Both in KCControl and in human KC, GSH levels remained similar in the absence or presence of AA but increased slightly by AA challenge in KCEthanol; however, AA elevated SOD and catalase activities in all cases (Tables 2 and 3). Thus AA increased the antioxidant defense in KC, possibly as a protection to counteract the increase in prooxidant species.
Table 2.
Antioxidant defense in KCControl and KCEthanol
| KCControl |
KCEthanol |
|||
|---|---|---|---|---|
| Control | 10 μM | Control | 10 μM | |
| GSH, nmol/mg prot | 15.7 ± 0.2 | 16.8 ± 0.5 | 23.3 ± 2.4♦ | 27.9 ± 0.9♦♦ |
| SOD, U/mg prot | 0.8 ± 0.2 | 1.7 ± 0.8● | 0.8 ± 0.25 | 1.6 ± 0.6● |
| Catalase, U/mg prot | 55 ± 0.8 | 133 ± 0.6●●● | 60 ± 1.2♦ | 144 ± 3.8●●● |
Results are means ± SE; n = 6. GSH levels, SOD, and catalase activities were determined in KC from control (KCControl) and from ethanol-fed rats (KCEthanol) in the presence of 0–10 μM arachidonic acid (AA).
P < 0.05 and
P < 0.001 for AA treated vs. control;
P < 0.05 and
P < 0.01 for KCEthanol vs. KCControl.
Table 3.
Antioxidant defense in human KC
| Human KC |
||
|---|---|---|
| Control | 10 μM | |
| GSH, nmol/mg prot | 14.2 ± 0.8 | 13.7 ± 0.6 |
| SOD, nmol/mg prot | 671 ± 9.4 | 862 ± 25.2● |
| Catalase, U/mg prot | 48.4 ± 1.9 | 77.3 ± 2.9● |
Results are means ± SE; n = 3. GSH levels, SOD, and catalase activities were measured in human KC in the presence of 0–10 μM AA.
P < 0.05 for AA treated vs. control.
We then asked whether AA could alter ATP levels and/or affect the activity of key enzymes known to generate ROS. AA slightly increased ATP levels in KCControl, KCEthanol, and slightly in control human KC (Tables 4 and 5). Xanthine oxidase and cytochrome P450 2E1 (CYP2E1) activities remained quite similar in no-treated KCControl, KCEthanol and in control human KC but were slightly elevated by AA challenge in all cases (Tables 4 and 5). As previously shown (10), NADPH oxidase activity increased by 80% in KCControl, by 140% in KCEthanol, and by 50% in control human KC treated with AA (Tables 4 and 5). Hence, induction of NADPH oxidase activity by AA challenge could condition further downstream noxious effects in KC.
Table 4.
ATP levels and sources of ROS in KCControl and KCEthanol
| KCControl |
KCEthanol |
|||
|---|---|---|---|---|
| Control | 10 μM | Control | 10 μM | |
| ATP, AU/mg prot | 18 ± 0.9 | 22 ± 1.2● | 18.3 ± 0.1 | 21 ± 0.3● |
| Xanthine oxidase, U/mg prot | 41 ± 3.0 | 47 ± 1.7 | 40 ± 1.0 | 50 ± 2.3● |
| CYP2E1, AU/mg prot | 7.5 ± 0.1 | 9.7 ± 0.1●● | 8.4 ± 0.4 | 13.8 ± 0.8●,♦ |
| NADPH oxidase, U/mg prot | 13 ± 0.8 | 23.3 ± 0.3●● | 22.3 ± 1.0 | 53.7 ± 1.2●●,♦♦ |
Results are means ± SE; n = 6. ATP levels, NADPH oxidase, xanthine oxidase, and cytochrome P450 2E1 (CYP2E1) activities were determined in KCControl and KCEthanol in the presence of 0–10 μM AA. AU, arbitrary units.
P < 0.05 and
P < 0.01 for AA treated vs. control;
P < 0.05 and
P < 0.01 for KCEthanol vs. KCControl.
Table 5.
ATP levels and sources of ROS in human KC
| Human KC |
||
|---|---|---|
| Control | 10 μM | |
| ATP, AU/mg prot | 11.3 ± 1.5 | 13.7 ± 1.7 |
| Xanthine oxidase, U/mg prot | 39.4 ± 2.3 | 41.1 ± 1.8 |
| CYP2E1, AU/mg prot | 8.8 ± 0.6 | 11.4 ± 0.8●● |
| NADPH oxidase, U/mg prot | 10.6 ± 0.2 | 16.2 ± 0.7● |
Results are means ± SE; n = 3. ATP levels, NADPH oxidase, xanthine oxidase, and CYP2E1 activities were measured in human KC in the presence of 0–10 μM AA. ROS, reactive oxygen species.
P < 0.05 and
P < 0.01 for AA treated vs. control.
To prove that AA upregulation of NADPH oxidase activity contributed to ROS generation, KCControl and KCEthanol were preincubated with diphenyleneiodonium (DPI), a NADPH oxidase inhibitor. DPI reduced the AA-mediated increase in intracellular O2·− and LPO in KCControl and KCEthanol compared with nontreated cells (Table 6). TBARS and secreted hydroperoxides were also elevated (not shown). Therefore, these results prove that NADPH oxidase plays a major role in the effects mediated by AA on KC-derived ROS generation.
Table 6.
Intracellular hydroperoxides, O2·−, and LPO in KCControl and KCEthanol
| Hydroperoxides |
O2·− |
LPO |
|||||
|---|---|---|---|---|---|---|---|
| AA | − | DPI | − | DPI | − | DPI | |
| KCControl | − | 10.1 ± 0.1 | 9.1 ± 0.1 | 7.1 ± 0.3 | 4.9 ± 1.3 | 6.4 ± 0.2 | 2.4 ± 0.2♦♦♦ |
| + | 14.8 ± 2.0●●● | 11.1 ± 0.1● | 9.3 ± 1.3 | 4.3 ± 1.2 | 10.1 ± 0.8●● | 4.2 ± 0.2●,♦♦ | |
| KCEthanol | − | 15.8 ± 2.0♦♦♦ | 15.8 ± 0.4♦♦♦ | 8.8 ± 1.0 | 5.1 ± 2.4 | 8.2 ± 0.6 | 2.5 ± 0.2♦ |
| + | 18.4 ± 0.1●,♦♦ | 18.36 ± 0.1●,♦♦♦ | 12.5 ± 1.1●,♦ | 6.7 ± 1.3 | 9.9 ± 0.4● | 6.1 ± 0.8●●,♦ | |
Results are expressed as arbitrary units of fluorescence per minute per 1.5 × 10⁵ cells and are means ± SE; n = 6. Intracellular hydroperoxides, (O2·−), and lipid peroxidation (LPO) were determined in KCControl and KCEthanol in the presence of 0–10 μM AA and cotreated with 5 μM diphenyleneiodonium (DPI), a NADPH oxidase inhibitor.
P < 0.05,
P < 0.01 and
P < 0.001 for AA treated vs. control;
P < 0.05,
P < 0.01, and
P < 0.001 for KCEthanol vs. KCControl.
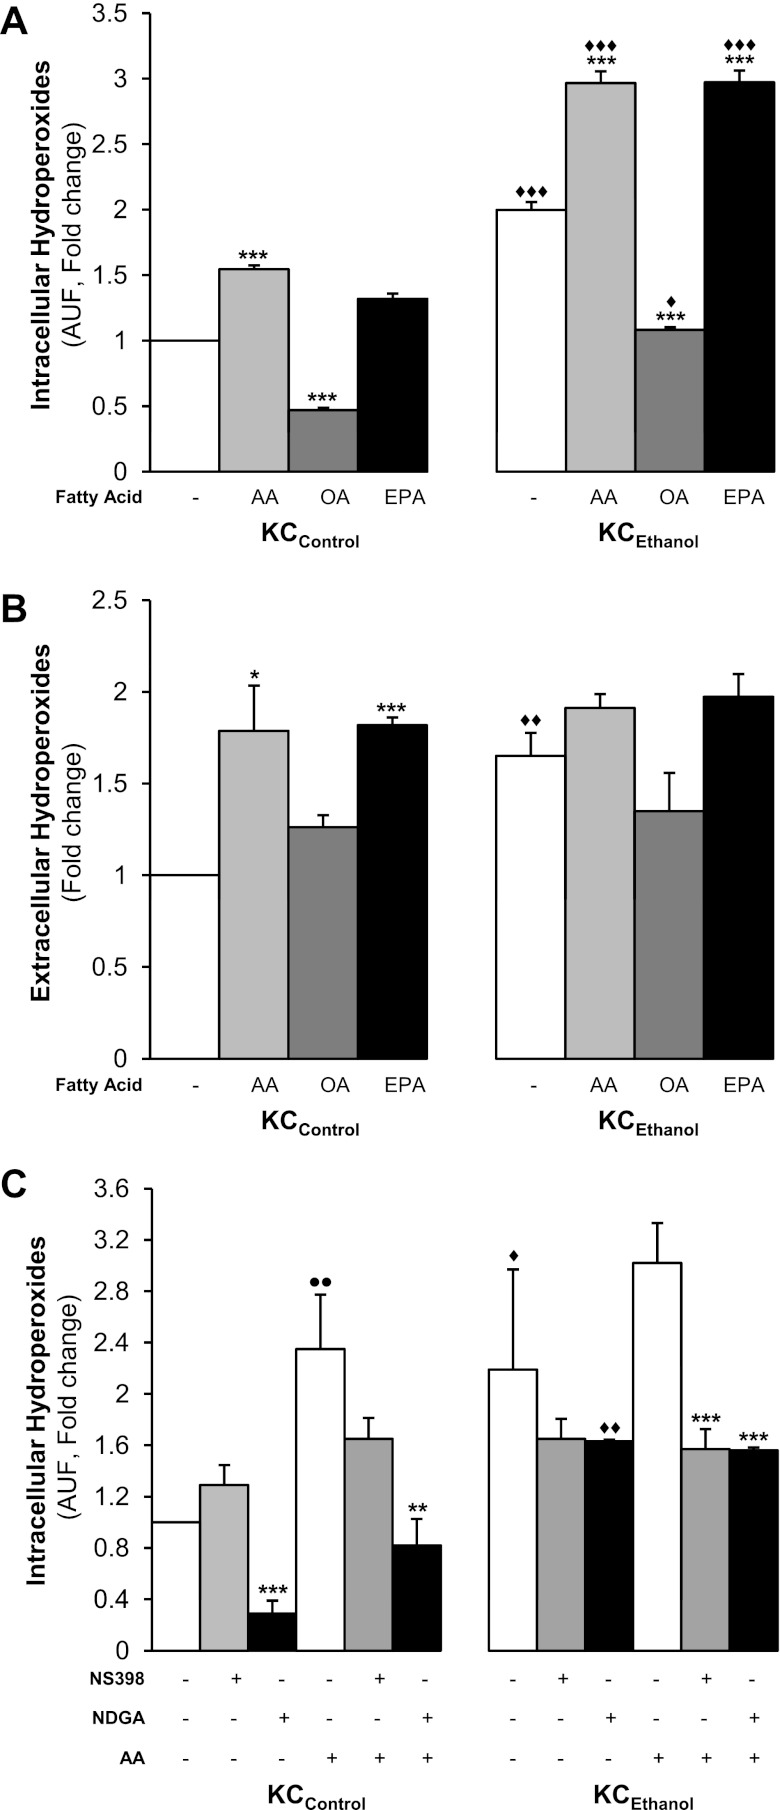
To determine whether the effects on KC-mediated ROS production were exclusive of AA, as a representative PUFA, or were also induced by other fatty acids, KCControland KCEthanol were incubated with oleic acid (OA), a monounsaturated fatty acid, or with eicosapentaenoic acid (EPA), a n-3 series PUFA. Intracellular and secreted hydroperoxides (mostly H2O2) were elevated in the presence of AA and EPA but not by OA (Fig. 4, A and B). The effects on intracellular hydroperoxides were greater in KCEthanol. Similar results were observed for LPO and O2·− (not shown). Thus PUFAs in combination with ethanol increase ROS generation by KC and this effect is higher in KCEthanol than in KCControl.
Fig. 4.
AA and eicosapentaenoic acid (EPA) but not oleic acid (OA) increase hydroperoxides in KC. KCControl and KCEthanol were incubated with 0–10 μM AA, OA, or EPA for 24 h. Intracellular hydroperoxides (mostly H2O2) were determined by DCFDA fluorescence (A) and secreted hydroperoxides by the ferrous oxidation-xylenol orange method (B). Results are calculated as fold change over the nontreated KCControland are expressed as means ± SE for n = 6. *P < 0.05 and ***P < 0.001 for fatty acid-treated vs. control; ♦P < 0.05, ♦♦P < 0.01 and ♦♦♦P < 0.001 for KCEthanol vs. KCControl. Nordihydroguaiaretic acid (NDGA) and NS-398 block the increase in hydroperoxides by AA in KC. KCControl and KCEthanol were incubated with 0–10 μM AA in combination with 0–10 μM NS398, a cyclooxygenase (COX) inhibitor, or with 0–10 μM NDGA, a lipoxygenase (LOX) inhibitor, and intracellular hydroperoxides were measured by DCFDA fluorescence (C). Results are calculated as fold change over the nontreated KCControland are expressed as means ± SE for n = 6. ●●P < 0.01 for AA-treated vs. control; **P < 0.01 and ***P < 0.001 for inhibitor treated or cotreated vs. control; ♦P < 0.05 and ♦♦P < 0.01 for KCEthanol vs. KCControl.
Lastly, we evaluated whether AA could also enhance ROS generation by its own metabolism via the COX and/or the LOX pathways. Using NS398 and nordihydroguaiaretic acid (NDGA), inhibitors of the COX and the LOX pathways, respectively, we measured intracellular (Fig. 4C) and secreted hydroperoxides (not shown). AA elevated hydroperoxides more in KCEthanol than in KCControl, which was blocked by NDGA and to a lesser extent by NS398, suggesting that AA metabolism via the LOX and COX pathways also contributes to enhance oxidant stress (Fig. 4C).
AA upregulates TNFα in KC.
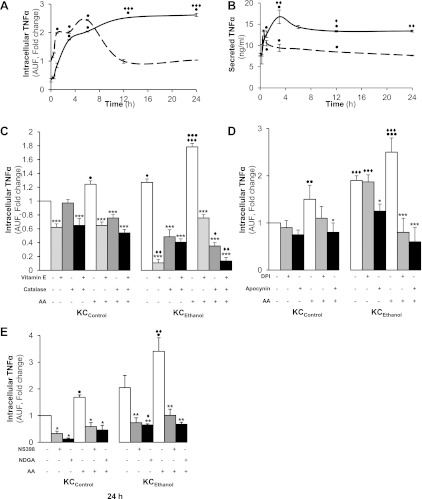
Because we hypothesized that AA could regulate ROS generation in KC and as a corollary elevate TNFα production, first, to determine the time point for maximal TNFα induction under AA challenge, we carried out a time-course experiment from 0–24 h and measured intra- and extracellular TNFα in KCControl and in KCEthanol. AA rapidly increased intracellular TNFα protein (Fig. 5A) and mRNA (not shown), while secreted TNFα peaked at 1 h decaying thereafter in KCControl and peaked at 3 h but remained elevated over a 24 h period in KCEthanol (Fig. 5B). Antioxidants (vitamin E, catalase or the combination of both) and NADPH oxidase inhibitors (apocynin and DPI) decreased the AA-stimulated intracellular TNFα induction (Fig. 5, C and D) and TNFα secretion (not shown). Likewise, blocking AA metabolism with NS398 or NDGA prevented the AA-mediated increase in TNFα production over 24 h both in KCControl and in KCEthanol (Fig. 5E). Therefore, the AA-mediated ROS increase, likely via NADPH oxidase activity and AA metabolism, regulates TNFα production, which is greater in KCEthanol than in KCControl.
Fig. 5.
AA Upregulates TNFα in KC. A time-course experiment was carried out for intracellular TNFα production by KCControl(dotted line) and KCEthanol (solid line) following AA exposure up to 24 h (A). Under the same culture conditions, secreted TNFα was evaluated by ELISA (B). KCControl and KCEthanolwere incubated from 0 to 24 h with 0–10 μM AA (control), 50 μM vitamin E, 200 U/ml of catalase, or both and intracellular TNFα was measured by flow cytometry (C). Cells were also cotreated with 0–10 μM AA (control), 10 μM DPI, or 300 μM apocynin and NADPH oxidase inhibitors, and intracellular TNFα was determined by flow cytometry (D). Likewise, cells were coincubated with 0–10 μM AA (control), 0–10 μM NS398, a COX inhibitor, and 0–10 μM NDGA, a LOX inhibitor, and intracellular TNFα was determined by flow cytometry (E). In A-E, results are calculated as fold change over the nontreated KCControland are expressed as means ± SE for n = 6. ●P < 0.05, ●●P < 0.01, and ●●●P < 0.001 for AA treated vs. control; *P < 0.05, **P < 0.01, and ***P < 0.001 for antioxidant or inhibitor treated or cotreated vs. control; ♦P < 0.05, ♦♦P < 0.01, and ♦♦♦P < 0.001 for KCEthanol vs. KCControl.
ERK1/2 phosphorylation conditions TNFα upregulation by AA in KC.
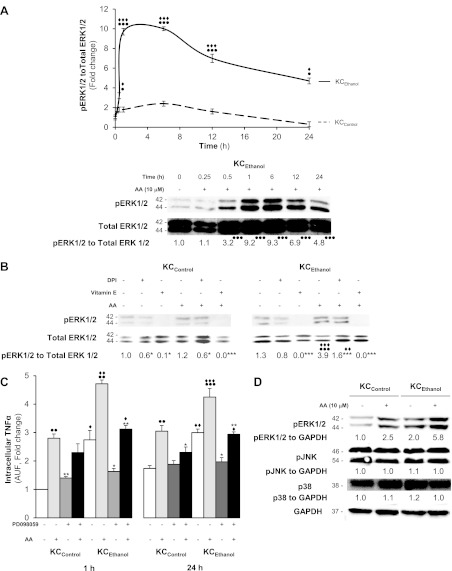
Since stress-activated kinases are sensitive to prooxidants, we tested whether these kinases could play a role in the AA induction of TNFα. Analysis of ROS-sensitive kinases showed that AA increased only pERK1/2 but not pJNK or p38. This expression was significantly higher in KCEthanol than in KCControl (Fig. 6A). This increase was blunted to some extent by DPI -a NADPH oxidase inhibitor- and completely blocked by vitamin E (Fig. 6B). To link AA with pERK1/2 and TNFα upregulation, cells were treated with PD098059, an inhibitor of the mitogen extracellular kinase pathway. PD098059 prevented both pERK1/2 expression and TNFα upregulation by AA in KC, thus establishing a connection among AA, pERK1/2, and the TNFα increase (Fig. 6, C and D).
Fig. 6.
Treatment with AA induces ERK1/2 phosphorylation but no changes in JNK or p38. Western blot analysis of total and pERK1/2 in KCControl(dotted line) and KCEthanol (solid line) treated with 0–10 μM AA up to 24 h. Densitometry is shown at the top and a representative blot for KCEthanol at the bottom (A). KCControl and KCEthanol were incubated with 10 μM DPI or 50 μM vitamin E before AA exposure. Western blot shows a decrease in ERK1/2 phosphorylation by vitamin E and to a lesser extent by DPI in both KCControl and KCEthanol (B). In A and B, results are expressed as arbitrary densitometry units under the blots and are average values of n = 6; the quantification of the signal is referred to total ERK1/2. KCControl and KCEthanol were incubated with 0–1 μM PD098059, a MEK1/2 inhibitor, 1 h before 0–10 μM AA treatment, and intracellular TNFα was determined at 1 and 24 h (C). Cells were also cotreated with AA, and expression of ERK1/2, JNK, and p38 was analyzed by Western blot. GAPDH was used as the loading control (D). Results are calculated as fold change over the nontreated KCControland are expressed as means ± SE for n = 6. ●P < 0.05, ●●P < 0.01, and ●●●P < 0.001 for AA-treated vs. control; *P < 0.05, **P < 0.01, and ***P < 0.001 for DPI, vitamin E or PD098059 treated or cotreated vs. control; ♦P < 0.05, ♦♦P < 0.01 and ♦♦♦P < 0.001 for KCEthanol vs. KCControl.
Egr1 acts as a downstream signal in the ROS-pERK1/2-dependent Upregulation of TNFα by AA in KC.
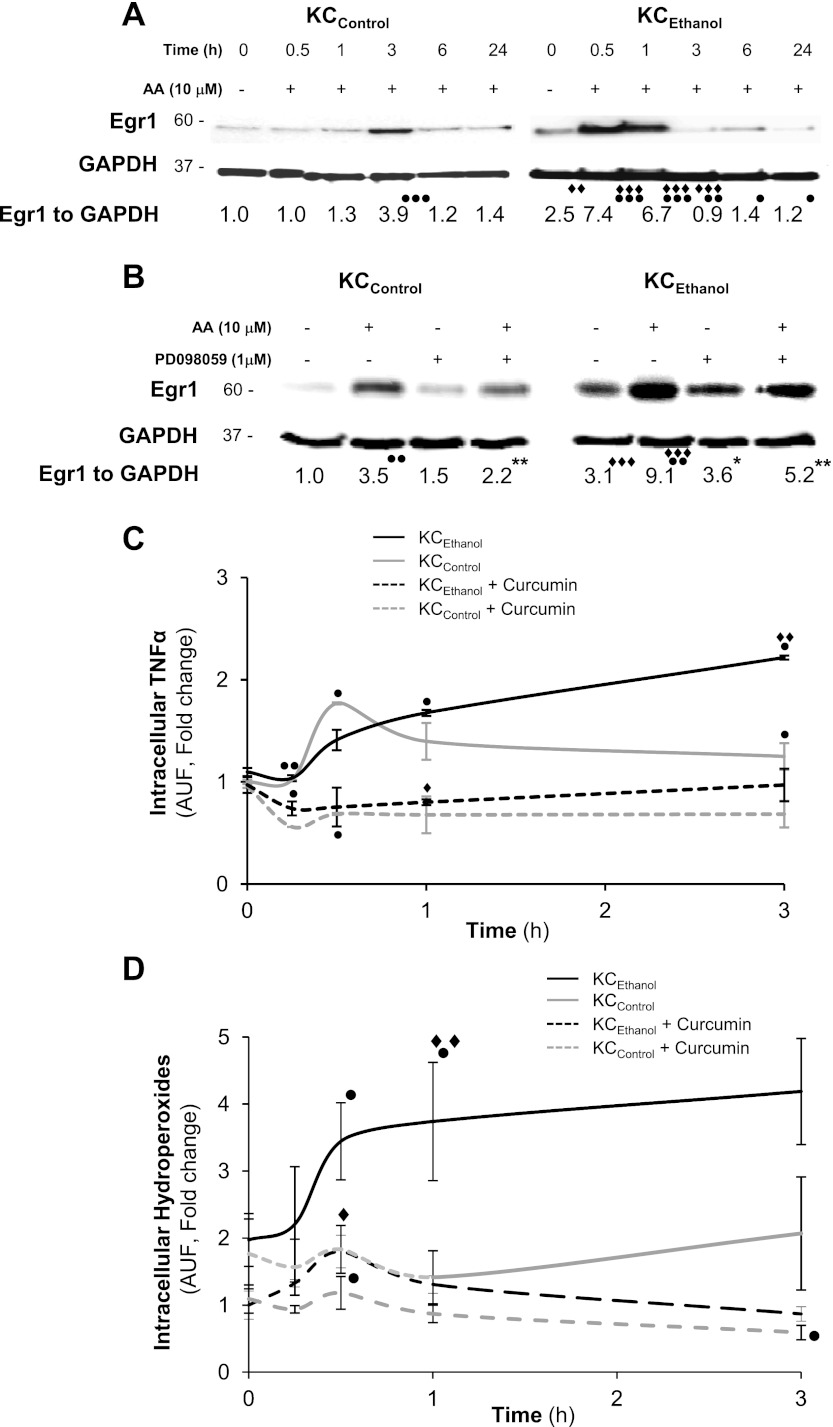
Lastly, we evaluated whether Egr1, a direct target of pERK1/2, was responsible for the TNFα induction by AA in KC. Nuclear translocation of Egr1 significantly increased in KCEthanol exposed to AA up to 1 hour compared with KCControl (Fig. 7A). Next, we studied the expression of Egr1 within the first h after treatment with AA in the presence of PD098059. Blocking pERK1/2, lowered nuclear translocation of Egr1 more in KCEthanol than in KCControl (Fig. 7B). Finally, to determine whether a link existed between Egr1 translocation and the AA-mediated induction of TNFα, cells were coincubated with curcumin, an inhibitor or Egr1 (8, 14), along with AA, and TNFα levels and intracellular hydroperoxides were measured. Curcumin blocked the AA-mediated induction of TNFα more in KCEthanol than in KCControl and prevented the generation of intracellular hydroperoxides (Fig. 7, C and D), hence establishing a link among AA induction of ROS, AA-increased Egr1 nuclear translocation, and TNFα induction in KC.
Fig. 7.
AA contributes to nuclear translocation of early growth response-1 (Egr1) for TNFα upregulation in KC. KCControl and KCEthanol were treated with 0–10 μM AA from 0 to 24 h, and nuclear expression of Egr1 was analyzed by Western blot (A). Cells were also cotreated with AA and PD098059 and nuclear expression of Egr1 was analyzed by Western blot (B). Intracellular TNFα in the presence or absence of curcumin measured by flow cytometry (C). A time-course experiment was carried out in the presence or absence of curcumin and intracellular hydroperoxides were measured by DCFDA fluorescence (D). Results are expressed as arbitrary densitometry units under the blots and are average values of n = 6. ●P < 0.05, ●●P < 0.01, and ●●●P < 0.001 for AA treated vs. control; *P < 0.05 and **P < 0.01 for PD098059 treated or cotreated vs. control; ♦♦P < 0.01 and ♦♦♦P < 0.001 for KCEthanol vs. KCControl.
DISCUSSION
A growing body of work on ALD suggests a two-hit theory where fat and alcohol work in a consorted fashion to cause liver injury. While dietary fat contributes to the development of alcohol-induced liver damage, the source of fat is fundamental (26, 40). Indeed, diets containing PUFAs promote, whereas diets containing saturated fat prevent liver injury (24). We (10) previously demonstrated that chronic ethanol feeding and a representative PUFA (e.g., AA) modulate KC activation and the fibrogenic response in HSC in coculture with KC. The present study focused on elucidating the mechanism whereby AA and ethanol synergize to upregulate TNFα production in KC, thus contributing to the pathophysiology of ALD.
AA activated KC as depicted by increased cytoplasmic processes and membrane ruffling (10). Since AA-derived species and AA metabolism generate a state of oxidant stress contributing to liver injury, we measured the extent of prooxidant stress in KC. AA increased intra- and extracellular LPO, H2O2, and O2·− more in KCEthanol than in KCControl, most likely by enhancing the effect of ethanol. Addition of antioxidants, NADPH inhibitors, and COX and LOX inhibitors prevented these effects. There was an increase in the activity of the antioxidant enzymes by AA in KC, likely suggesting that upregulation of the antioxidant defense was necessary to allow KC to cope with cellular stress. AA minimally altered xanthine oxidase and CYP2E1 activities and did not change ATP levels (46); however, it greatly activated NADPH oxidase, triggering significant ROS generation, which was blocked by a NADPH inhibitor. Thus AA induced oxidant stress via both NADPH oxidase activity and by its own metabolism, effects that were more apparent in KCEthanol than in KCControl.
To determine the specificity of AA in mediating the abovementioned effects, we incubated cells with EPA, an n-3 PUFA, and with OA, a monounsaturated fatty acid, the latter with antioxidant properties. Both AA and EPA increased oxidative stress, indicating a role for both series of PUFAs compared with a monounsaturated fatty acid, in mediating ROS generation in KC. Moreover, ROS induction by PUFAs was increased by ethanol, thus indicating that the effects of PUFAs and ethanol are additive.
Because of its prominent role in the pathophysiology of ALD (10, 37, 41), we next evaluated TNFα production in KCControl and KCEthanol under AA treatment. TNFα increased significantly and rapidly by AA challenge along with ROS generation, and these effects were more apparent in KCEthanol than in KCControl. Antioxidants, NADPH oxidase inhibitors, and COX and LOX blocking agents prevented the TNFα increase by AA. Thus AA activation of NADPH oxidase as well as AA metabolism played a role in regulating TNFα in KC.
Since stress-activated kinases are sensitive to prooxidants, we hypothesized that they could play a potential role in the AA induction of TNFα. Several studies (5, 18–19, 36) have identified the MAPK family ERK1/2 as a key target for ethanol in KC. Of all the stress-sensitive kinases analyzed under AA challenge, there was only an increase in pERK1/2, which correlated with the TNFα upregulation. The increase was significantly higher in KCEthanol than in KCControl. Because coincubation with PD098059 blunted the increase in TNFα by AA, we concluded that pERK1/2 was an upstream kinase regulating TNFα production.
We (10) previously reported that ethanol and AA synergize to activate KC; thus we evaluated the involvement of chronic alcohol feeding in the ROS-driven pERK1/2-mediated upregulation of TNFα. ROS production increased more in KCEthanolthan in KCControl (10, 37, 40) as occurred for TNFα. Moreover, ERK1/2 phosphorylation was higher in KCEthanol than in KCControl exposed to AA. These results, consistent with previous work by other laboratories, including ours (10, 36, 38), suggest a role for ROS in activating the pERK1/2 pathway and confirm that ethanol increases the AA-mediated effects on KC-derived TNFα production.
Egr1 is a member of the immediate early gene family and plays a role in mediating cellular responses to environmental stress such as ischemia, mechanical injury, and ionizing radiation (18, 34). Egr1 binding to the Tnfα promoter is required for full activation of TNFα transcription (31–32, 47). Egr1 was rapidly induced after AA challenge more significantly in KCEthanol than in KCControl suggesting that AA drives TNFα induction in an Egr1-dependent manner and that ethanol synergizes with AA to this effect. To conclude, a link between pERK1/2 and Egr1 was established when PD098059 blocked Egr1 induction and TNFα increase. Likewise, a connection between Egr1 and TNFα upregulation was made when curcumin, which prevents nuclear Egr1 translocation (8, 14), blunted the TNFα upregulation by AA.
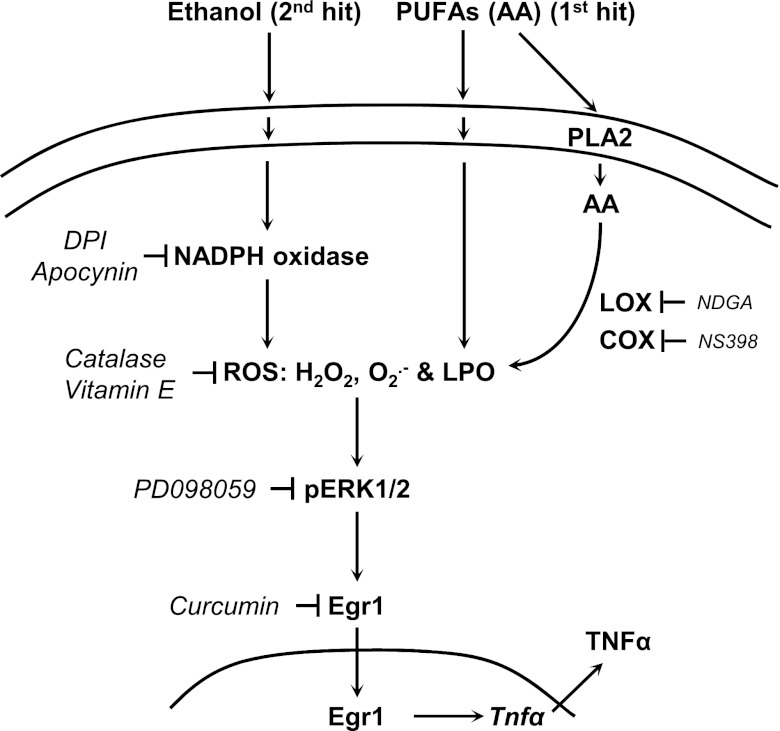
In summary, the data (Fig. 8) suggest that the AA-driven increase in NADPH oxidase and AA metabolism per se contribute to elevate ROS generation by KC and that ethanol synergizes to further enhance these events. Because of the oxidative burst, KC respond inducing ERK1/2 phosphorylation and translocating Egr1 into the nucleus to increase TNFα, therefore, contributing to alcohol-mediated liver damage.
Fig. 8.
Suggested mechanism for the effects of AA and ethanol on TNFα production by KC. Chronic ethanol feeding leads to an increase in NADPH oxidase-derived ROS generation in KC (e.g., LPO, hydroperoxides, such as H2O2, and O2·−). AA enhances these effects by increasing LPO or by its own metabolism via LOX and COX. The increase in ROS leads to phosphorylation of ERK1/2, translocation of Egr1 into the nucleus, and TNFα upregulation. NADPH oxidase inhibitors, antioxidants, PD098059, and curcumin prevent these effects. In aggregate, this mechanism could contribute to the pathophysiology of alcoholic liver disease.
GRANTS
Support for the study was provided by Postdoctoral Fellowship from the Spanish Ministry of Education and Science (Ref. No. EX2006–0070) and Postdoctoral Support from the Education and Outreach Core of The New York Systems Biology Center (to F. J. Cubero). The US Public Health Service also provided funding for National Institute of Diabetes and Digestive and Kidney Diseases Grants 5R01-DK-069286 and 2R56-DK-069286 and National Institute on Alcohol Abuse and Alcoholism Grant 5P20-AA-017067 (to N. Nieto).
DISCLOSURES
No conflicts of interest, financial or otherwise, are declared by the author(s).
AUTHOR CONTRIBUTIONS
Author contributions: F.J.C. performed experiments; F.J.C. and N.N. analyzed data; F.J.C. and N.N. interpreted results of experiments; F.J.C. and N.N. prepared figures; F.J.C. and N.N. drafted manuscript; F.J.C. and N.N. edited and revised manuscript; N.N. conception and design of research; N.N. approved final version of manuscript.
ACKNOWLEDGMENTS
We thank all members from the Nieto Laboratory for helpful insight throughout this project. We also thank Dr. J. Allina (Mount Sinai School of Medicine) for technical assistance in the FACS experiments, Dr. Y. A. Nevzorova (University Hospital RWTH Aachen) for help with protein isolation, and Dr. C. Trautwein (University Hospital RWTH Aachen) for allowing F. J. Cubero to finalize some experiments in the laboratory.
REFERENCES
- 1. Abou-Elella AM, Siendones E, Padillo J, Montero JL, De la Mata M, Muntane Relat J. Tumour necrosis factor-alpha and nitric oxide mediate apoptosis by d-galactosamine in a primary culture of rat hepatocytes: exacerbation of cell death by cocultured Kupffer cells. Can J Gastroenterol 16: 791–799, 2002 [DOI] [PubMed] [Google Scholar]
- 2. Adachi Y, Bradford BU, Gao W, Bojes HK, Thurman RG. Inactivation of Kupffer cells prevents early alcohol-induced liver injury. Hepatology 20: 453–460, 1994 [PubMed] [Google Scholar]
- 3. Brock RW, Lawlor DK, Harris KA, Potter RF. Initiation of remote hepatic injury in the rat: interactions between Kupffer cells, tumor necrosis factor-alpha, and microvascular perfusion. Hepatology 30: 137–142, 1999 [DOI] [PubMed] [Google Scholar]
- 4. Canbay A, Feldstein AE, Higuchi H, Werneburg N, Grambihler A, Bronk SF, Gores GJ. Kupffer cell engulfment of apoptotic bodies stimulates death ligand and cytokine expression. Hepatology 38: 1188–1198, 2003 [DOI] [PubMed] [Google Scholar]
- 5. Cao Q, Mak KM, Lieber CS. Dilinoleoylphosphatidylcholine decreases LPS-induced TNF-alpha generation in Kupffer cells of ethanol-fed rats: respective roles of MAPKs and NF-kappaB. Biochem Biophys Res Commun 294: 849–853, 2002 [DOI] [PubMed] [Google Scholar]
- 6. Carlberg I, Mannervik B. Glutathione reductase. Methods Enzymol 113: 484–490, 1985 [DOI] [PubMed] [Google Scholar]
- 7. Carmiel-Haggai M, Cederbaum AI, Nieto N. A high-fat diet leads to the progression of non-alcoholic fatty liver disease in obese rats. FASEB J 19: 136–138, 2005 [DOI] [PubMed] [Google Scholar]
- 8. Chen A, Xu J, Johnson AC. Curcumin inhibits human colon cancer cell growth by suppressing gene expression of epidermal growth factor receptor through reducing the activity of the transcription factor Egr-1. Oncogene 25: 278–287, 2006 [DOI] [PubMed] [Google Scholar]
- 9. Claiborne A, Fridovich I. Purification of the o-dianisidine peroxidase from Escherichia coli B. Physicochemical characterization and analysis of its dual catalatic and peroxidatic activities. J Biol Chem 254: 4245–4252, 1979 [PubMed] [Google Scholar]
- 10. Cubero FJ, Nieto N. Ethanol and arachidonic acid synergize to activate Kupffer cells and modulate the fibrogenic response via tumor necrosis factor alpha, reduced glutathione, and transforming growth factor beta-dependent mechanisms. Hepatology 48: 2027–2039, 2008 [DOI] [PMC free article] [PubMed] [Google Scholar]
- 11. Donato MT, Jimenez N, Castell JV, Gomez-Lechon MJ. Fluorescence-based assays for screening nine cytochrome P450 (P450) activities in intact cells expressing individual human P450 enzymes. Drug Metab Dispos 32: 699–706, 2004 [DOI] [PubMed] [Google Scholar]
- 12. Enomoto N, Yamashina S, Kono H, Schemmer P, Rivera CA, Enomoto A, Nishiura T, Nishimura T, Brenner DA, Thurman RG. Development of a new, simple rat model of early alcohol-induced liver injury based on sensitization of Kupffer cells. Hepatology 29: 1680–1689, 1999 [DOI] [PubMed] [Google Scholar]
- 13. Fraga CG, Leibovitz BE, Tappel AL. Halogenated compounds as inducers of lipid peroxidation in tissue slices. Free Radic Biol Med 3: 119–123, 1987 [DOI] [PubMed] [Google Scholar]
- 14. Giri RK, Rajagopal V, Kalra VK. Curcumin, the active constituent of turmeric, inhibits amyloid peptide-induced cytochemokine gene expression and CCR5-mediated chemotaxis of THP-1 monocytes by modulating early growth response-1 transcription factor. J Neurochem 91: 1199–1210, 2004 [DOI] [PubMed] [Google Scholar]
- 15. Habig WH, Pabst MJ, Jakoby WB. Glutathione S transferases. The first enzymatic step in mercapturic acid formation. J Biol Chem 249: 7130–7139, 1974 [PubMed] [Google Scholar]
- 16. Hedley D, Chow S. Flow cytometric measurement of lipid peroxidation in vital cells using parinaric acid. Cytometry 13: 686–692, 1992 [DOI] [PubMed] [Google Scholar]
- 17. Hellerbrand Wang SC, Tsukamoto H, Brenner DA, Rippe RA. Expression of intracellular adhesion molecule 1 by activated hepatic stellate cells. Hepatology 24: 670–676, 1996 [DOI] [PubMed] [Google Scholar]
- 18. Kishore R, Hill JR, McMullen MR, Frenkel J, Nagy LE. ERK1/2 and Egr-1 contribute to increased TNF-α production in rat Kupffer cells after chronic ethanol feeding. Am J Physiol Gastrointest Liver Physiol 282: G6–G15, 2002 [DOI] [PubMed] [Google Scholar]
- 19. Kishore R, McMullen MR, Nagy LE. Stabilization of tumor necrosis factor alpha mRNA by chronic ethanol: role of A + U-rich elements and p38 mitogen-activated protein kinase signaling pathway. J Biol Chem 276: 41930–41937, 2001 [DOI] [PubMed] [Google Scholar]
- 20. Kono H, Rusyn I, Yin M, Gabele E, Yamashina S, Dikalova A, Kadiiska MB, Connor HD, Mason RP, Segal BH, Bradford BU, Holland SM, Thurman RG. NADPH oxidase-derived free radicals are key oxidants in alcohol-induced liver disease. J Clin Invest 106: 867–872, 2000 [DOI] [PMC free article] [PubMed] [Google Scholar]
- 21. Lieber CS, DeCarli LM. Liquid diet technique of ethanol administration: 1989 update. Alcohol Alcohol 24: 197–211, 1989 [PubMed] [Google Scholar]
- 22. Long L, Evans PJ, Halliwell B. Hydrogen peroxide in human urine: implications for antioxidant defense and redox regulation. Biochem Biophys Res Commun 262: 605–609, 1999 [DOI] [PubMed] [Google Scholar]
- 23. Mari M, Cederbaum AI. CYP2E1 overexpression in HepG2 cells induces glutathione synthesis by transcriptional activation of gamma-glutamylcysteine synthetase. J Biol Chem 275: 15563–15571, 2000 [DOI] [PubMed] [Google Scholar]
- 24. Nanji AA. Role of different dietary fatty acids in the pathogenesis of experimental alcoholic liver disease. Alcohol 34: 21–25, 2004 [DOI] [PubMed] [Google Scholar]
- 25. Nanji AA, Jokelainen K, Fotouhinia M, Rahemtulla A, Thomas P, Tipoe GL, Su GL, Dannenberg AJ. Increased severity of alcoholic liver injury in female rats: role of oxidative stress, endotoxin, and chemokines. Am J Physiol Gastrointest Liver Physiol 281: G1348–G1356, 2001 [DOI] [PubMed] [Google Scholar]
- 26. Nanji AA, Jokelainen K, Tipoe GL, Rahemtulla A, Dannenberg AJ. Dietary saturated fatty acids reverse inflammatory and fibrotic changes in rat liver despite continued ethanol administration. J Pharmacol Exp Ther 299: 638–644, 2001 [PubMed] [Google Scholar]
- 27. Nieto N. Oxidative-stress and IL-6 mediate the fibrogenic effects of [corrected] Kupffer cells on stellate cells. Hepatology 44: 1487–1501, 2006 [DOI] [PubMed] [Google Scholar]
- 28. Nieto N. Oxidative-stress and IL-6 mediate the fibrogenic effects of rodent Kupffer cells on stellate cells. Hepatology 44: 1487–1501, 2006 [DOI] [PubMed] [Google Scholar]
- 29. Nieto N, Friedman SL, Cederbaum AI. Stimulation and proliferation of primary rat hepatic stellate cells by cytochrome P450 2E1-derived reactive oxygen species. Hepatology 35: 62–73, 2002 [DOI] [PubMed] [Google Scholar]
- 30. Paoletti F, Mocali A. Determination of superoxide dismutase activity by purely chemical system based on NAD(P)H oxidation. Methods Enzymol 186: 209–220, 1990 [DOI] [PubMed] [Google Scholar]
- 31. Pritchard MT, Cohen JI, Roychowdhury S, Pratt BT, Nagy LE. Early growth response-1 attenuates liver injury and promotes hepatoprotection after carbon tetrachloride exposure in mice. J Hepatol 53: 655–662, 2010 [DOI] [PMC free article] [PubMed] [Google Scholar]
- 32. Pritchard MT, Malinak RN, Nagy LE. Early growth response (EGR)-1 is required for timely cell-cycle entry and progression in hepatocytes after acute carbon tetrachloride exposure in mice. Am J Physiol Gastrointest Liver Physiol 300: G1124–G1131, 2011 [DOI] [PMC free article] [PubMed] [Google Scholar]
- 33. Reznick AZ, Packer L. Oxidative damage to proteins: spectrophotometric method for carbonyl assay. Methods Enzymol 233: 357–363, 1994 [DOI] [PubMed] [Google Scholar]
- 34. Shi L, Kishore R, McMullen MR, Nagy LE. Chronic ethanol increases lipopolysaccharide-stimulated Egr-1 expression in RAW 264.7 macrophages: contribution to enhanced tumor necrosis factor alpha production. J Biol Chem 277: 14777–14785, 2002 [DOI] [PubMed] [Google Scholar]
- 35. Stuart WD, Kulkarni RM, Gray JK, Vasiliauskas J, Leonis MA, Waltz SE. Ron receptor regulates Kupffer cell-dependent cytokine production and hepatocyte survival following endotoxin exposure in mice. Hepatology 53: 1618–1628, 2011 [DOI] [PMC free article] [PubMed] [Google Scholar]
- 36. Thakur V, Pritchard MT, McMullen MR, Wang Q, Nagy LE. Chronic ethanol feeding increases activation of NADPH oxidase by lipopolysaccharide in rat Kupffer cells: role of increased reactive oxygen in LPS-stimulated ERK1/2 activation and TNF-alpha production. J Leukoc Biol 79: 1348–1356, 2006 [DOI] [PMC free article] [PubMed] [Google Scholar]
- 37. Thurman RG., 2nd Alcoholic liver injury involves activation of Kupffer cells by endotoxin. Am J Physiol Gastrointest Liver Physiol 275: G605–G611, 1998 [DOI] [PubMed] [Google Scholar]
- 38. Thurman RG, Bradford BU, Iimuro Y, Frankenberg MV, Knecht KT, Connor HD, Adachi Y, Wall C, Arteel GE, Raleigh JA, Forman DT, Mason RP. Mechanisms of alcohol-induced hepatotoxicity: studies in rats. Front Biosci 4: e42–46, 1999 [DOI] [PubMed] [Google Scholar]
- 39. Thurman RG, Bradford BU, Iimuro Y, Knecht KT, Arteel GE, Yin M, Connor HD, Wall C, Raleigh JA, Frankenberg MV, Adachi Y, Forman DT, Brenner D, Kadiiska M, Mason RP. The role of gut-derived bacterial toxins and free radicals in alcohol-induced liver injury. J Gastroenterol Hepatol 13 Suppl: S39–50, 1998 [DOI] [PubMed] [Google Scholar]
- 40. Thurman RG, Bradford BU, Iimuro Y, Knecht KT, Connor HD, Adachi Y, Wall C, Arteel GE, Raleigh JA, Forman DT, Mason RP. Role of Kupffer cells, endotoxin and free radicals in hepatotoxicity due to prolonged alcohol consumption: studies in female and male rats. J Nutr 127: 903S–906S, 1997 [DOI] [PubMed] [Google Scholar]
- 41. Tilg H, Diehl AM. Cytokines in alcoholic and nonalcoholic steatohepatitis. N Engl J Med 343: 1467–1476, 2000 [DOI] [PubMed] [Google Scholar]
- 42. Tsukamoto H. Cytokine regulation of hepatic stellate cells in liver fibrosis. Alcohol Clin Exp Res 23: 911–916, 1999 [PubMed] [Google Scholar]
- 43. Tsukamoto H. Redox regulation of cytokine expression in Kupffer cells. Antioxid Redox Signal 4: 741–748, 2002 [DOI] [PubMed] [Google Scholar]
- 44. Uesugi T, Froh M, Arteel GE, Bradford BU, Thurman RG. Toll-like receptor 4 is involved in the mechanism of early alcohol-induced liver injury in mice. Hepatology 34: 101–108, 2001 [DOI] [PubMed] [Google Scholar]
- 45. Uesugi T, Froh M, Arteel GE, Bradford BU, Wheeler MD, Gabele E, Isayama F, Thurman RG. Role of lipopolysaccharide-binding protein in early alcohol-induced liver injury in mice. J Immunol 168: 2963–2969, 2002 [DOI] [PubMed] [Google Scholar]
- 46. Wu D, Cederbaum AI. Role of p38 MAPK in CYP2E1-dependent arachidonic acid toxicity. J Biol Chem 278: 1115–1124, 2003 [DOI] [PubMed] [Google Scholar]
- 47. Yao J, Mackman N, Edgington TS, Fan ST. Lipopolysaccharide induction of the tumor necrosis factor-alpha promoter in human monocytic cells. Regulation by Egr-1, c-Jun, and NF-kappaB transcription factors. J Biol Chem 272: 17795–17801, 1997 [DOI] [PubMed] [Google Scholar]
- 48. Yin M, Bradford BU, Wheeler MD, Uesugi T, Froh M, Goyert SM, Thurman RG. Reduced early alcohol-induced liver injury in CD14-deficient mice. J Immunol 166: 4737–4742, 2001 [DOI] [PubMed] [Google Scholar]


